Kubernetes Troubleshooting for Application Developers

Troubleshooting Scenarios

Schrodingers Deployment

Welcome to this lesson on troubleshooting a peculiar behavior in Kubernetes deployments. In this guide, we will explore why our blue service sometimes returns responses from the green application. Let’s dive in.


Observing the Problem

When inspecting the cluster, both the blue and green deployments are running as expected. The following command output confirms this:

controlplane ~ ➜ k get all
NAME                                       READY   STATUS      RESTARTS   AGE
pod/blue-6c7b7b965f-8vxwp                   1/1     Running     0          21m
pod/blue-6c7b7b965f-zddzq                   1/1     Running     0          24m
pod/green-864c4d957c-tnq9r                  1/1     Running     0          24m
pod/green-864c4d957c-w7ktb                  1/1     Running     0          93s

NAME                        TYPE        CLUSTER-IP      EXTERNAL-IP   PORT(S)          AGE
service/blue-service       NodePort    10.98.48.50     <none>       8080:30102/TCP   24m
service/green-service      NodePort    10.107.193.230  <none>       8080:30101/TCP   24m
service/kubernetes         ClusterIP   10.96.0.1       <none>       443/TCP         46m

NAME                        READY   UP-TO-DATE   AVAILABLE   AGE
deployment.apps/blue      2/2     2            2           24m
deployment.apps/green     2/2     2            2           24m

NAME                                              DESIRED   CURRENT   READY   AGE
replicaset.apps/blue-6c7b7b965f                   2         2         2       24m
replicaset.apps/green-864c4d957c                   2         2         2       24m
controlplane ~ ➜

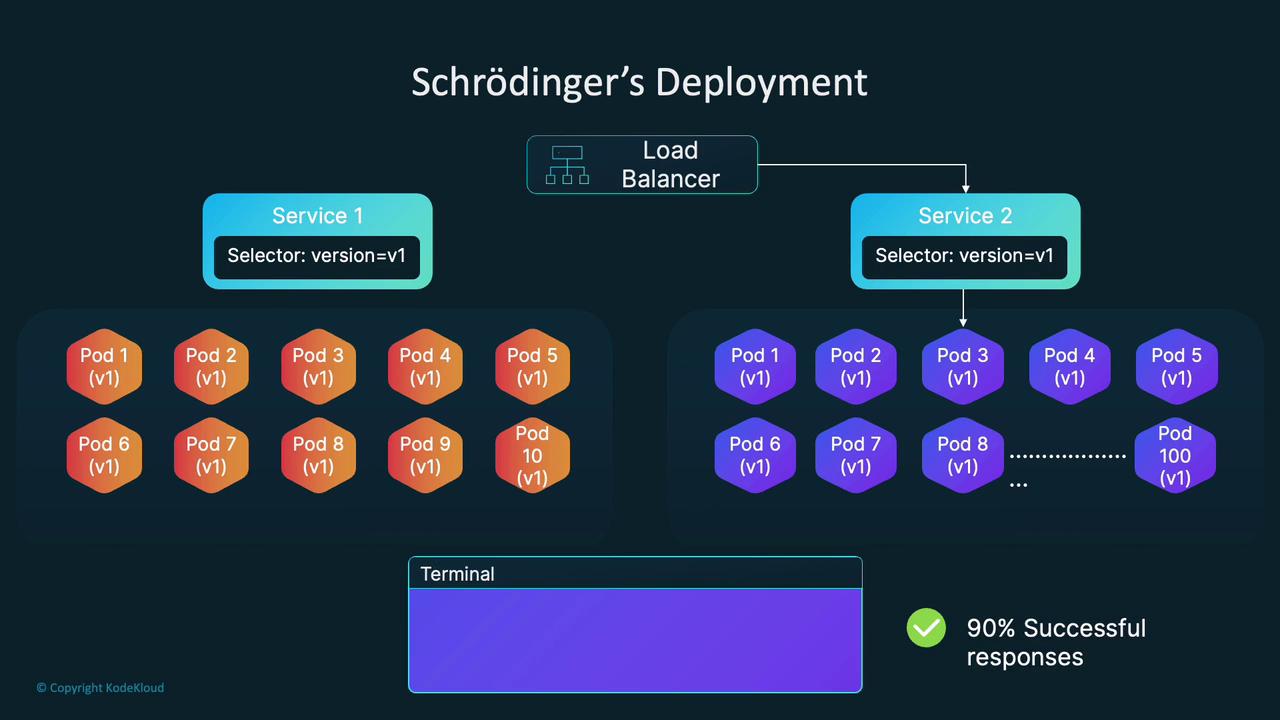
The blue service is expected to serve a blue screen, while the green service serves a green screen using a basic web server. When accessing the green service in your browser, each refresh may hit a different replica due to load balancing across multiple pods.

However, upon accessing the blue service endpoint repeatedly, you may notice an unexpected mix of responses that sometimes include a green background.


Investigating Service Definitions

To diagnose the issue, let's review the service definitions.

Current Cluster State

The initial output of our cluster services is as follows:

controlplane ~ ➜ k get all
NAME                                                      READY   STATUS    RESTARTS   AGE
pod/blue-6c7b7b965f-8vxwp                                 1/1     Running   0          21m
pod/blue-6c7b7b965f-zddzq                                 1/1     Running   0          24m
pod/green-864c4d957c-tnq7r                                1/1     Running   0          24m
pod/green-864c4d957c-w7ktb                                1/1     Running   0          93s

NAME                    TYPE        CLUSTER-IP      EXTERNAL-IP   PORT(S)             AGE
service/blue-service    NodePort    10.98.48.50     <none>       8080:30102/TCP     24m
service/green-service   NodePort    10.107.193.230  <none>       8080:30101/TCP     24m
service/kubernetes      ClusterIP   10.96.0.1       <none>       443/TCP            46m

NAME                                         READY   UP-TO-DATE   AVAILABLE   AGE
deployment.apps/blue                        2/2     2            2           24m
deployment.apps/green                       2/2     2            2           24m

NAME                                                   DESIRED   CURRENT   READY   AGE
replicaset.apps/blue-6c7b7b965f                        2         2         2       24m
replicaset.apps/green-864c4d957c                        2         2         2       24m
controlplane ~ ➜

Listing Service Definition Files

The two service configuration files in the directory are:

controlplane ~ ➜ ls
blue-svc.yaml  green-svc.yaml

blue-svc.yaml

apiVersion: v1
kind: Service
metadata:
  name: blue-service
spec:
  type: NodePort
  selector:
    version: v1
  ports:
    - port: 8080
      targetPort: 8080
      nodePort: 30102

green-svc.yaml

apiVersion: v1
kind: Service
metadata:
  name: green-service
spec:
  type: NodePort
  selector:
    version: v1
    app: green
  ports:
    - port: 8080
      targetPort: 8080
      nodePort: 30101

The green service’s selector uses both version: v1 and app: green, isolating the green pods properly. The blue service, however, only uses version: v1 as its selector. Since both blue and green pods share the version: v1 label, the blue service unintentionally selects green pods too, leading to mixed responses.


Understanding Label Selectors and Endpoints

Kubernetes services route traffic to all pods matching their label selectors. To verify the selected pods for label version=v1, run:

controlplane ~ ➜ k get pods -l version=v1
NAME                     READY   STATUS    RESTARTS   AGE
blue-6c7b7b965f-8xwp     1/1     Running   0          30m
blue-6c7b7b965f-zddzq     1/1     Running   0          33m
green-864c4d957c-tnq9r    1/1     Running   0          33m
green-864c4d957c-w7ktb    1/1     Running   0          10m

Checking the endpoints for each service further clarifies the issue:

controlplane ~ ➜ k get endpoints
NAME            ENDPOINTS                                               AGE
blue-service    10.244.1.2:8080,10.244.1.3:8080,10.244.1.4:8080 + 1 more...   34m
green-service   10.244.1.2:8080                                   34m
kubernetes      192.147.9.6:6443                                  56m

Notice that the blue service includes endpoints for both blue and green pods, whereas the green service correctly targets only green pods.

Tip

Use the command "k edit svc blue-service" to inspect and modify the blue service configuration in real time.


Fixing the Issue

To ensure that the blue service routes traffic only to blue pods, update the blue service selector by adding a unique label. Modify the selector to include both version: v1 and app: blue. After making this change, the blue service will exclusively target blue pods.

Once updated, verify the endpoints again:

controlplane ~ ➜ k get endpoints
NAME            ENDPOINTS                                          AGE
blue-service    10.244.1.2:8080,10.244.1.4:8080                   35m
green-service   10.244.1.3:8080                                   35m
kubernetes      192.147.9.6:6443                                  57m

This confirmation shows that the blue service now exclusively routes requests to the correct blue pods, resolving the intermittent misrouting issue.


Final Thoughts

This troubleshooting exercise highlights the critical importance of using unique labels in Kubernetes deployments. Overlapping selectors can cause unexpected behavior and intermittent failures that are challenging to diagnose in large-scale environments.

Understanding how label selectors, service endpoints, and load balancing interact is vital for maintaining reliable application deployments in Kubernetes.

The image illustrates a Kubernetes deployment setup called "Schrödinger’s Deployment," featuring two services with version selectors, a load balancer, and multiple pods. It also indicates a 90% success rate for responses.

Even if the application appears to work correctly most of the time, such misconfigurations can lead to intermittent issues that are hard to catch during routine monitoring.

The image is a graphic about "Troubleshooting Configuration," featuring an icon of a document with a gear and code symbol, and a note about label issues being overlooked during monitoring.

Having a robust troubleshooting process, including verifying service endpoints and label selectors, is essential for diagnosing and resolving configuration issues in Kubernetes.

The image lists three key considerations: Endpoints Application, Service Load Balancing, and Label Selector Matching, each represented by a distinct icon.

Happy troubleshooting, and see you in the next lesson!

Watch Video

Watch video content

Previous
Case of the Missing Pods