Kubernetes and Cloud Native Associate - KCNA

Cloud Native Observability

Observability Fundamentals

Observability is the capability to understand and measure a system’s state based on the data it generates. By implementing observability within your applications and infrastructure, you gain deep insights into your system's internal workings. This, in turn, speeds up troubleshooting, detects elusive issues, monitors performance, and enhances cross-team collaboration.

The image explains observability as understanding a system's state through data, aiding insights, troubleshooting, problem detection, and performance monitoring.

Without observability, an application behaves like a black box—information enters and exits with little visibility into its internal processes. Observability lifts the veil, showing you how individual components interact within your system. When issues arise, this clarity helps pinpoint the failing component and its root cause.

As system architectures evolve and adopting microservices becomes more common, your infrastructure transforms from a single, monolithic system to a collection of independent, interacting services. This shift means you’re no longer monitoring a unified entity but many small services working together. Such complexity can complicate troubleshooting, as isolating the failing service or component requires detailed insight.

The image discusses the need for observability in complex system architectures, highlighting the transition from monoliths to microservices like email, users, and auth.

Troubleshooting in these environments involves more than spotting symptoms. You need comprehensive data to understand why your application reached a specific state, which component is responsible, and how to mitigate future recurrences. For instance, you may seek answers to rising error rates, increased latency, or frequent service timeouts.

The image discusses the need for detailed information in troubleshooting application issues, focusing on error rates, latency, and service timeouts.

Observability achieves this by leveraging three critical pillars: logging, tracing, and metrics.


Logging

Logs are records of events that provide detailed information about system operations. Each log entry typically features a timestamp marking when the event occurred and a descriptive message. Logs are universally generated by operating systems, applications, and databases, serving as the first data point in your observability strategy.

For example, consider the following log entries:
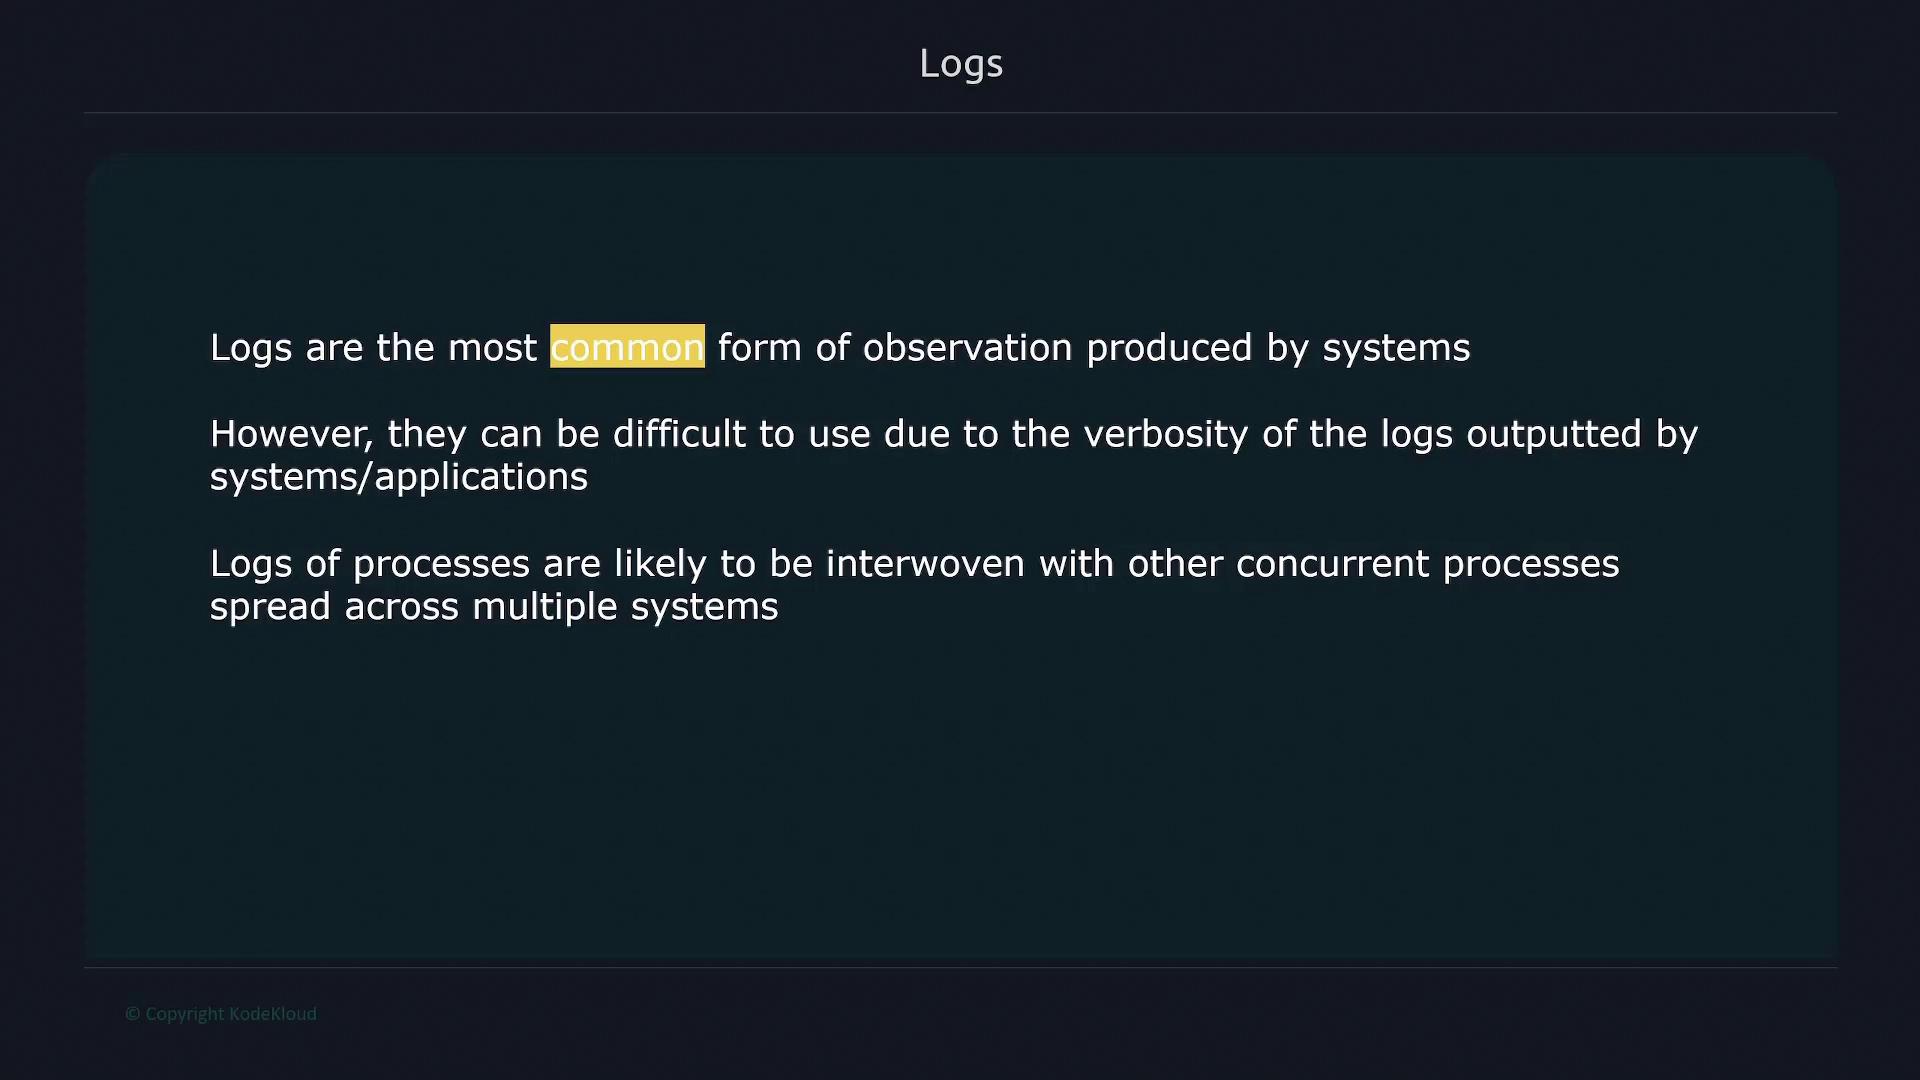
Oct 26 19:35:00 ub1 kernel: [37510.942568] e1000: enp0s3 NIC Link is Down
Oct 26 19:35:00 ub1 kernel: [37510.942697] e1000 0000:00:03.0 enp0s3: Reset adapter
Oct 26 19:35:03 ub1 kernel: [37513.054072] e1000: enp0s3 NIC Link is Up 1000 Mbps Full Duplex, Flow Control: RX

While logs provide valuable contextual data, their high verbosity and the intertwining of processes across multiple systems can complicate the process of pinpointing issues during an outage.

The image describes logs as a common observation form produced by systems, highlighting their verbosity and interwoven nature across multiple systems.


Tracing

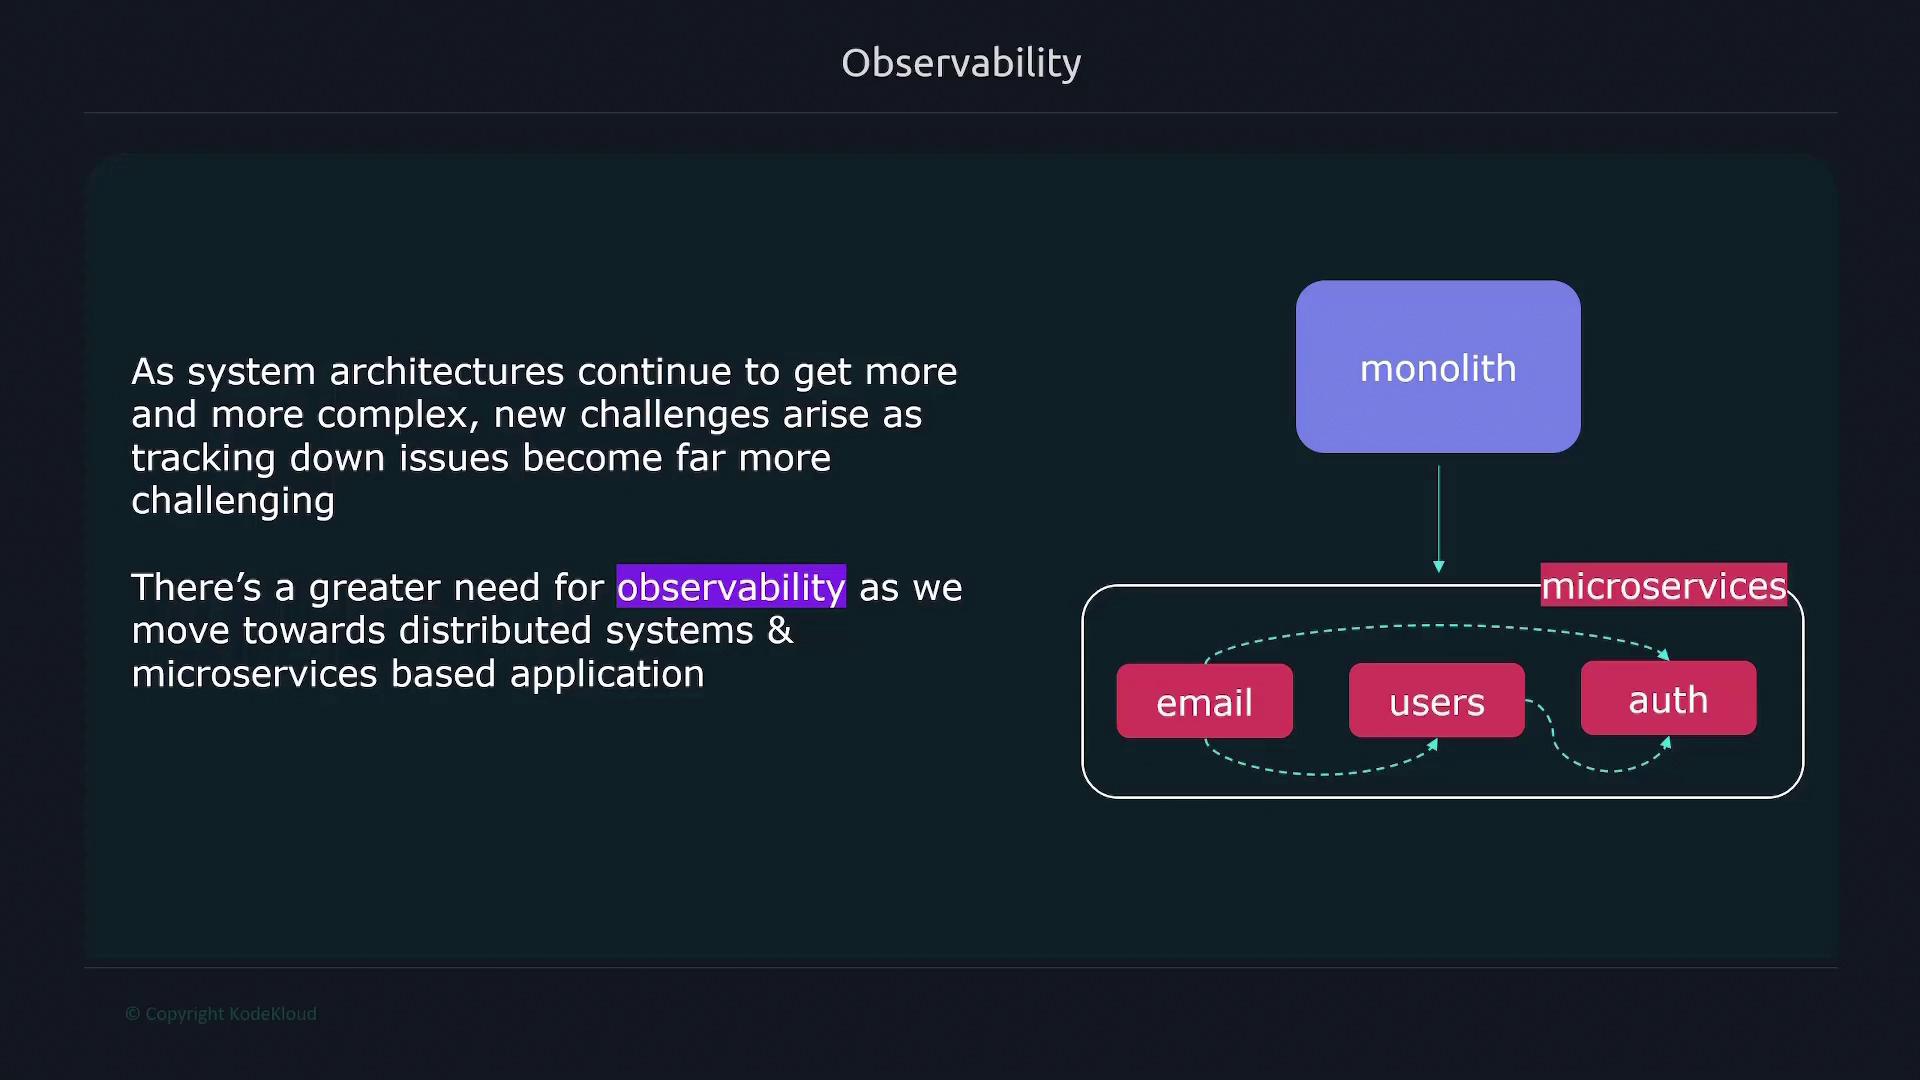
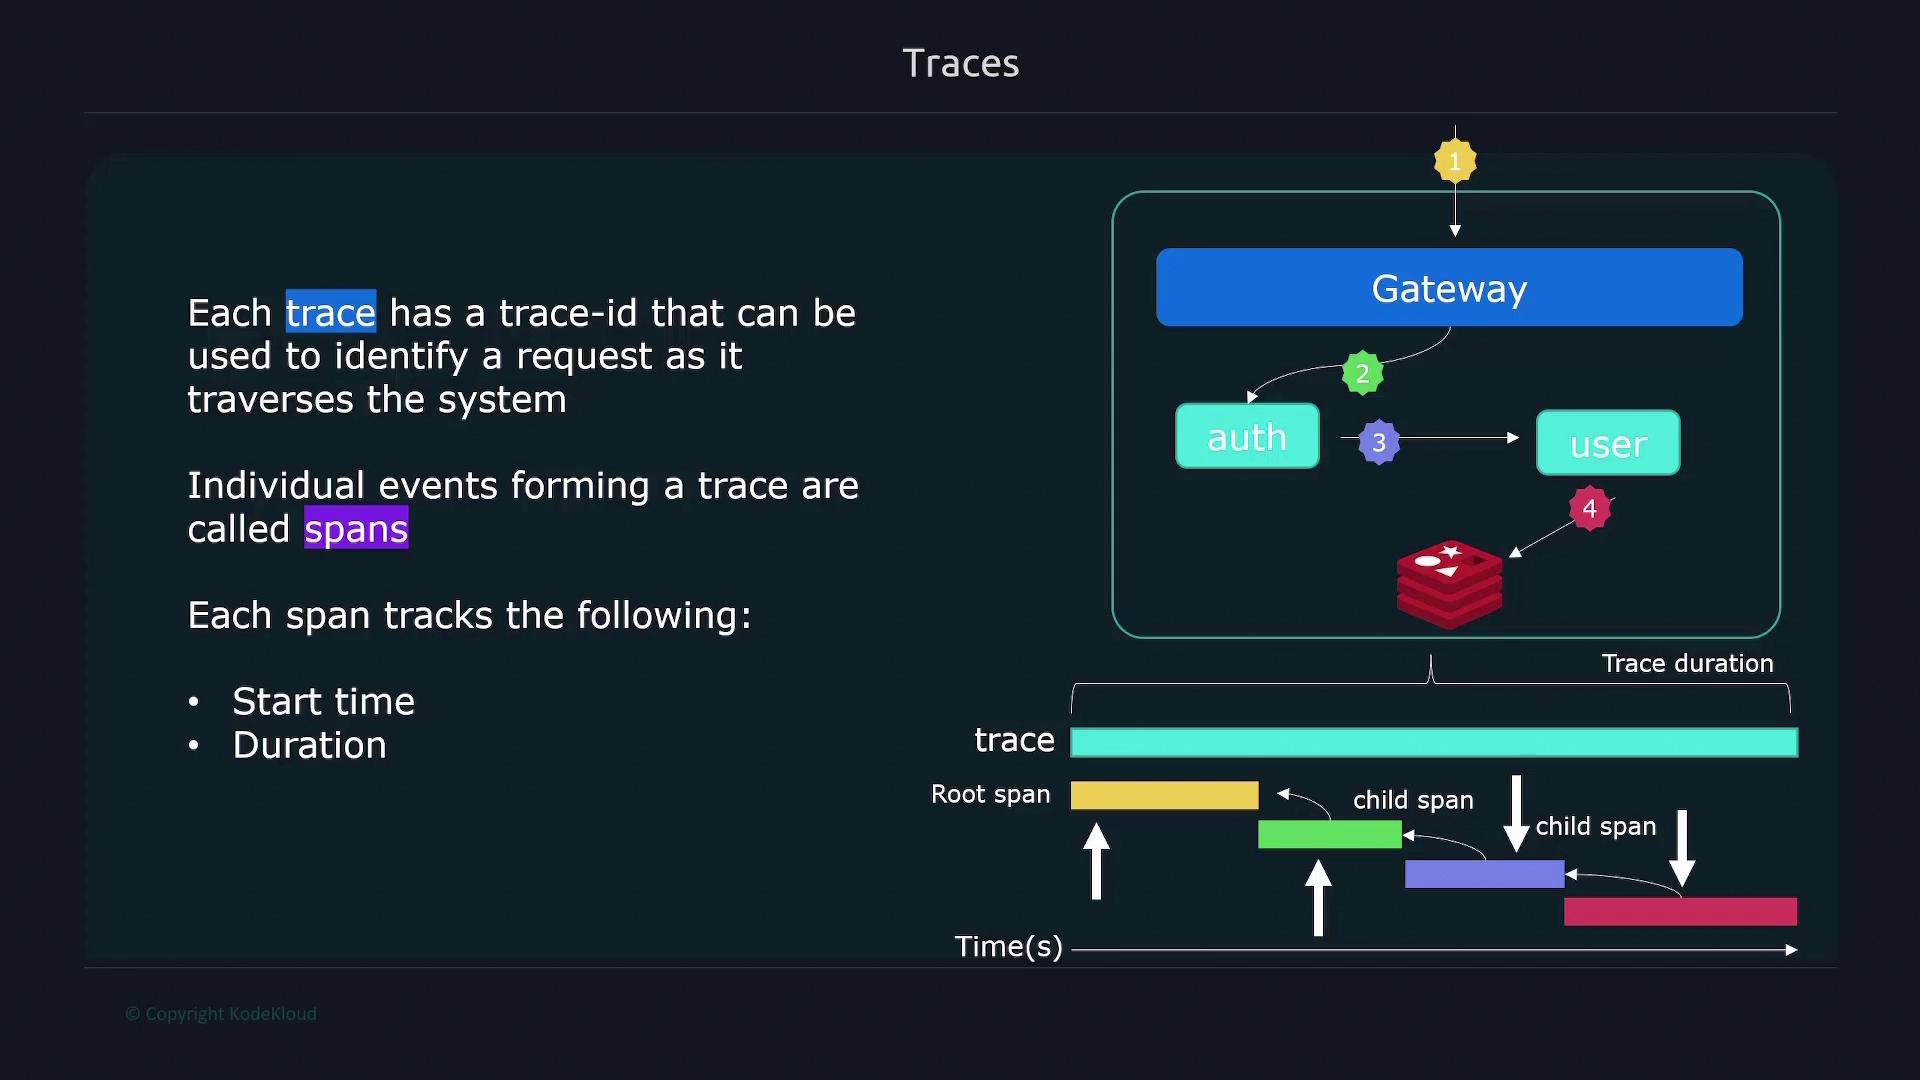
Tracing enables you to follow individual requests as they pass through various systems and services. Each request is assigned a unique trace ID, which allows you to visualize its journey across the entire application landscape. Within each trace, individual events—called spans—represent interactions at different interfaces or services. Each span records details such as start time, duration, and a parent ID that ties it back to the originating component.

For example, a request might generate:

  • A span at the gateway.
  • A span in the application layer.
  • Additional spans when interacting with user services or databases.

These spans combine to form a complete trace of the request, providing a granular view of the interactions that occurred.

The image explains traces in a system, showing trace IDs, spans, and their tracking of start time and duration, with a diagram illustrating a gateway process.


Metrics

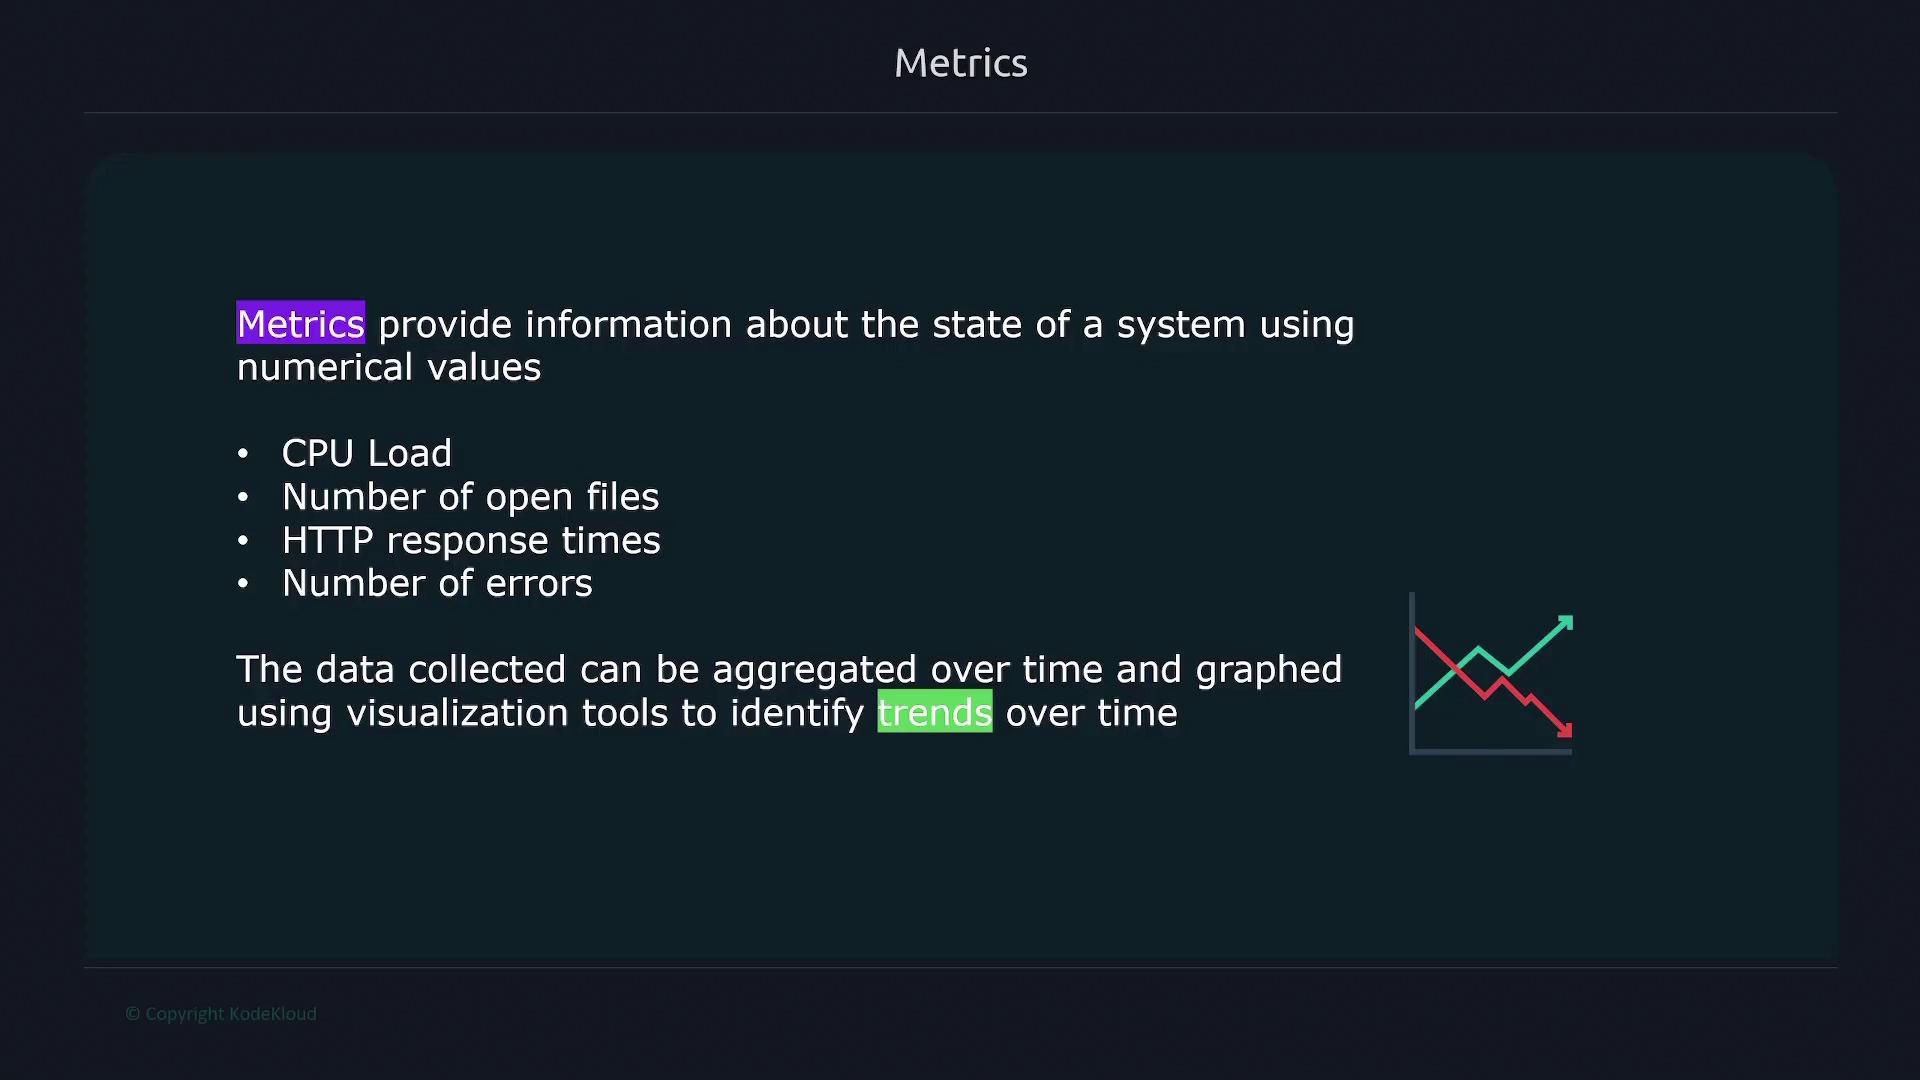
Metrics offer quantifiable measurements that reflect the state of a system. Unlike logs, which capture textual data, metrics deliver numerical data such as CPU load, the number of open files, HTTP response times, and error counts. These measurements can be aggregated over time and visualized, making it easier to detect trends and identify anomalies.

A typical metric entry might include:

  • A metric name that describes the measurement.
  • A value representing the current or recent reading.
  • A timestamp indicating when the metric was recorded.
  • Optional dimensions to provide additional context.

For example:

node_filesystem_avail_bytes{fstype="vfat", mountpoint="/home"} 5000
4:30AM 12/1/22

The image explains metrics, listing CPU load, open files, HTTP response times, and errors, and highlights data aggregation and trend visualization.


Note

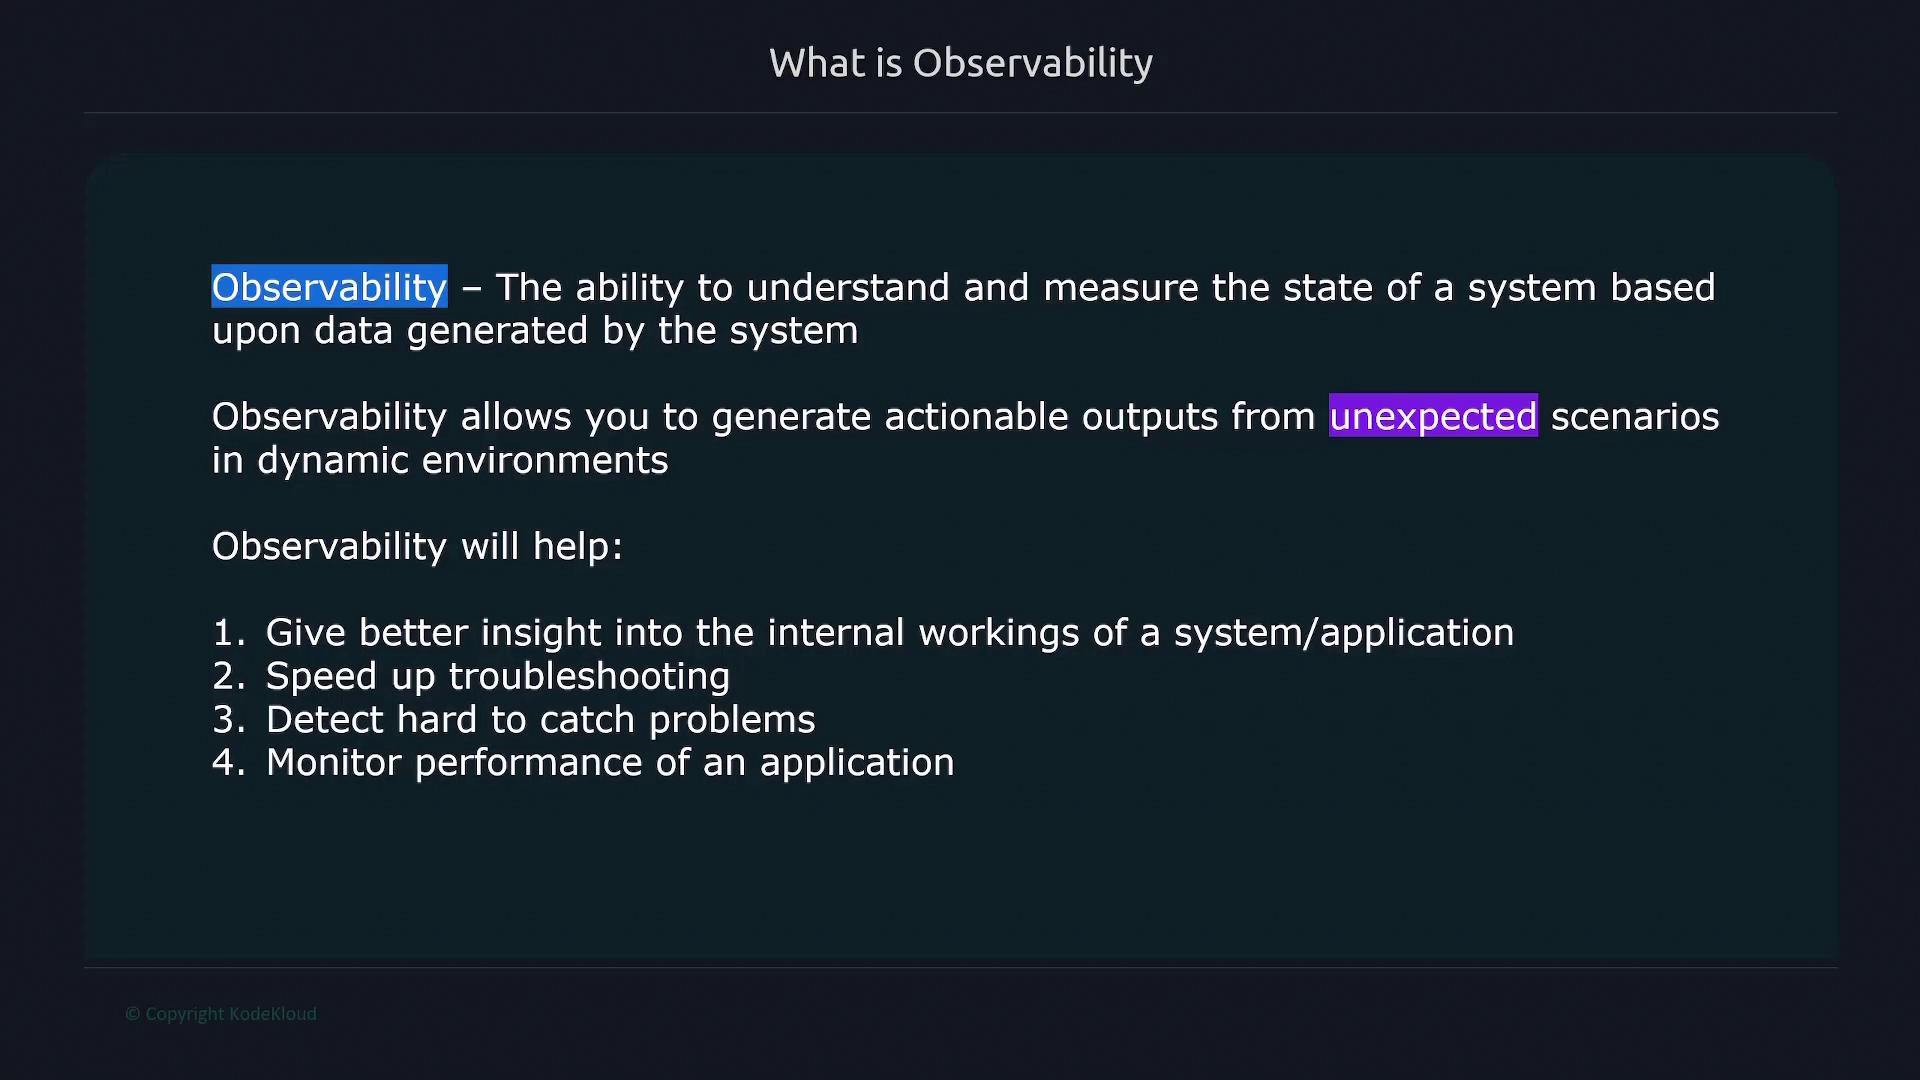
Observability is not limited to simply capturing data; its real power lies in correlating logs, traces, and metrics to gain a comprehensive view of your system's performance and health.

Observability with Prometheus

This article focuses on Prometheus, a leading monitoring solution designed for aggregating metrics. It’s important to note, however, that Prometheus is specialized for handling metrics only—it does not capture logs or traces. To achieve a full observability solution, consider integrating additional tools for log management and distributed tracing.

By leveraging the three pillars of observability—logging, tracing, and metrics—you can develop a complete and robust system monitoring strategy. This holistic approach enables rapid issue identification, deeper understanding of underlying causes, and the maintenance of a resilient system.


For more detailed insights and guides on observability, consider exploring additional resources:

Watch Video

Watch video content

Previous
Open Standards