> ## Documentation Index
> Fetch the complete documentation index at: https://notes.kodekloud.com/llms.txt
> Use this file to discover all available pages before exploring further.
# Prometheus Metrics
> This guide explains the components and structure of Prometheus metrics, including metric names, labels, values, and their role in monitoring.
This guide explains how Prometheus metrics work by breaking down their key components and structure. Prometheus metrics are composed of three fundamental parts:
1. A descriptive metric name.
2. One or more labels (key-value pairs) that add valuable context.
3. A numerical value representing the measured quantity at a specific time.
***
## Metric Structure
Consider the example metric generated by the node exporter:
```plaintext theme={null}
node_cpu_seconds_total{cpu="0",mode="idle"} 258277.86
```
In this example:
* The metric name, `node_cpu_seconds_total`, represents the total CPU seconds.
* The labels `cpu` and `mode` specify which CPU (CPU 0) and its state (idle).
* The numerical value `258277.86` indicates the total seconds that CPU 0 has been idle.
For multi-CPU systems, you will observe similar metrics with different label values, such as:
```plaintext theme={null}
node_cpu_seconds_total{cpu="0",mode="idle"} 258277.86
node_cpu_seconds_total{cpu="0",mode="idle"} 258244.86
node_cpu_seconds_total{cpu="1",mode="idle"} 427262.54
node_cpu_seconds_total{cpu="2",mode="idle"} 283288.12
node_cpu_seconds_total{cpu="3",mode="idle"} 258202.33
```
Each line records the CPU time for a specific CPU and state, allowing deeper insights through label-based filtering.
***
## Timestamps and Data Scraping
Every time Prometheus scrapes a target, it collects not only the metric value but also the timestamp—a Unix timestamp that records the number of seconds since January 1, 1970, UTC. This ensures that all measurements are accurately recorded in time.
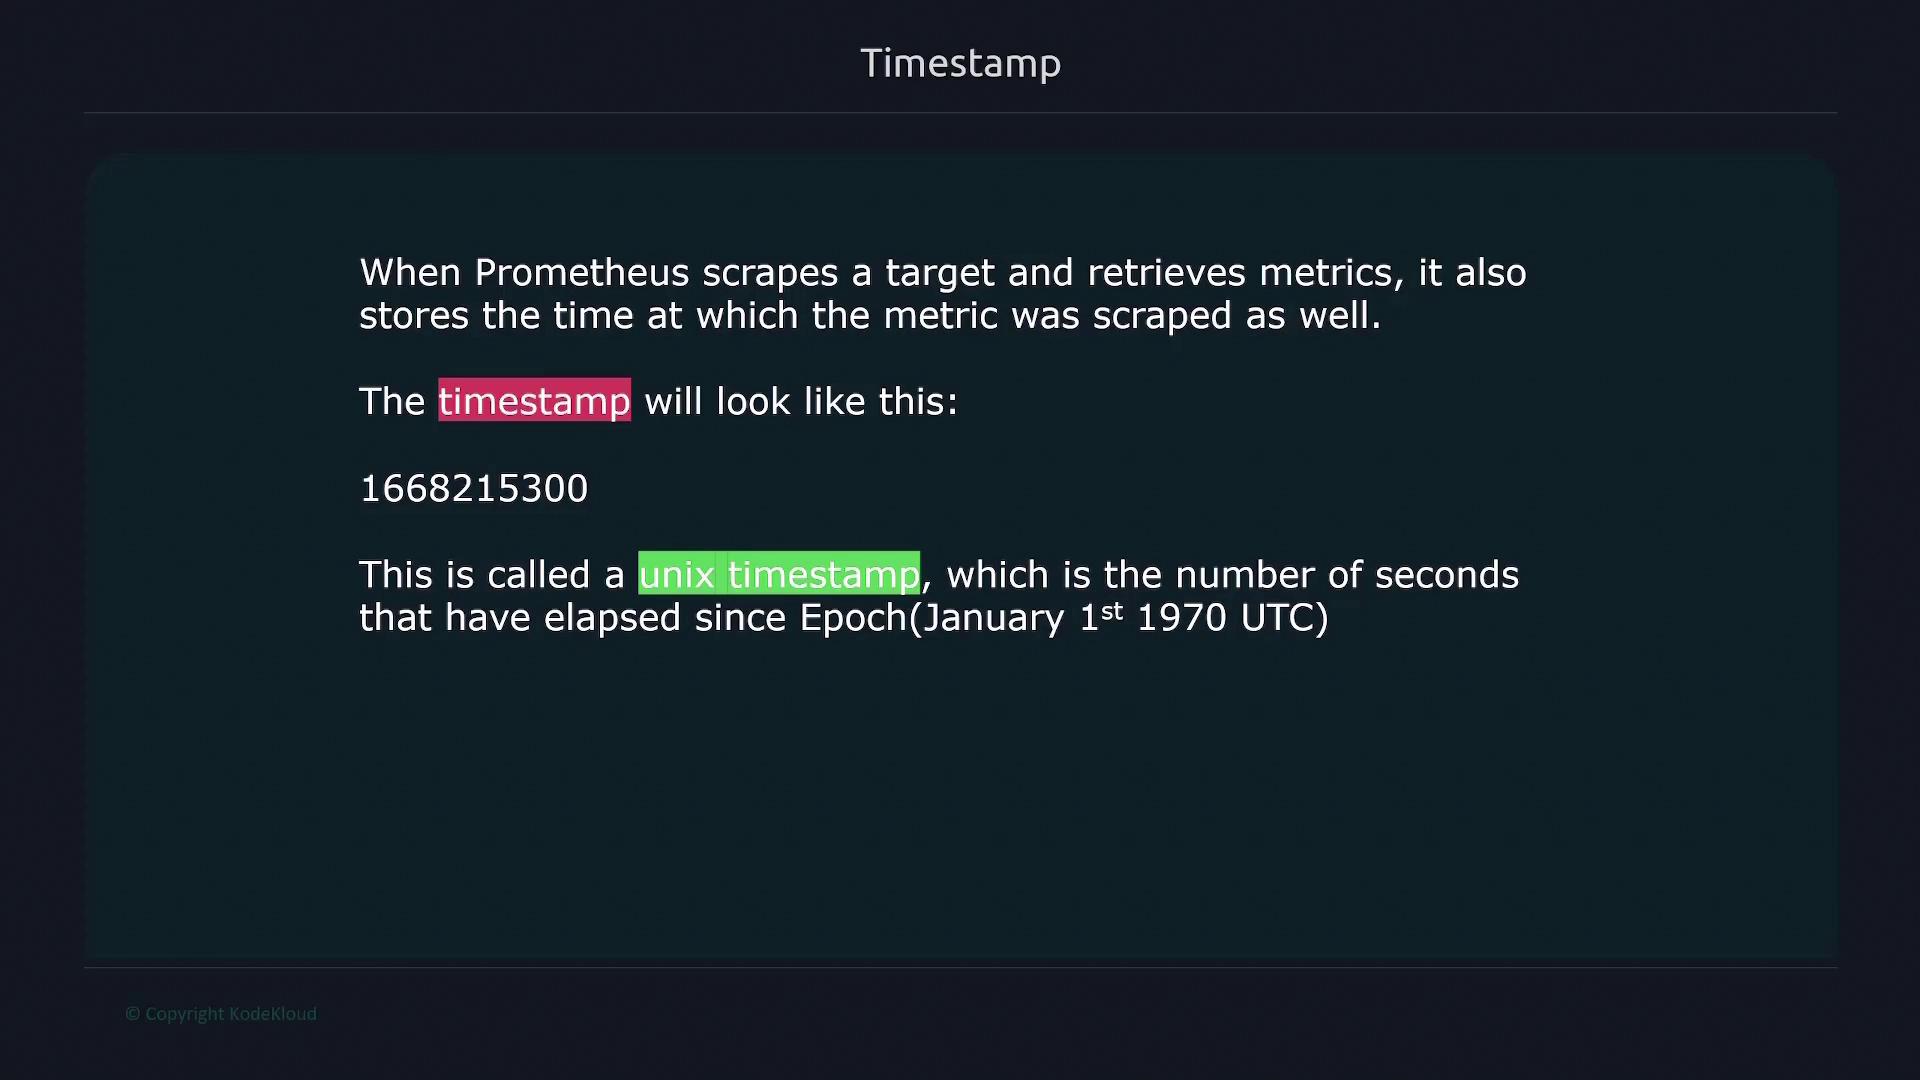
You can convert Unix timestamps to human-readable formats using various online tools, although most modern dashboarding tools perform this conversion automatically based on your local timezone.
***
## Time Series
In Prometheus, a time series is a sequence of timestamped data points that share the same metric name and labels. For example, consider these metrics collected from two different servers:
```plaintext theme={null}
node_filesystem_files{device="sda2", instance="server1"}
node_filesystem_files{device="sda3", instance="server1"}
node_filesystem_files{device="sda2", instance="server2"}
node_filesystem_files{device="sda3", instance="server2"}
node_cpu_seconds_total{cpu="0", instance="server1"}
node_cpu_seconds_total{cpu="1", instance="server1"}
node_cpu_seconds_total{cpu="0", instance="server2"}
node_cpu_seconds_total{cpu="1", instance="server2"}
```
* Two distinct metrics are present: `node_filesystem_files` and `node_cpu_seconds_total`.
* With different combinations of labels (such as `device`, `cpu`, and `instance`), there are eight unique time series.
Each scrape by Prometheus—typically at intervals of 15 or 30 seconds—appends new timestamped entries to the respective time series.
***
## Metric Attributes
Every Prometheus metric has two key attributes:
* **Help attribute:** Provides a natural language description of what the metric measures.
* **Type attribute:** Specifies the metric type, such as counter, gauge, histogram, or summary.
For example:
```plaintext theme={null}
# HELP node_disk_discard_time_seconds_total This is the total number of seconds spent by all discards.
# TYPE node_disk_discard_time_seconds_total counter
node_disk_discard_time_seconds_total{device="sda"} 0
node_disk_discard_time_seconds_total{device="sr0"} 0
```
***
### Metric Types
1. **Counter:**\
Counters are used to count events with values that only increase. They are typically used for metrics like total requests, error counts, or job executions.
2. **Gauge:**\
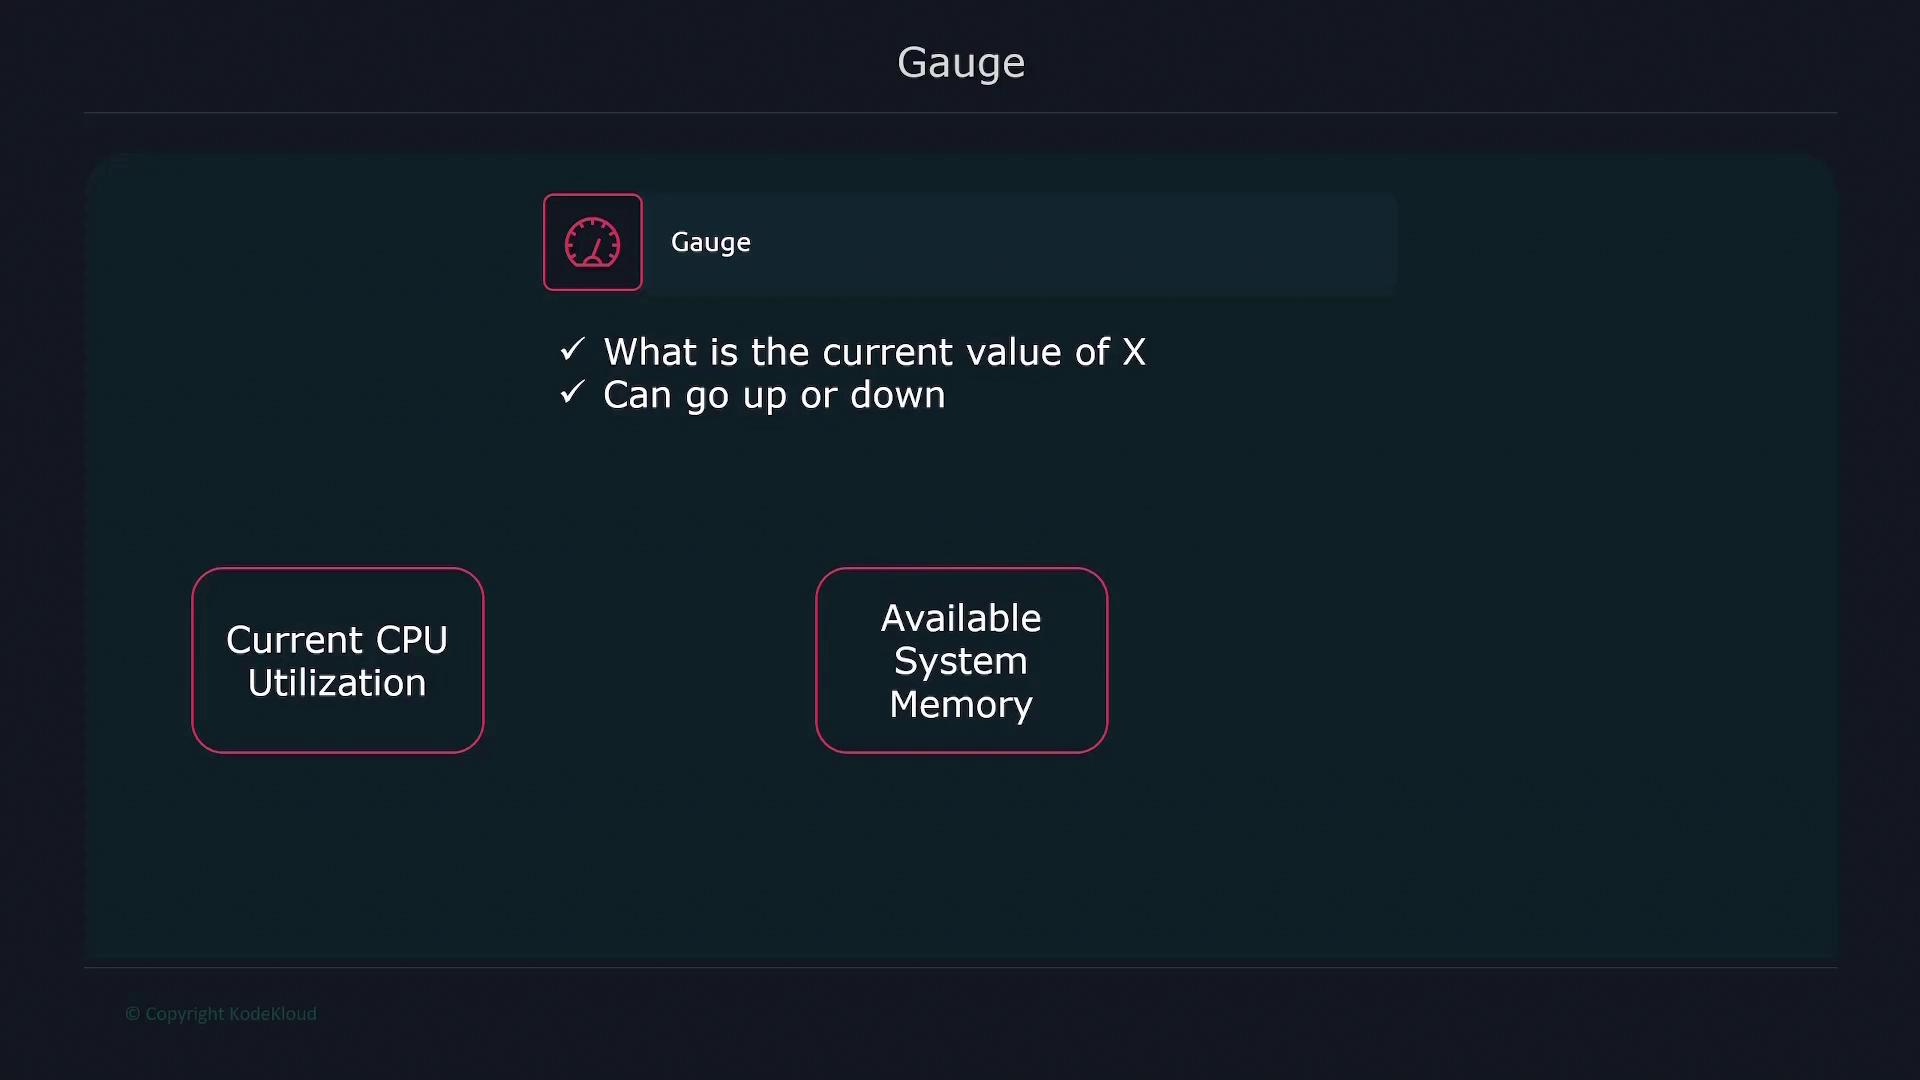
Gauges measure values that can increase or decrease, such as current CPU utilization or memory usage.
3. **Histogram:**\
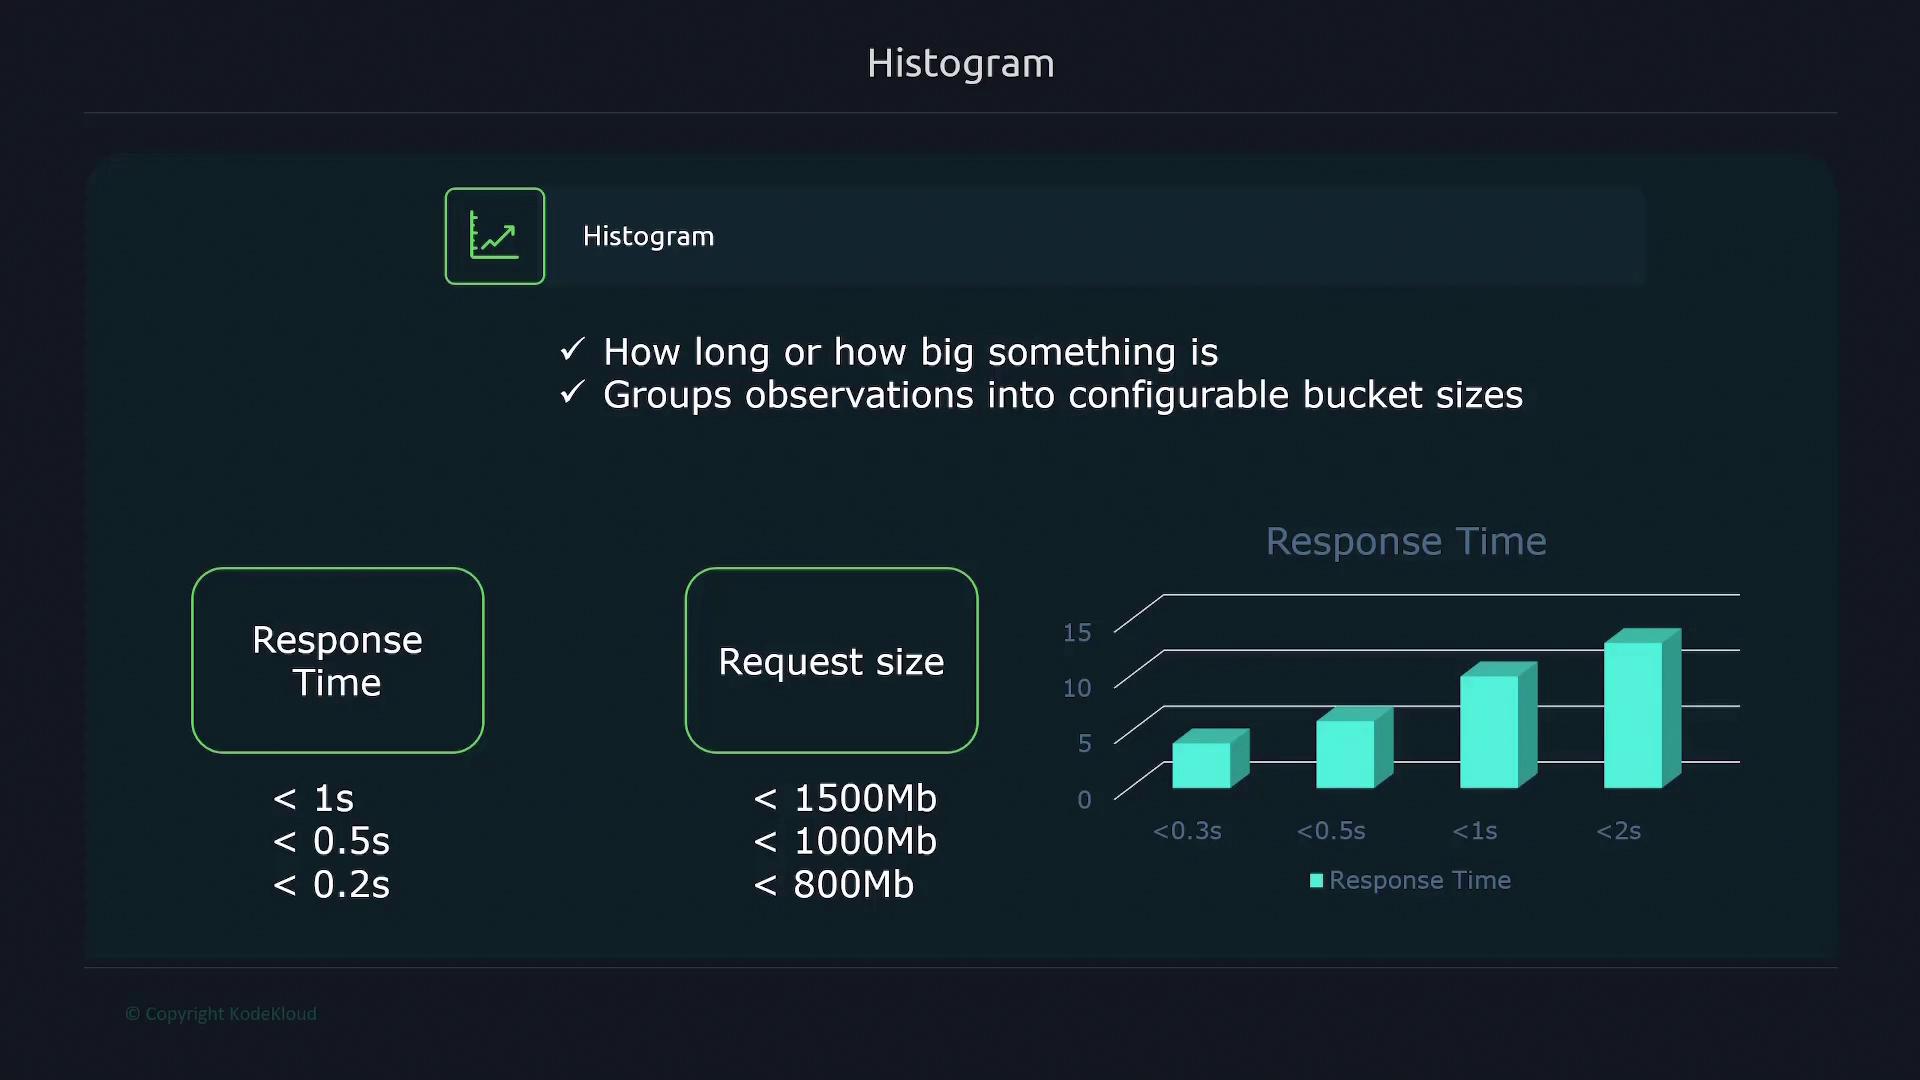
Histograms record the distribution of values, such as response times or request sizes, by sorting observations into configurable buckets. For example, you might define buckets for requests that take 0.2, 0.5, or 1 second to complete.
4. **Summary:**\
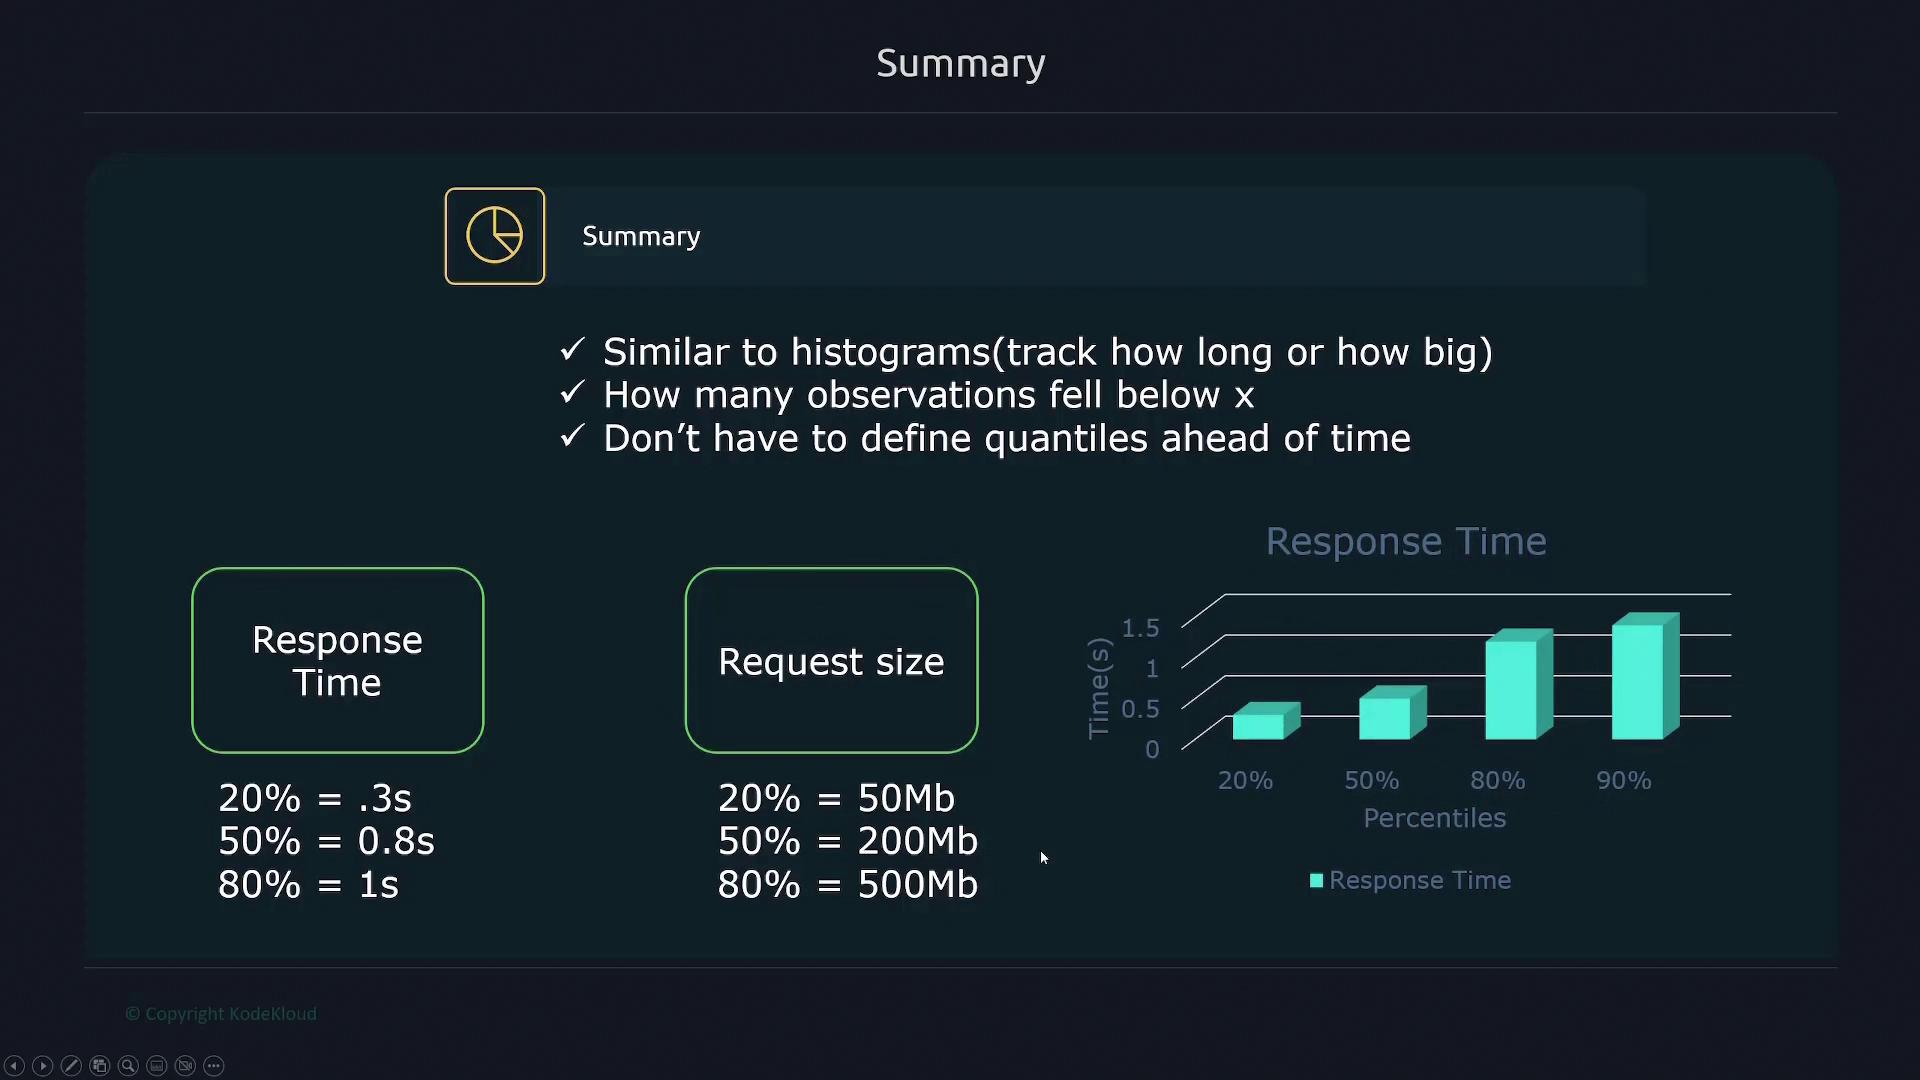
Summaries provide quantile information (such as percentiles) for durations or sizes, offering an alternative method to histograms for understanding data distributions. For instance, a summary might show that 20% of requests completed in under 0.3 seconds, 50% under 0.8 seconds, and 80% under one second.
***
## Metric Naming Conventions
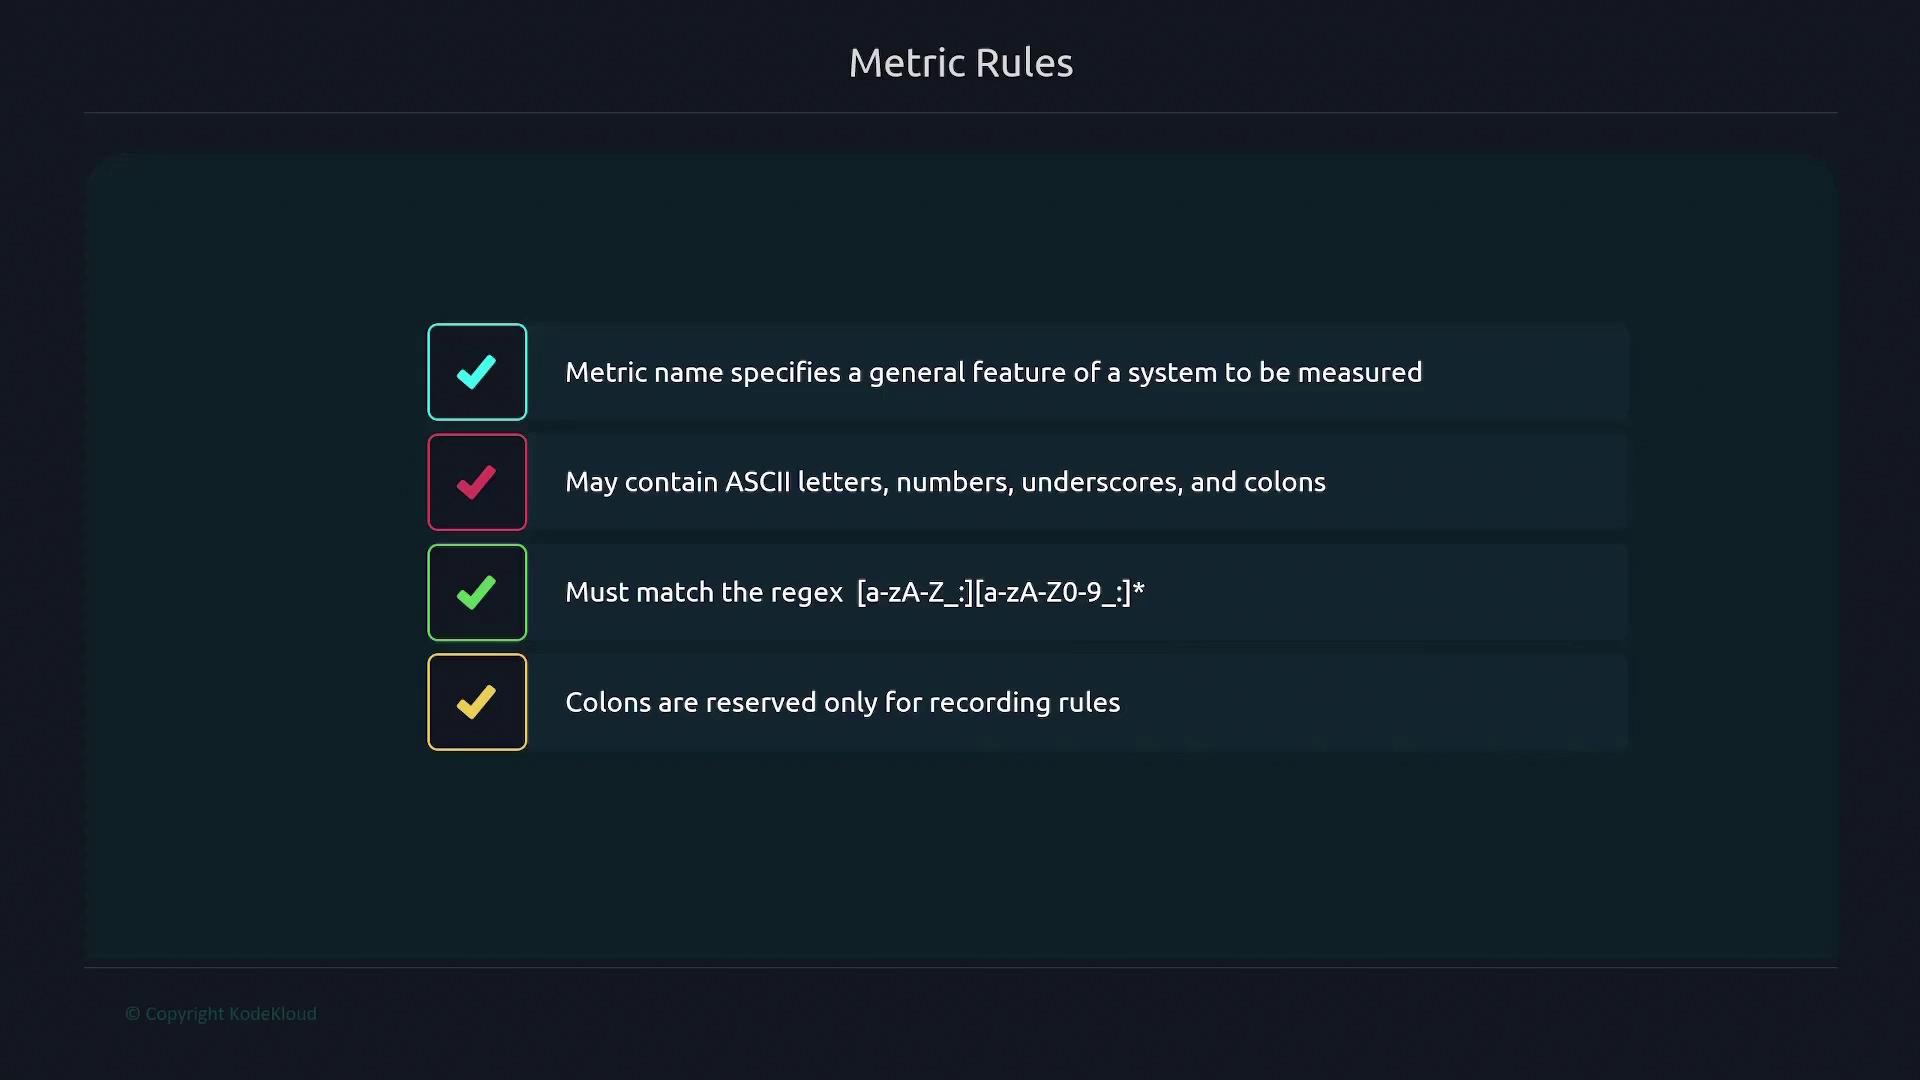
Metric names should clearly indicate the system feature being measured. Valid characters include ASCII letters, numbers, underscores, and colons. However, avoid using colons in metric names since they are reserved for recording rules in Prometheus.
***
## Labels in Depth
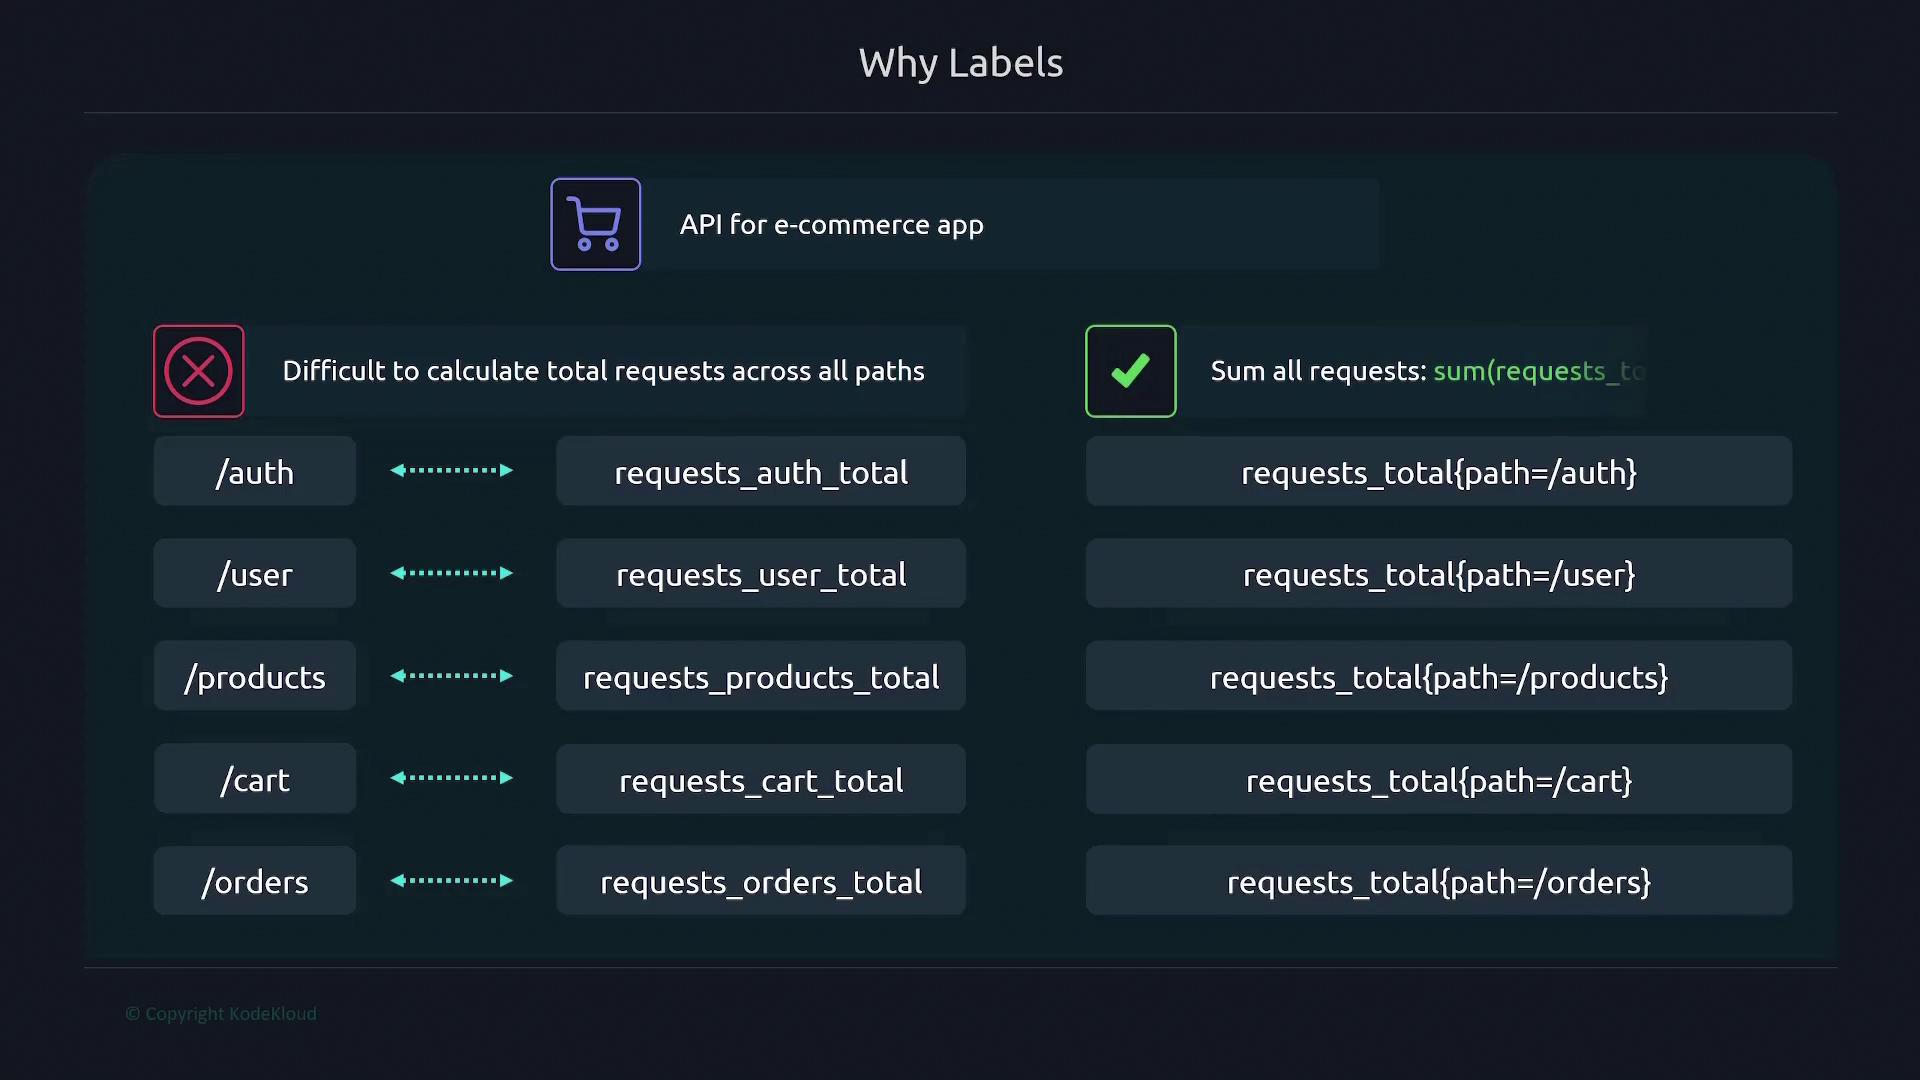
Labels are key-value pairs that add dimensions to your metrics. Instead of creating separate metrics for each variant (for example, different API endpoints), you can use a single metric differentiated by labels.
Consider API request metrics:
* Without labels:
* `requests_auth_total` for the authentication endpoint.
* `requests_user_total` for the user endpoint.
This separation complicates aggregating total requests. Instead, using labels provides a more flexible approach:
* With labels:
* Use a single metric (`requests_total`) with a `path` label, like so:
```plaintext theme={null}
requests_total{path="/auth", method="get"}
```
This approach greatly simplifies queries and allows aggregation functions (like `sum`) to combine values across endpoints. Labels can represent multiple dimensions; for instance, adding an HTTP method label (GET, POST, PATCH, DELETE) further refines the data.
Remember, the metric name is internally treated as a label called `__name__`, and other labels prefixed or suffixed with double underscores are reserved for internal use by Prometheus.
Moreover, every metric automatically includes the `instance` and `job` labels. The `instance` label identifies the target (as defined in your configuration), while the `job` label corresponds to the job name specified in your Prometheus configuration file:
```yaml theme={null}
job_name: "node"
scheme: https
basic_auth:
username: prometheus
password: password
static_configs:
- targets:
- "192.168.1.168:9100"
```
These labels ensure that each metric can be traced back to its source, facilitating effective monitoring and troubleshooting.
![The image explains labels as key-value pairs for metrics, allowing criteria-based splitting, multiple labels, and ASCII characters, matching the regex \[a-zA-Z0-9\_\]\*.](https://kodekloud.com/kk-media/image/upload/v1752880540/notes-assets/images/Kubernetes-and-Cloud-Native-Associate-KCNA-Prometheus-Metrics/frame_660.jpg)
***
This article has provided a comprehensive overview of Prometheus metrics. You now have a solid foundation in understanding metric structure, timestamp usage during data scraping, the nature of time series, various metric types, naming conventions, and the crucial role that labels play in monitoring. With this knowledge, you are better equipped to model and query your monitoring data effectively in Prometheus.