Enabling Docker Engine Metrics
To collect metrics from your Docker engine, perform the following steps on your Docker host:-
Open or create the
/etc/docker/daemon.jsonfile and add the configuration below. This configuration exposes the Docker metrics endpoint and enables experimental features. -
Restart the Docker service to apply the changes:
-
Verify that the Docker metrics endpoint is accessible by running:
Ensure that the experimental flag is enabled to properly expose Docker engine metrics.
12.1.13.4 with the actual IP address of your Docker host.
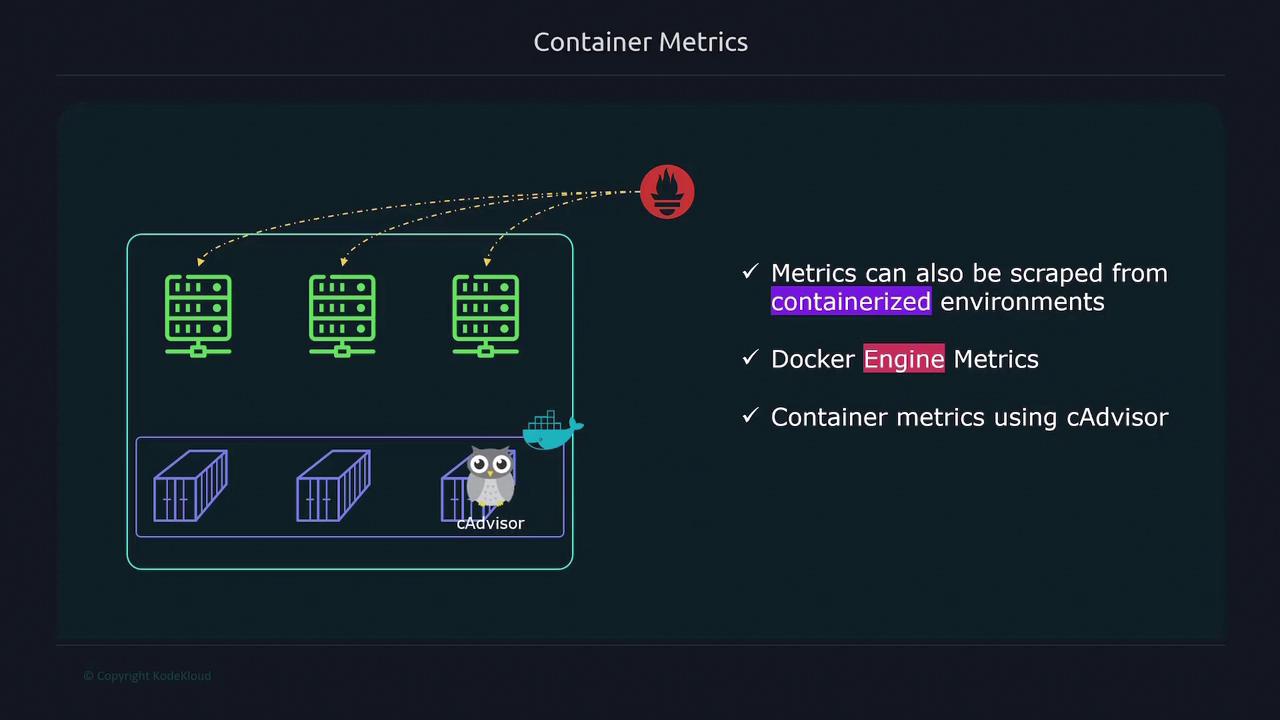
Monitoring Container Metrics with cAdvisor
cAdvisor is a powerful tool for collecting container-specific metrics, including CPU usage, memory consumption, process counts, and uptime. To deploy cAdvisor, follow these steps:-
Create a Docker Compose file (e.g.,
docker-compose.yml) with the content below. This configuration is based on the official cAdvisor documentation: -
Start the cAdvisor service using Docker Compose:
-
Verify that cAdvisor is collecting metrics by accessing its endpoint:
12.1.13.4 with the IP address where cAdvisor is running.
Docker vs. cAdvisor Metrics
Understanding the difference between Docker engine metrics and cAdvisor metrics is important for effective monitoring:-
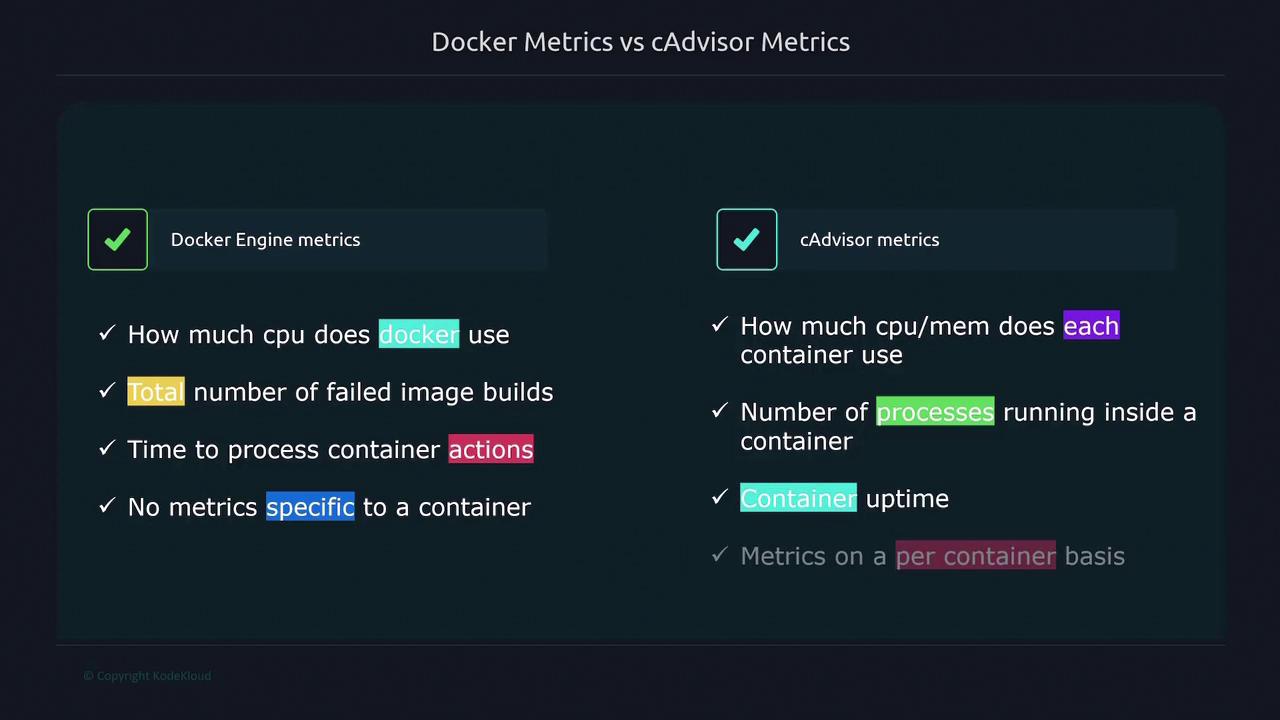
Docker Engine Metrics:
These metrics provide information about the overall Docker engine performance, such as:- Overall CPU usage of the Docker engine.
- Counts of failed image builds.
- Time taken to process container actions.
They are ideal for monitoring the overall health of the Docker engine but do not offer detailed per-container insights.
-
cAdvisor Metrics:
cAdvisor provides granular metrics for each container including:- CPU and memory usage.
- Number of processes running inside a container.
- Container uptime.
Use cAdvisor metrics when you require detailed, container-specific performance data.
Use Docker engine metrics for a holistic view of your host’s performance and cAdvisor for in-depth analysis of each container. Adjust your Prometheus configuration accordingly to ensure efficient monitoring.