> ## Documentation Index
> Fetch the complete documentation index at: https://notes.kodekloud.com/llms.txt
> Use this file to discover all available pages before exploring further.
# Working with Hardware
> This article explores how Linux detects and manages hardware devices, detailing command-line tools for listing devices and providing hardware information.
In this lesson, we explore how Linux detects and manages hardware devices connected to a system. You will learn about various command-line tools that list devices and provide detailed hardware information using the example of a USB disk. When a USB disk is attached, the corresponding device driver in the Linux kernel identifies the state change and generates a uEvent. This event is forwarded to the user-space device manager daemon, uDev, which then dynamically creates a device node under the /dev filesystem for the new drive.
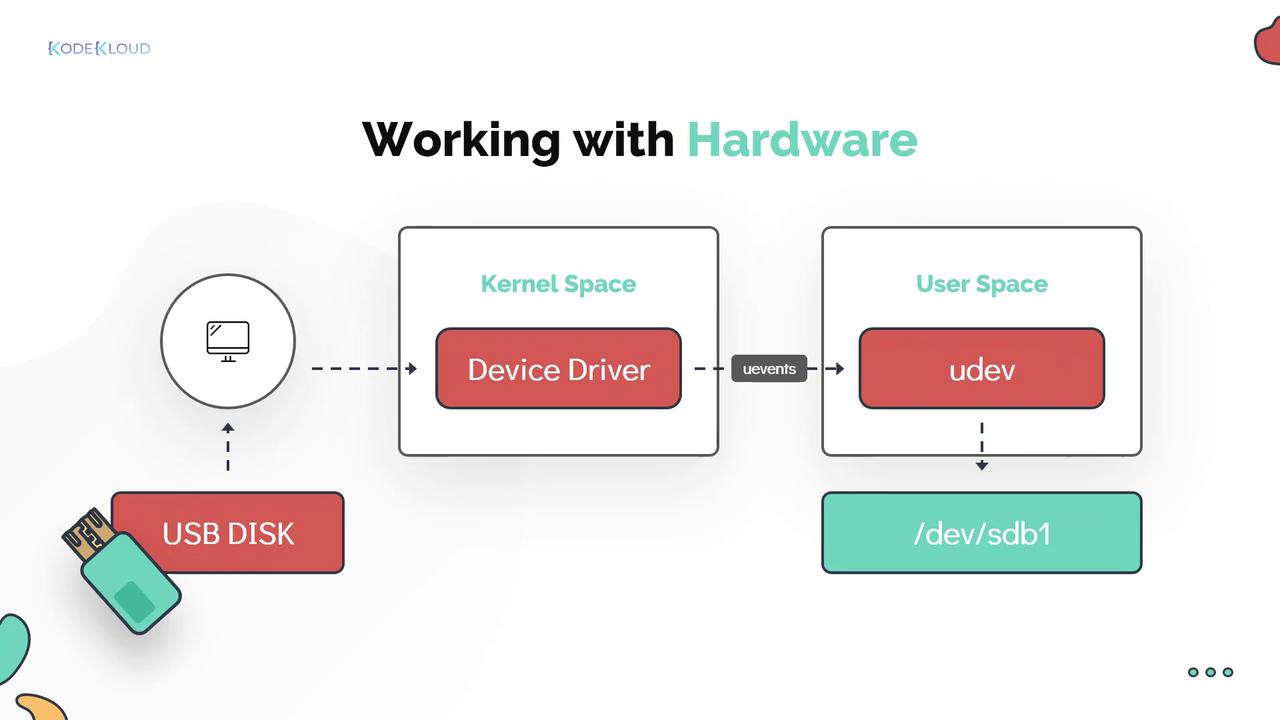
Once this process completes, the new disk appears in the /dev filesystem.
Linux utilizes a series of powerful command-line tools to provide visibility into kernel messages, device events, and hardware configurations. These tools are essential for troubleshooting and system administration.
## Viewing Kernel and Device Events
The `dmesg` tool displays messages from the kernel's ring buffer, including extensive boot-time logs that reveal how hardware was detected and configured. You can pipe the output to utilities like `less` or filter it with `grep` to search for specific keywords.
The `udevadm` utility is used to query and monitor device events related to uDev. For example, the following command queries the uDev database and returns the device path associated with a hard disk:
```bash theme={null}
[~]$ udevadm info --query=path --name=/dev/sda5
/devices/pci0000:00/0000:00:17.0/ata3/host2/target2:0:0/2:0:0:0/block/sda/sda5
```
Additionally, you can monitor kernel uEvents in real time with:
```bash theme={null}
[~]$ udevadm monitor
monitor will print the received events for:
UDEV - the event which udev sends out after rule processing
KERNEL - the kernel uevent
```
Use `udevadm monitor` to track details of newly attached or removed devices—for instance, when unplugging a USB mouse.
## Listing PCI Devices
The `lspci` command lists all PCI devices configured in your system, such as Ethernet cards, RAID controllers, video cards, and wireless adapters. PCI stands for Peripheral Component Interconnect, representing devices directly attached to the motherboard.
Below is an example output from the `lspci` command:
```bash theme={null}
[~]$ lspci
00:00.0 Host bridge: Intel Corporation Device 3e34 (rev 0c)
00:02.0 VGA compatible controller: Intel Corporation Device 3ea0 (rev 02)
00:08.0 System peripheral: Intel Corporation Xeon E3-1200 v5/v6 / E3-1500 v5 / 6th/7th Gen Core Processor Gaussian Mixture Model
00:12.0 Signal processing controller: Intel Corporation Device 9df9 (rev 30)
00:14.0 USB controller: Intel Corporation Device 9ded (rev 30)
00:14.2 RAM memory: Intel Corporation Device 9def (rev 30)
00:14.3 Network controller: Intel Corporation Device 9df0 (rev 30)
00:15.0 Serial bus controller [0c80]: Intel Corporation Device 9de8 (rev 30)
00:15.1 Serial bus controller [0c80]: Intel Corporation Device 9de9 (rev 30)
00:16.0 Communication controller: Intel Corporation Device 9de0 (rev 30)
00:17.0 RAID bus controller: Intel Corporation 82801 Mobile SATA Controller [RAID mode] (rev 30)
00:1c.0 PCI bridge: Intel Corporation Device 9db0 (rev f0)
00:1f.0 ISA bridge: Intel Corporation Device 9dab (rev 30)
00:1f.3 Audio device: Intel Corporation Device 9dc8 (rev 30)
00:1f.5 Serial bus controller [0c80]: Intel Corporation Device 9dad (rev 30)
01:00.0 Unassigned class [ff00]: Realtek Semiconductor Co., Ltd. RTL8411B PCI Express Card Reader (rev 01)
01:00.1 Ethernet controller: Realtek Semiconductor Co., Ltd. RTL8111/8168/8411 PCI Express Gigabit Ethernet Controller (rev 12)
```
## Viewing Block Devices
The `lsblk` command provides detailed information about block devices present on your system. It displays the physical disk (e.g., sda) along with its partitions (e.g., sda1 to sda5). The term "disk" refers to the entire physical disk, while each "partition" is a section of that disk. Devices are also linked with major and minor numbers—where the major number signifies the device driver type (for example, the number 8 indicates a block disk device) and the minor number distinguishes between individual devices handled by the same driver.
Example output from the `lsblk` command:
```bash theme={null}
[~]$ lsblk
NAME MAJ:MIN RM SIZE RO TYPE MOUNTPOINT
sda 8:0 0 119.2G 0 disk
├─sda1 8:1 0 100M 0 part /boot/efi
├─sda2 8:2 0 16M 0 part
├─sda3 8:3 0 71.5G 0 part
├─sda4 8:4 0 1G 0 part
└─sda5 8:5 0 46.6G 0 part /
```
Another example showing the associated major numbers:
```bash theme={null}
[~]$ lsblk
NAME MAJ:MIN RM SIZE RO TYPE MOUNTPOINT
sda 8:0 0 119.2G 0 disk
├─sda1 8:1 0 100M 0 part /boot/efi
├─sda2 8:2 0 16M 0 part
├─sda3 8:3 0 71.5G 0 part
├─sda4 8:4 0 1G 0 part
└─sda5 8:5 0 46.6G 0 part /
```
## Displaying CPU Information
The `lscpu` command offers detailed insights into the CPU architecture, such as the number of cores, threads per core, cache sizes, and more.
For instance, the output below illustrates a 64-bit processor with one physical CPU socket, four cores per socket, and two threads per core—resulting in a total of 8 virtual CPUs:
```bash theme={null}
[~]$ lscpu
Architecture: x86_64
CPU op-mode(s): 32-bit, 64-bit
Byte Order: Little Endian
CPU(s): 8
On-line CPU(s) list: 0-7
Thread(s) per core: 2
Core(s) per socket: 4
Socket(s): 1
NUMA node(s): 1
Vendor ID: GenuineIntel
CPU family: 6
Model: 142
Model name: Intel(R) Core(TM) i5-8265U CPU @ 1.60GHz
Stepping: 12
CPU MHz: 700.060
CPU max MHz: 3900.0000
CPU min MHz: 400.0000
BogoMIPS: 3600.00
Virtualization: VT-x
L1d cache: 32K
L1i cache: 32K
L2 cache: 256K
L3 cache: 6144K
NUMA node0 CPU(s): 0-7
```
Key points from the output include:
* The CPU architecture is 64-bit.
* There is 1 socket with 4 cores each and 2 threads per core, totaling 8 virtual CPUs.
## Displaying Memory Information
To retrieve memory configuration details, use the `lsmem` command. When combined with the `--summary` flag, it delivers a brief overview of the system's memory:
```bash theme={null}
[~]$ lsmem --summary
Memory block size: 128M
Total online memory: 8G
Total offline memory: 0B
```
For a more detailed view, run `lsmem` without any flags.
Alternatively, the `free` command shows memory usage statistics, including total, used, and free memory. The `-m` flag displays the information in megabytes:
```bash theme={null}
[~]$ free -m
total used free shared buff/cache available
Mem: 7824 2518 541 525 4764 4481
Swap: 2047 0 2047
```
You can also use `-k` for kilobytes and `-g` for gigabytes as needed.
## Extracting Detailed Hardware Information
The `lshw` command extracts comprehensive details about the system's hardware configuration. This includes memory setup, firmware version, motherboard information, CPU, cache settings, and bus speeds. Note that running `lshw` without root privileges may generate warnings about incomplete or inaccurate output.
For example, if Bob runs `lshw` without root, he might see a warning. Dave explains that certain commands require root privileges for complete output. To run `lshw` with elevated privileges, use `sudo`:
```bash theme={null}
[~]$ sudo lshw
[sudo] password for bob:
description: Notebook
product: Aspire A515-52 (0000000000000000)
vendor: Acer
version: V1.12
serial: NXH89AA0026262680A13400
width: 64 bits
capabilities: smbios-3.0 dmi-3.0 smp vsyscall32
configuration: chassis=notebook family=Aspire 5 sku=0000000000000000 uuid=D74676912-9EFF-ABCD-8192-085643E554D
*-core
description: Motherboard
product: Raticate_WL
vendor: WL
physical id: 0
version: V1.12
serial: LAC2110069561AB521500
slot: Type2 - Board Chassis Location
*-firmware
description: BIOS
vendor: Insyde Corp.
physical id: 0
version: V1.12
date: 04/26/2019
size: 128KiB
capacity: 15MiB
```
Dave further explains that each user must enter their own password when using `sudo`. After proper authentication, the command output is displayed without warnings. The `sudo` mechanism logs all superuser command activity for auditing purposes. Below is another example of the `sudo lshw` output:
```bash theme={null}
[~]$ sudo lshw
[sudo] password for bob:
description: Notebook
product: Aspire A515-52 (000000000000000000000000)
vendor: Acer
version: V1.12
serial: NXH89AA0026262680A13400
width: 64 bits
capabilities: smbios-3.0 dmi-3.0 smp vsyscall32
configuration: chassis=notebook family=Aspire 5 sku=00000000000000000000 uuid=D74676912-9EFF-ABCD-8192-085643E554D
*-core
description: Motherboard
product: Raticate_WL
vendor: WL
physical id: 0
version: V1.12
serial: LAC12110069651AB521500
slot: Type2 - Board Chassis Location
*-firmware
description: BIOS
vendor: Insyde Corp.
physical id: 0
version: V1.12
date: 04/26/2019
size: 128KiB
capacity: 15MiB
```
## Summary
Linux offers a wide range of tools to monitor and manage hardware devices, system configuration, and resource usage. Understanding these commands and interpreting their outputs is crucial for effective system administration and troubleshooting. Regularly using these tools enhances your ability to manage Linux environments efficiently and securely.
Happy learning!