This article explains how to configure data connections to Microsoft Sentinel using connectors for various data sources.
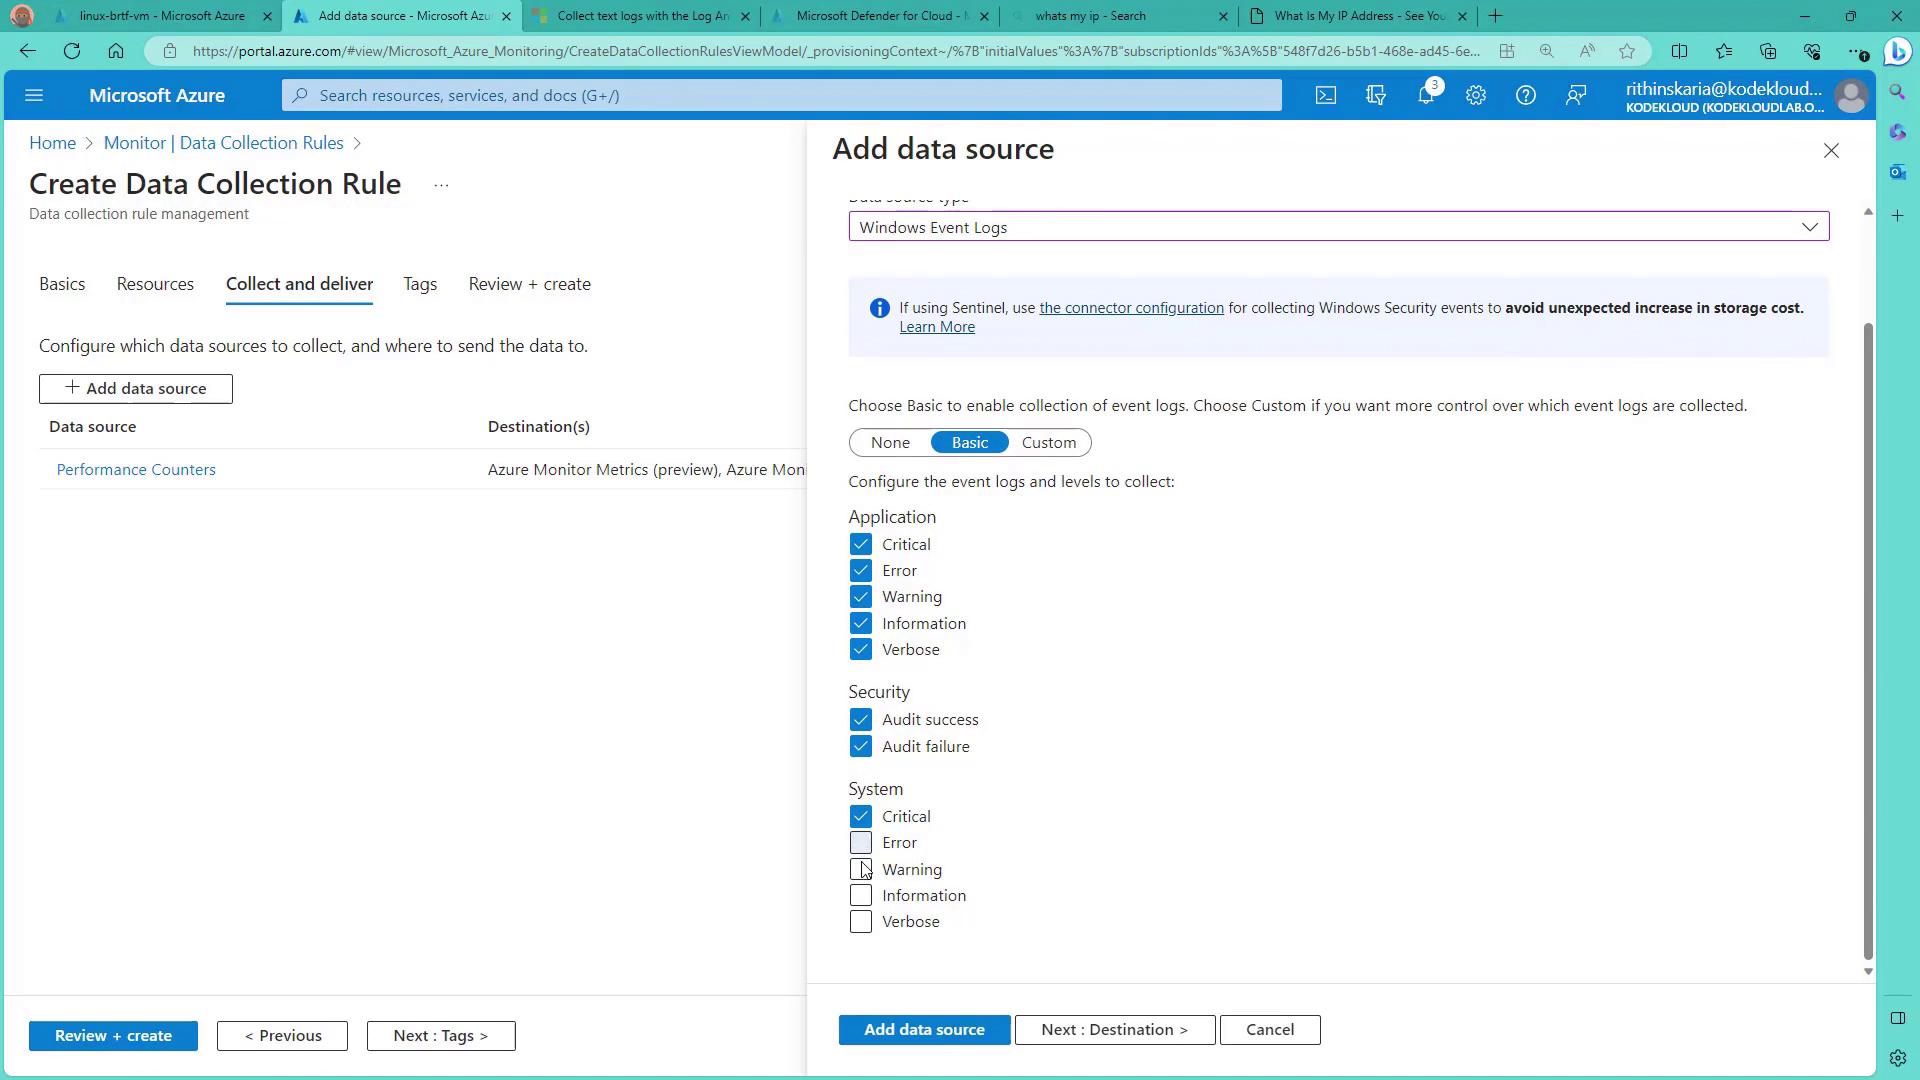
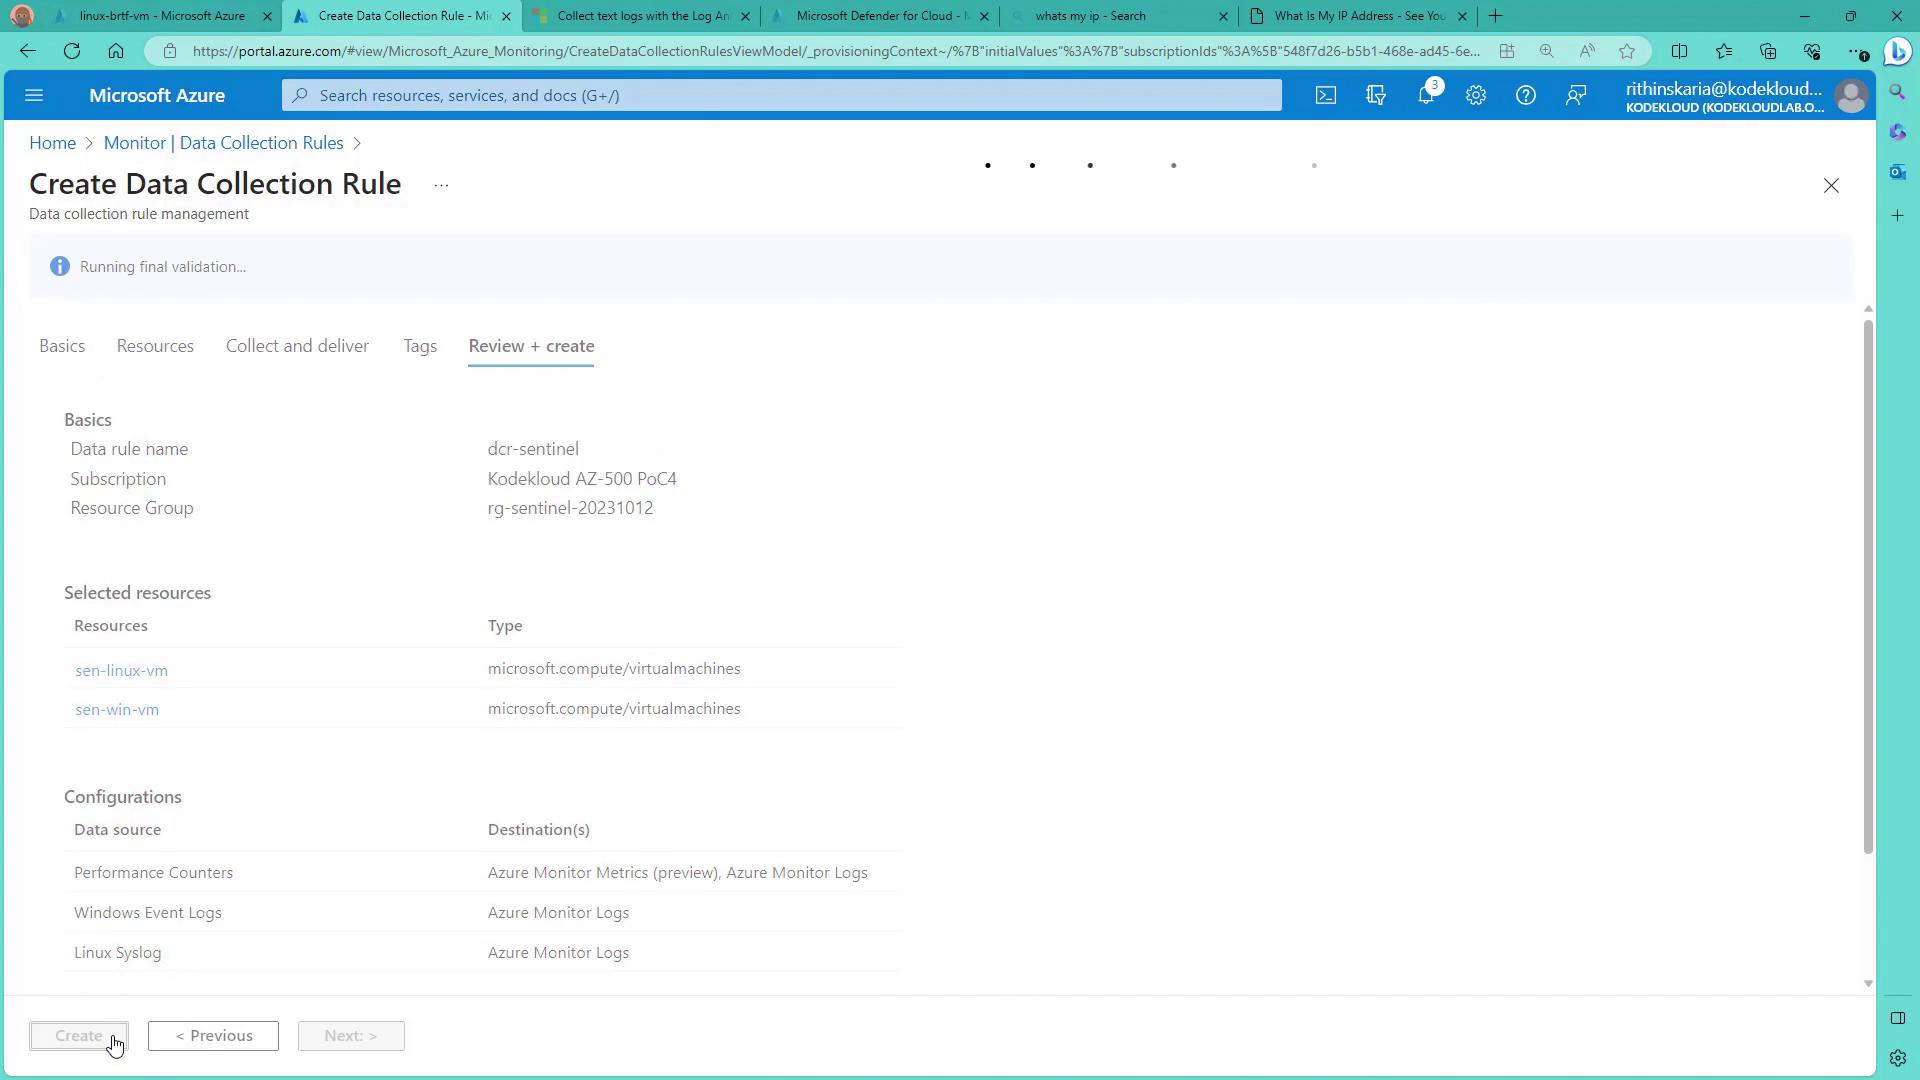
Configure data connections to Microsoft Sentinel by setting up connectors that serve as secure bridges between Sentinel and various data sources. These connectors enable Sentinel to receive logs and data from Microsoft solutions, third-party services, cloud providers, or on-premises infrastructure. In doing so, Sentinel builds a comprehensive security overview by correlating events, detecting anomalies, and responding promptly to potential threats.Setting up connectors is simple and intuitive. With only a few clicks, you can integrate multiple services to ensure that every data source is monitored.For example, the Azure Kubernetes Service (AKS) connector allows you to link AKS with Sentinel, importing all the log data stored in Log Analytics. Some connectors are deployed exclusively through solutions; Microsoft provides a comprehensive catalog, and you can also find community-built connectors on the Microsoft Sentinel GitHub repository if you need additional data integrations.In this guide, you will learn how to onboard Windows and Linux servers to Azure Monitor and analyze their logs using Azure Sentinel. The first step involves enabling the Azure Monitoring Agent (AMA) on your virtual machines by creating a Data Collection Rule (DCR).Navigate to the Monitor section to create a Data Collection Rule. Name the rule (e.g., “DCR for Sentinel”) and assign it to the Sentinel resource group. This rule applies to all your servers and requires the creation of a Data Collection Endpoint to handle data collection—especially for Linux machines that do not support direct connectivity using AMA. Although Ubuntu 22.04 does not support MFA, a Data Collection Endpoint can still link it to your Linux service. Under Resources, add both Windows and Linux servers; then, under Collect and Deliver, select all available data sources such as performance counters, application logs, security logs, and system logs. The destination for this collected data is your Sentinel workspace.
Once you configure the data sources, the system verifies whether the AMA is installed on these servers. If not, it automatically installs the extension to onboard them to Azure Monitor.
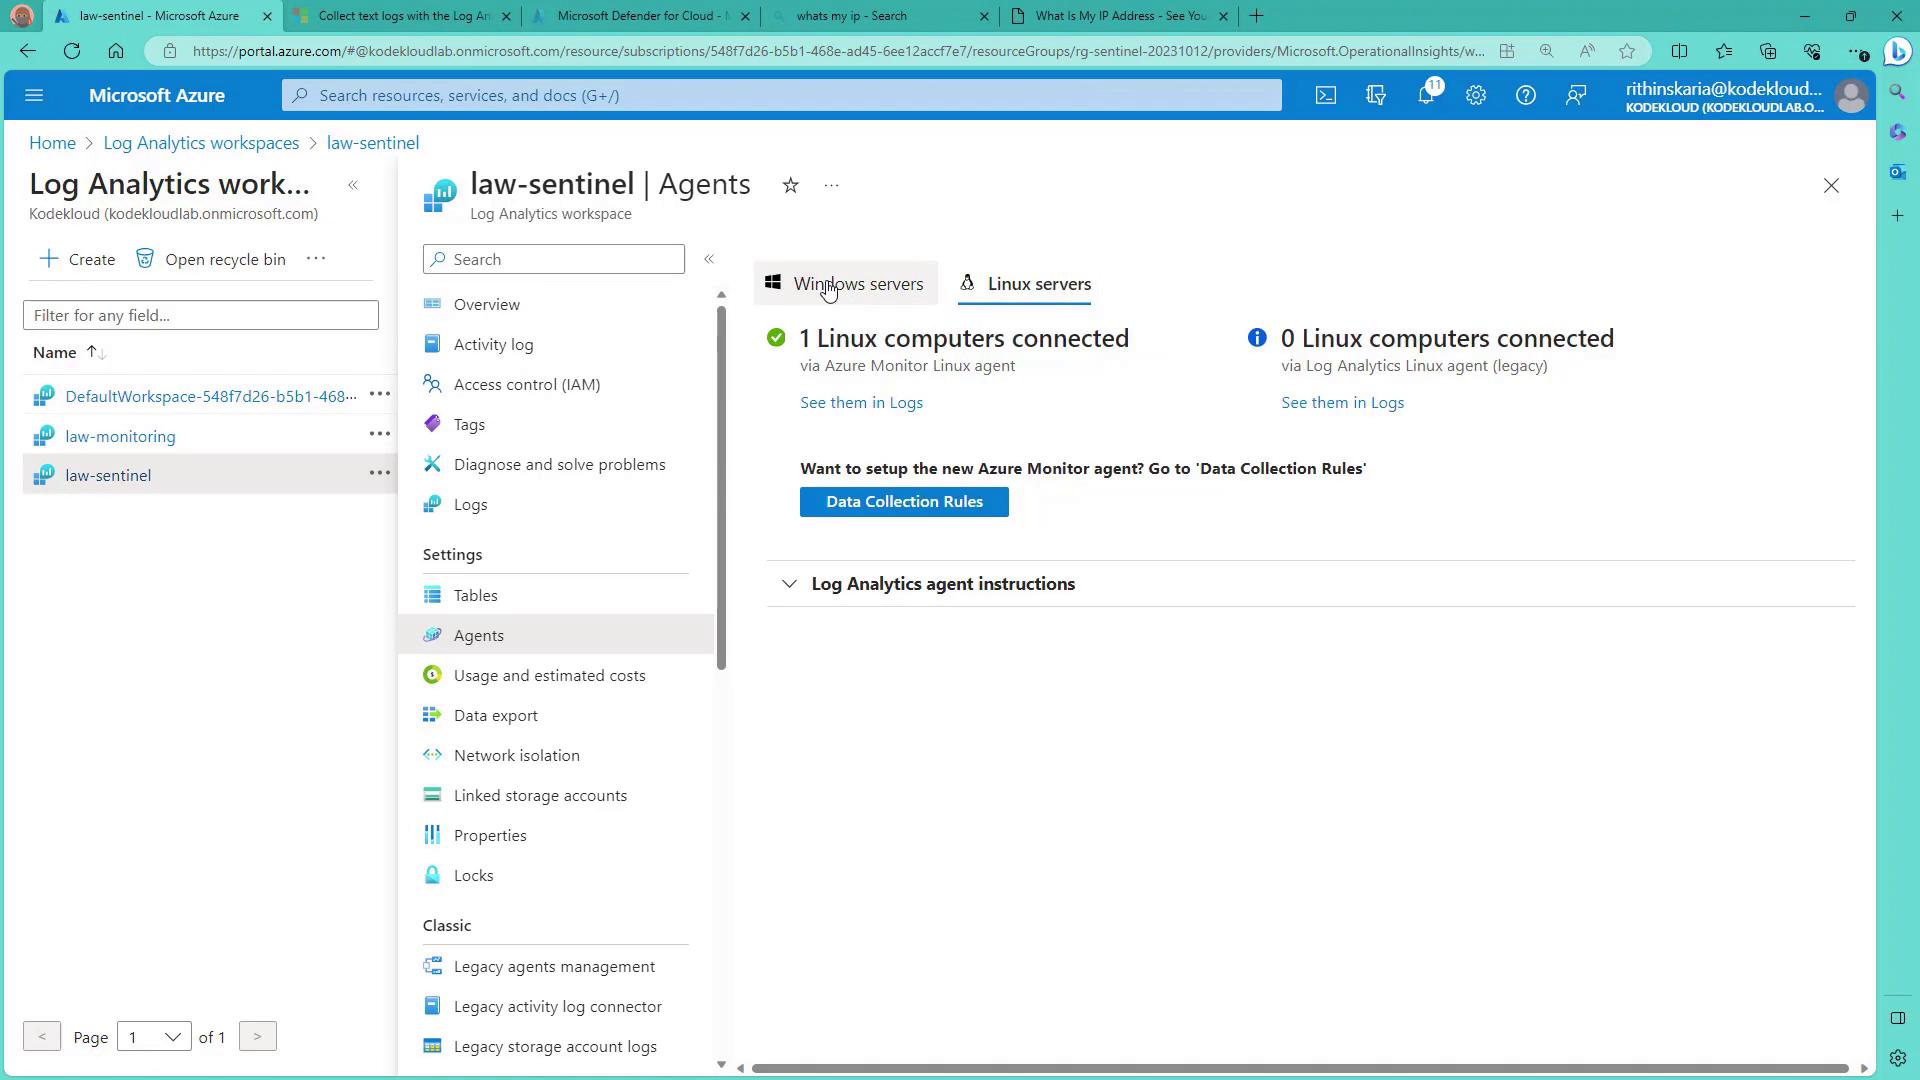
After onboarding, wait for the servers’ heartbeats to appear in your Log Analytics workspace. This workspace displays connected servers along with the status of the Azure Monitor Agent.
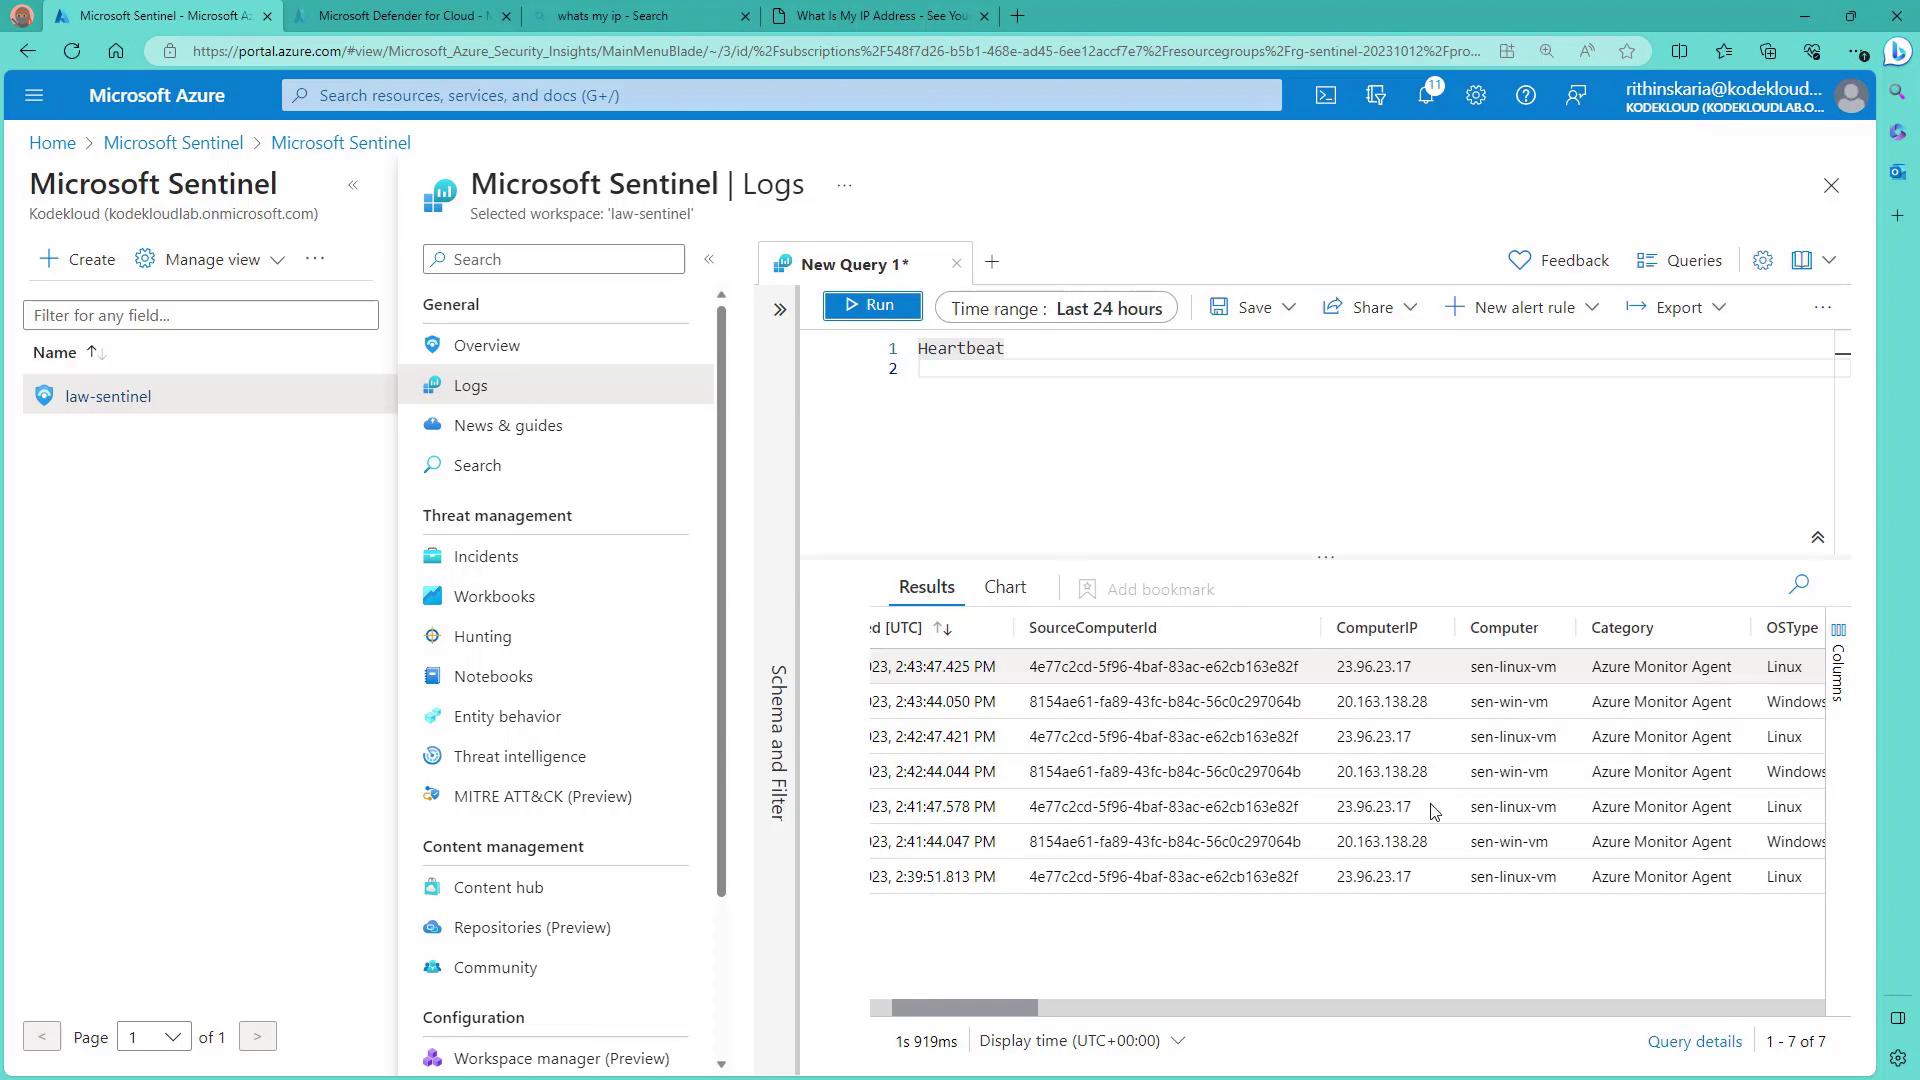
Return to Sentinel and click on Logs to access the same data from your Log Analytics workspace. Running a query will display heartbeat information for both Linux and Windows servers.
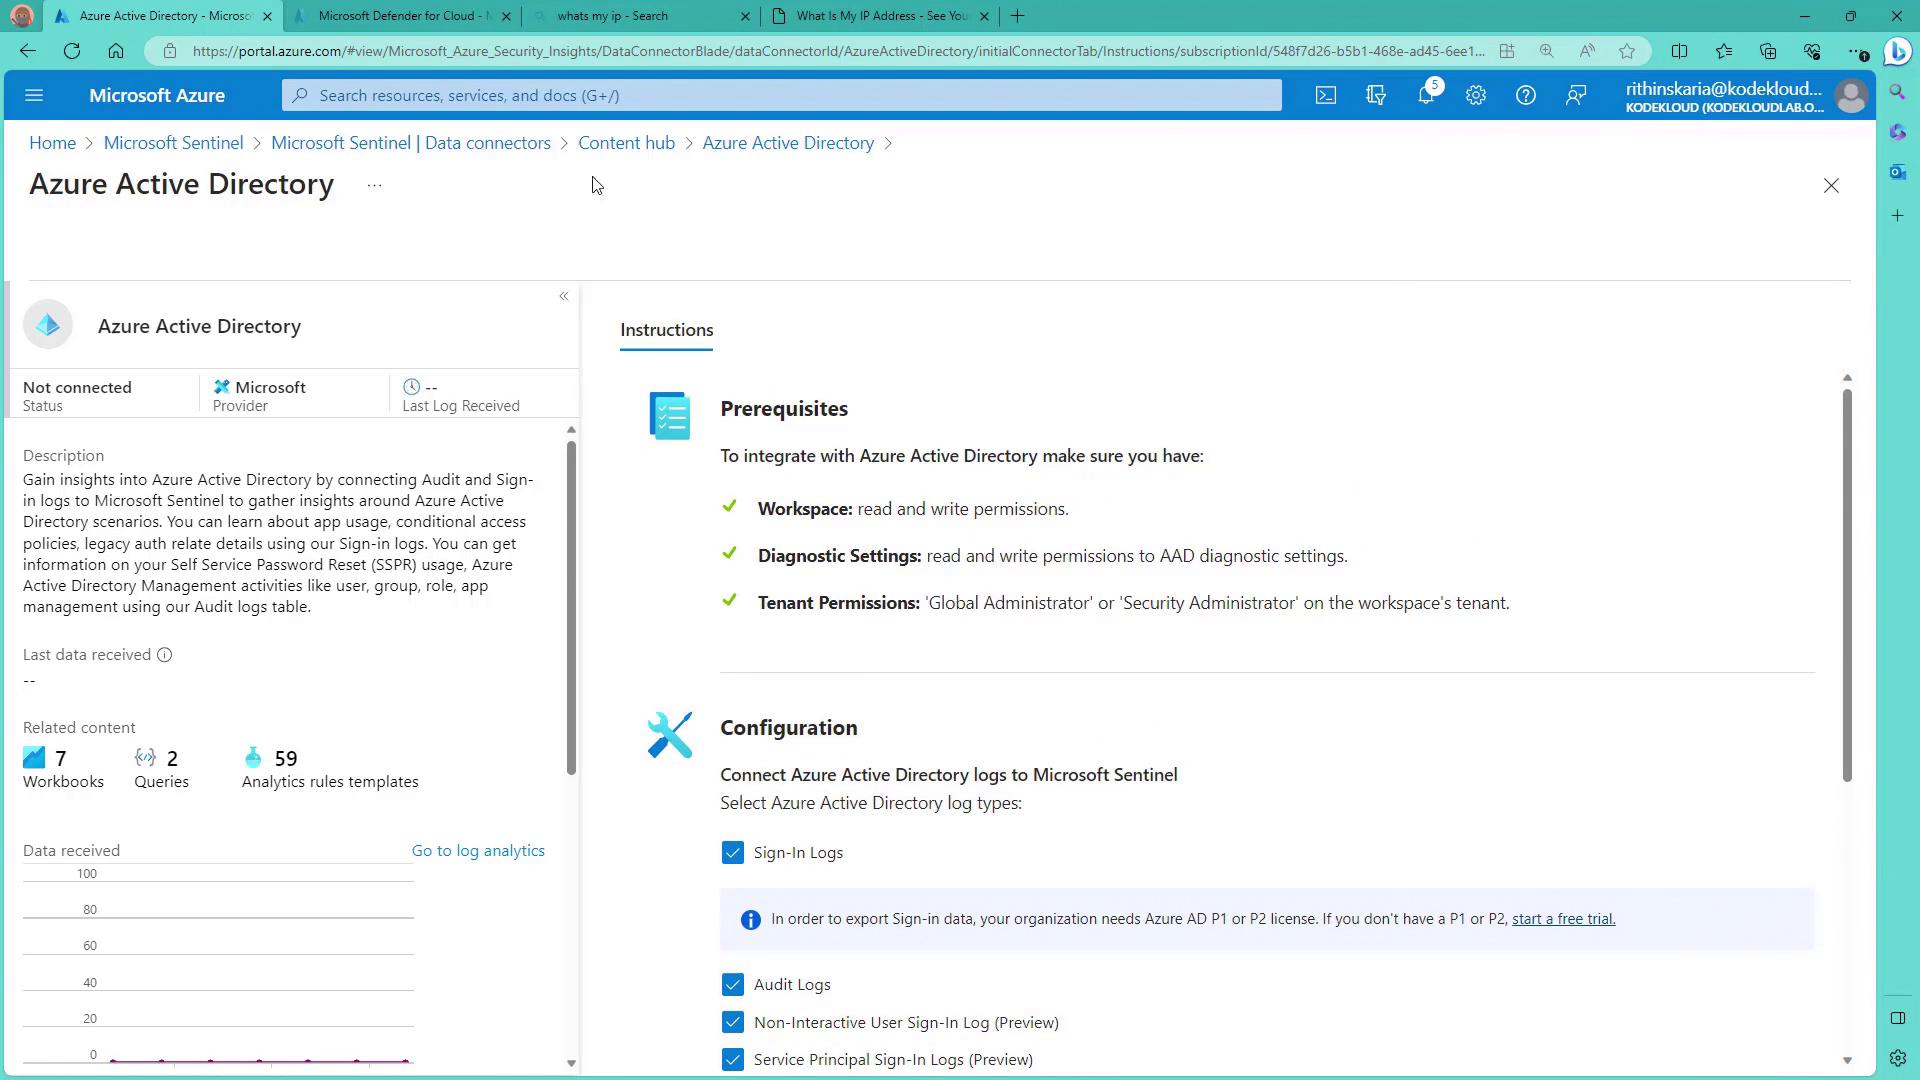
Next, go to the Connectors section in Sentinel to view the available data connectors. Under Featured Data Connectors, you can onboard essential services such as Azure Activity, Azure Active Directory, Microsoft Defender, Defender for Cloud, and various security events.Begin by installing the Azure Active Directory connector, then proceed with Azure Activity and other connectors. Once the installations are complete, your Sentinel instance is ready to process the incoming logs.For the Azure Active Directory connector, navigate to its Manage section. Here, you will see details like “Connect Azure Active Directory logs to Sentinel.” Note that exporting sign-in data may require P1 or P2 licenses. If you do not have a license yet, you can start with a trial to enable the necessary features.
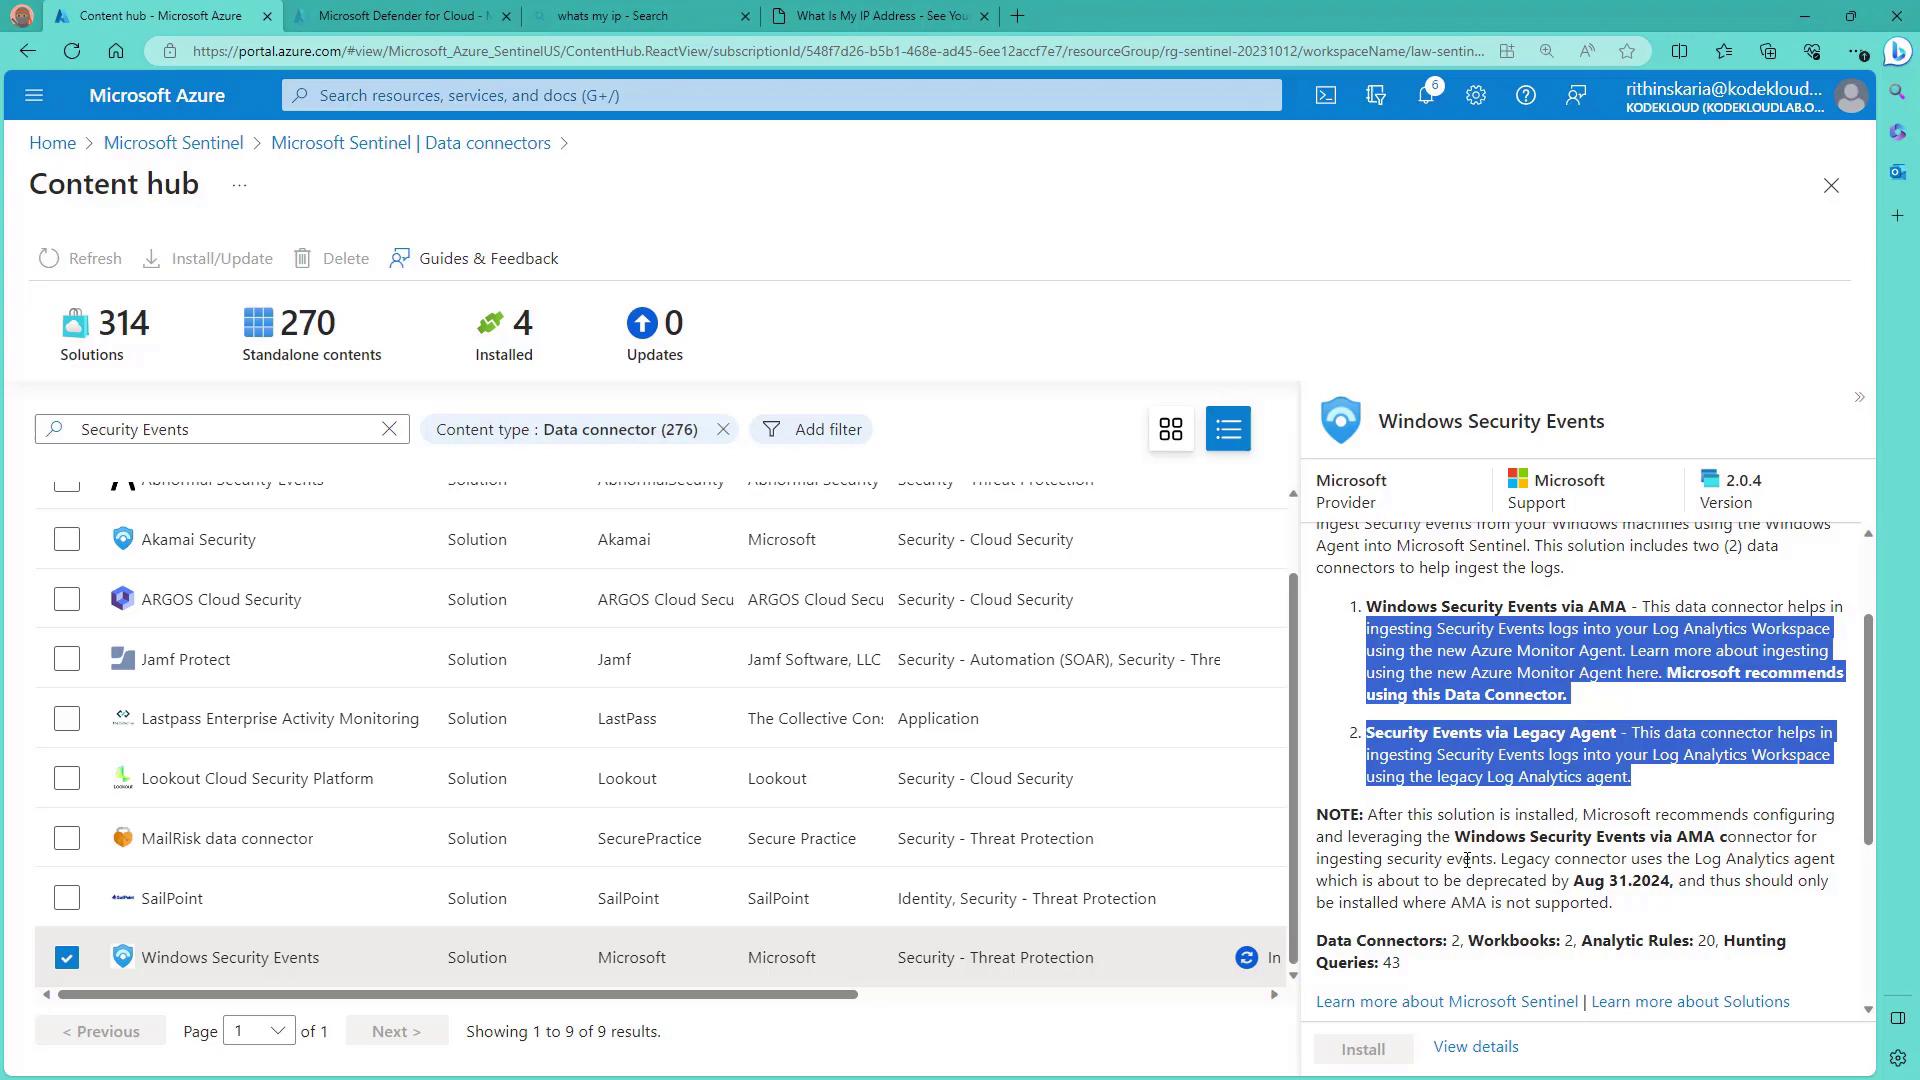
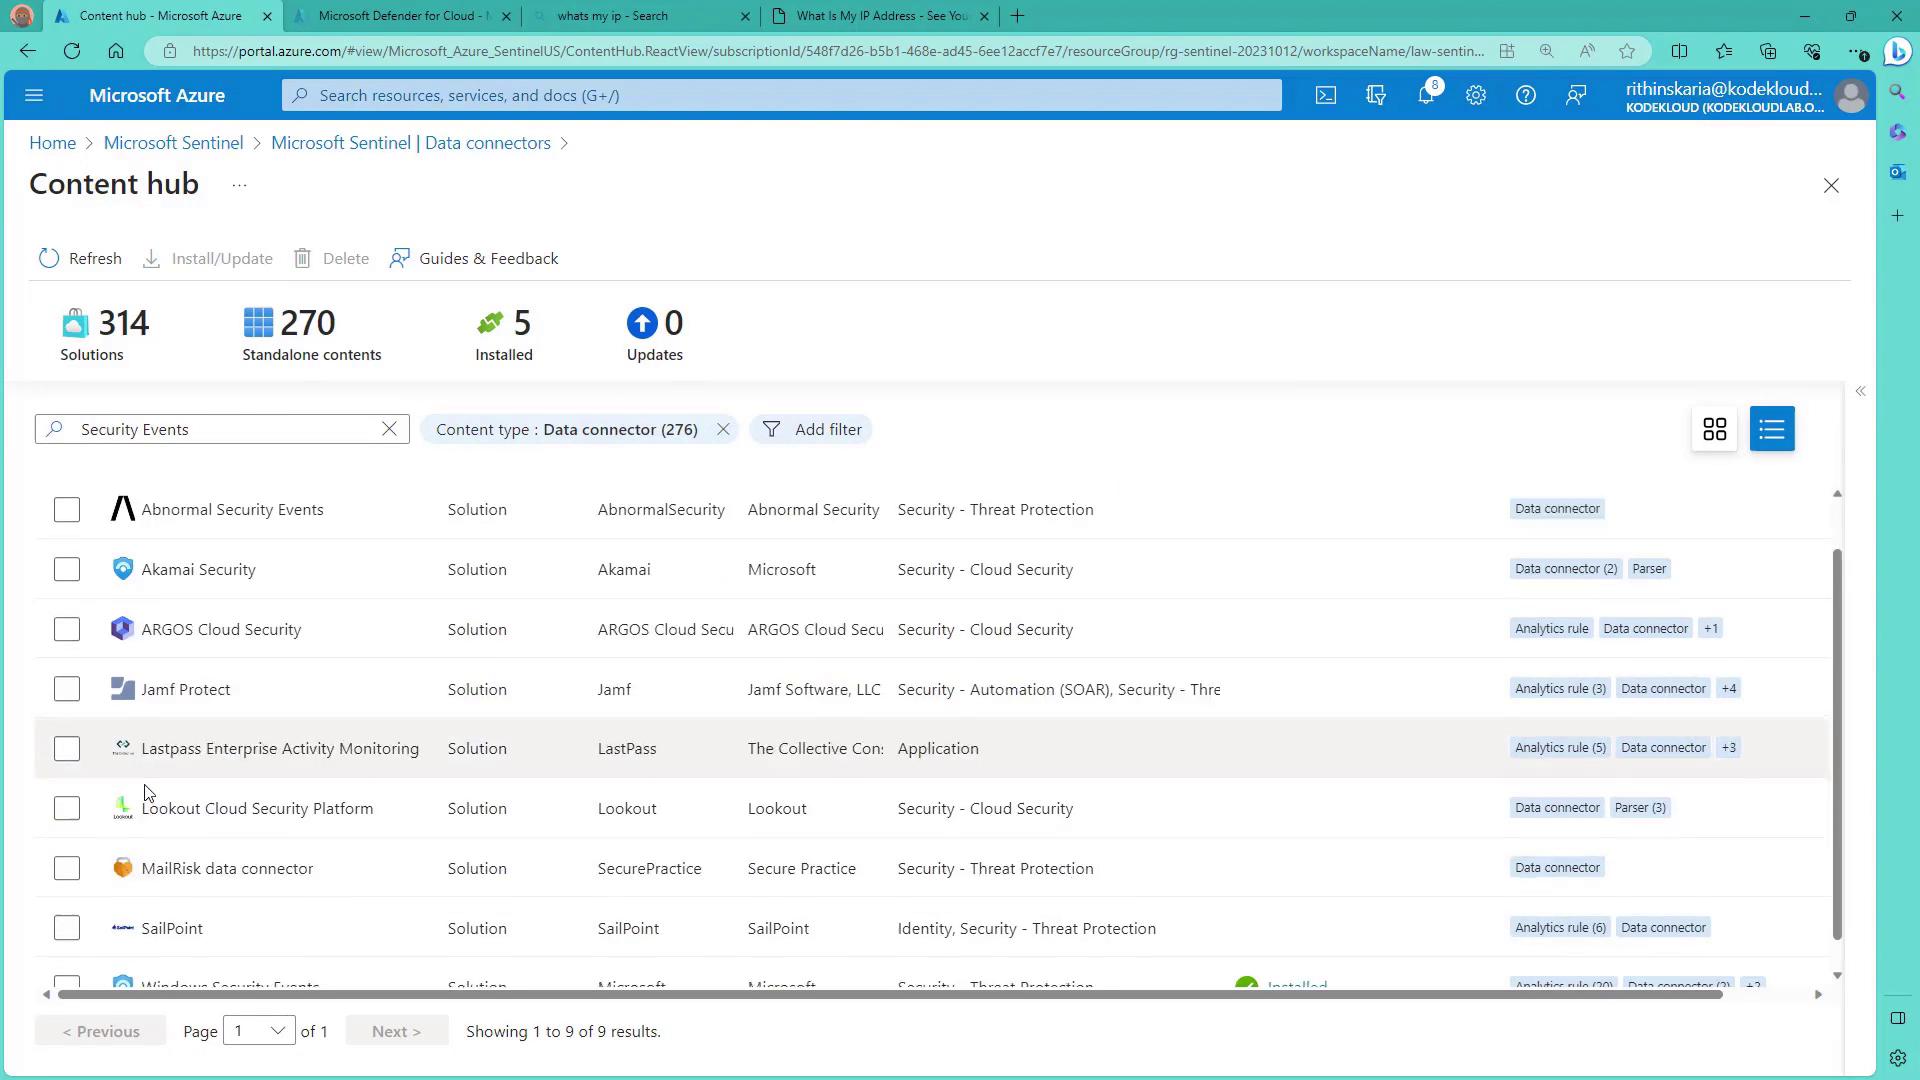
Return to the Content Hub and open the Azure Activity solution to manage an item. Some solutions require a policy—for example, one named “Send Azure Logs to Log Analytics Workspace” must be assigned to ensure proper data transmission. This step showcases the configuration process.To onboard security events from Windows servers, clear the filter in the Content Hub and search for Windows Security Events. Click to install the connector; you will notice that two onboarding methods are available. One uses the Azure Monitor Agent extension (AME) while the other uses a legacy agent, which will be deprecated soon.
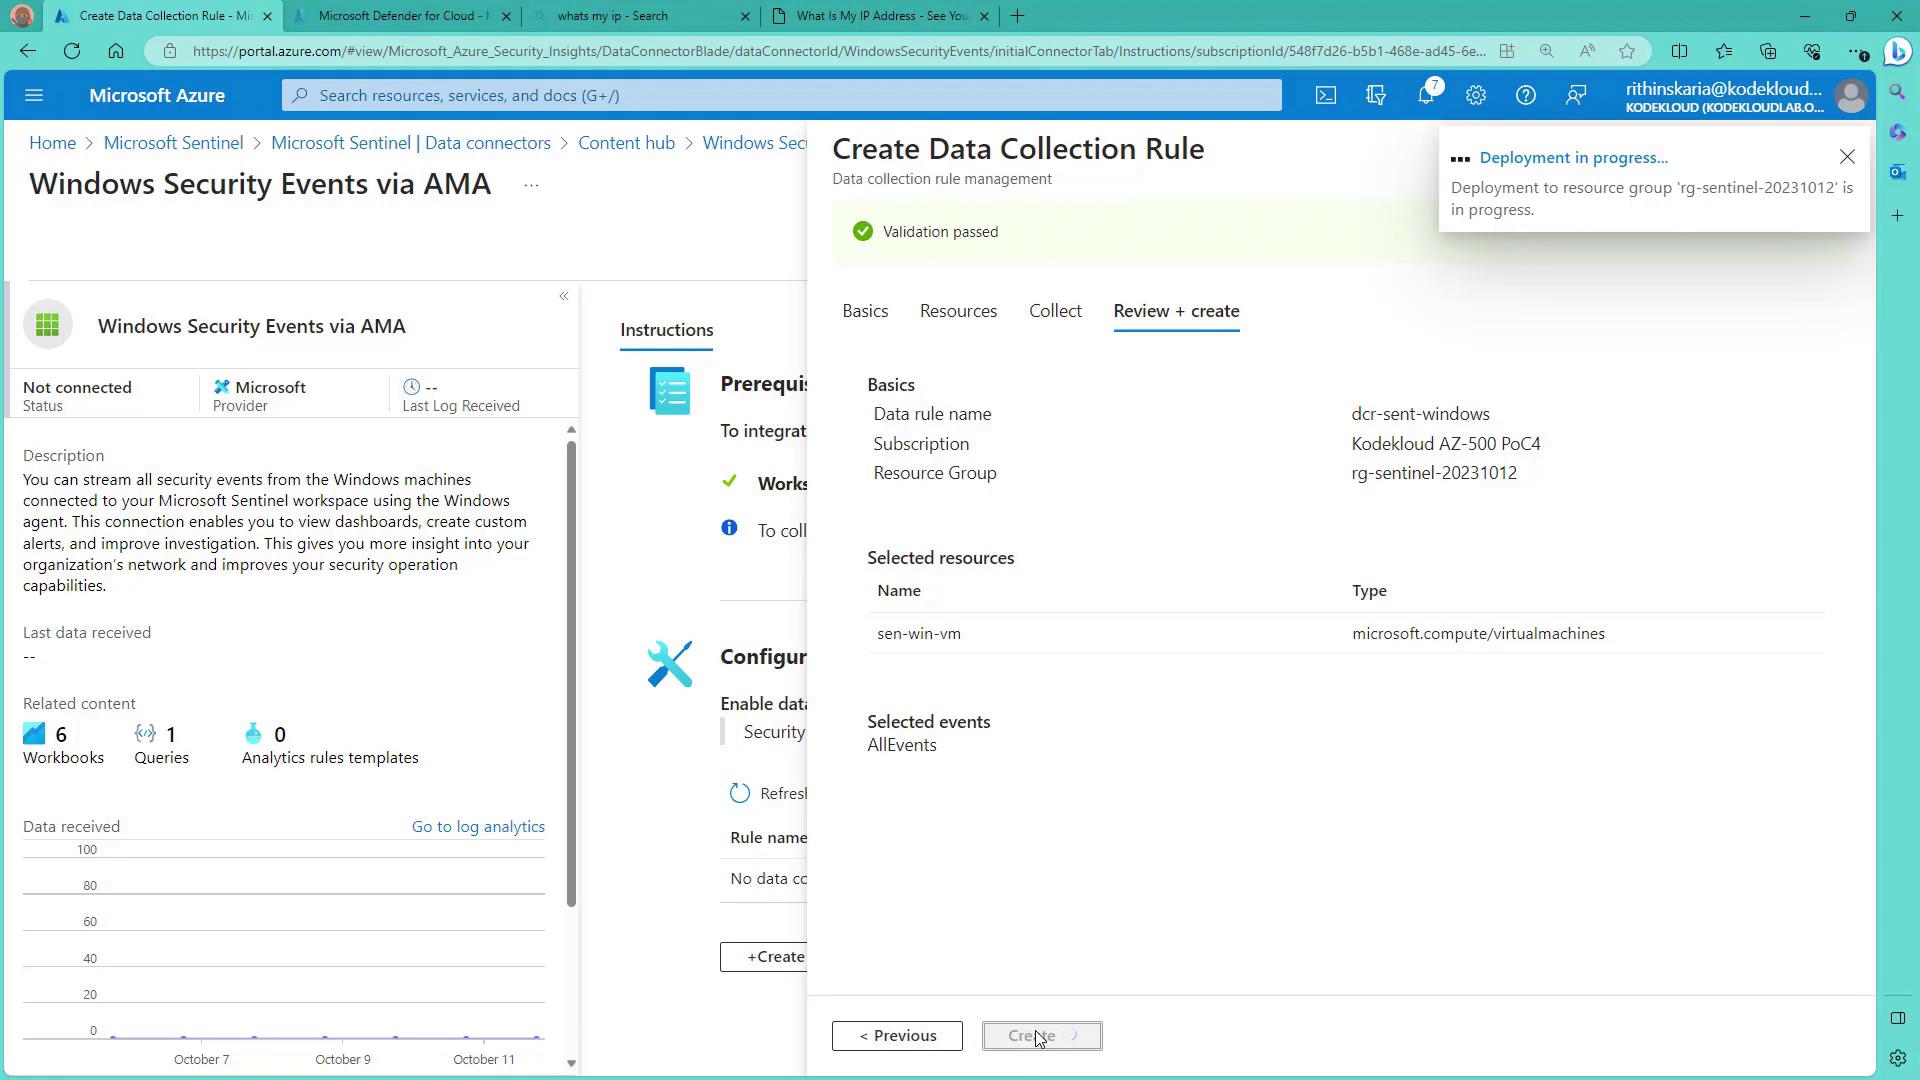
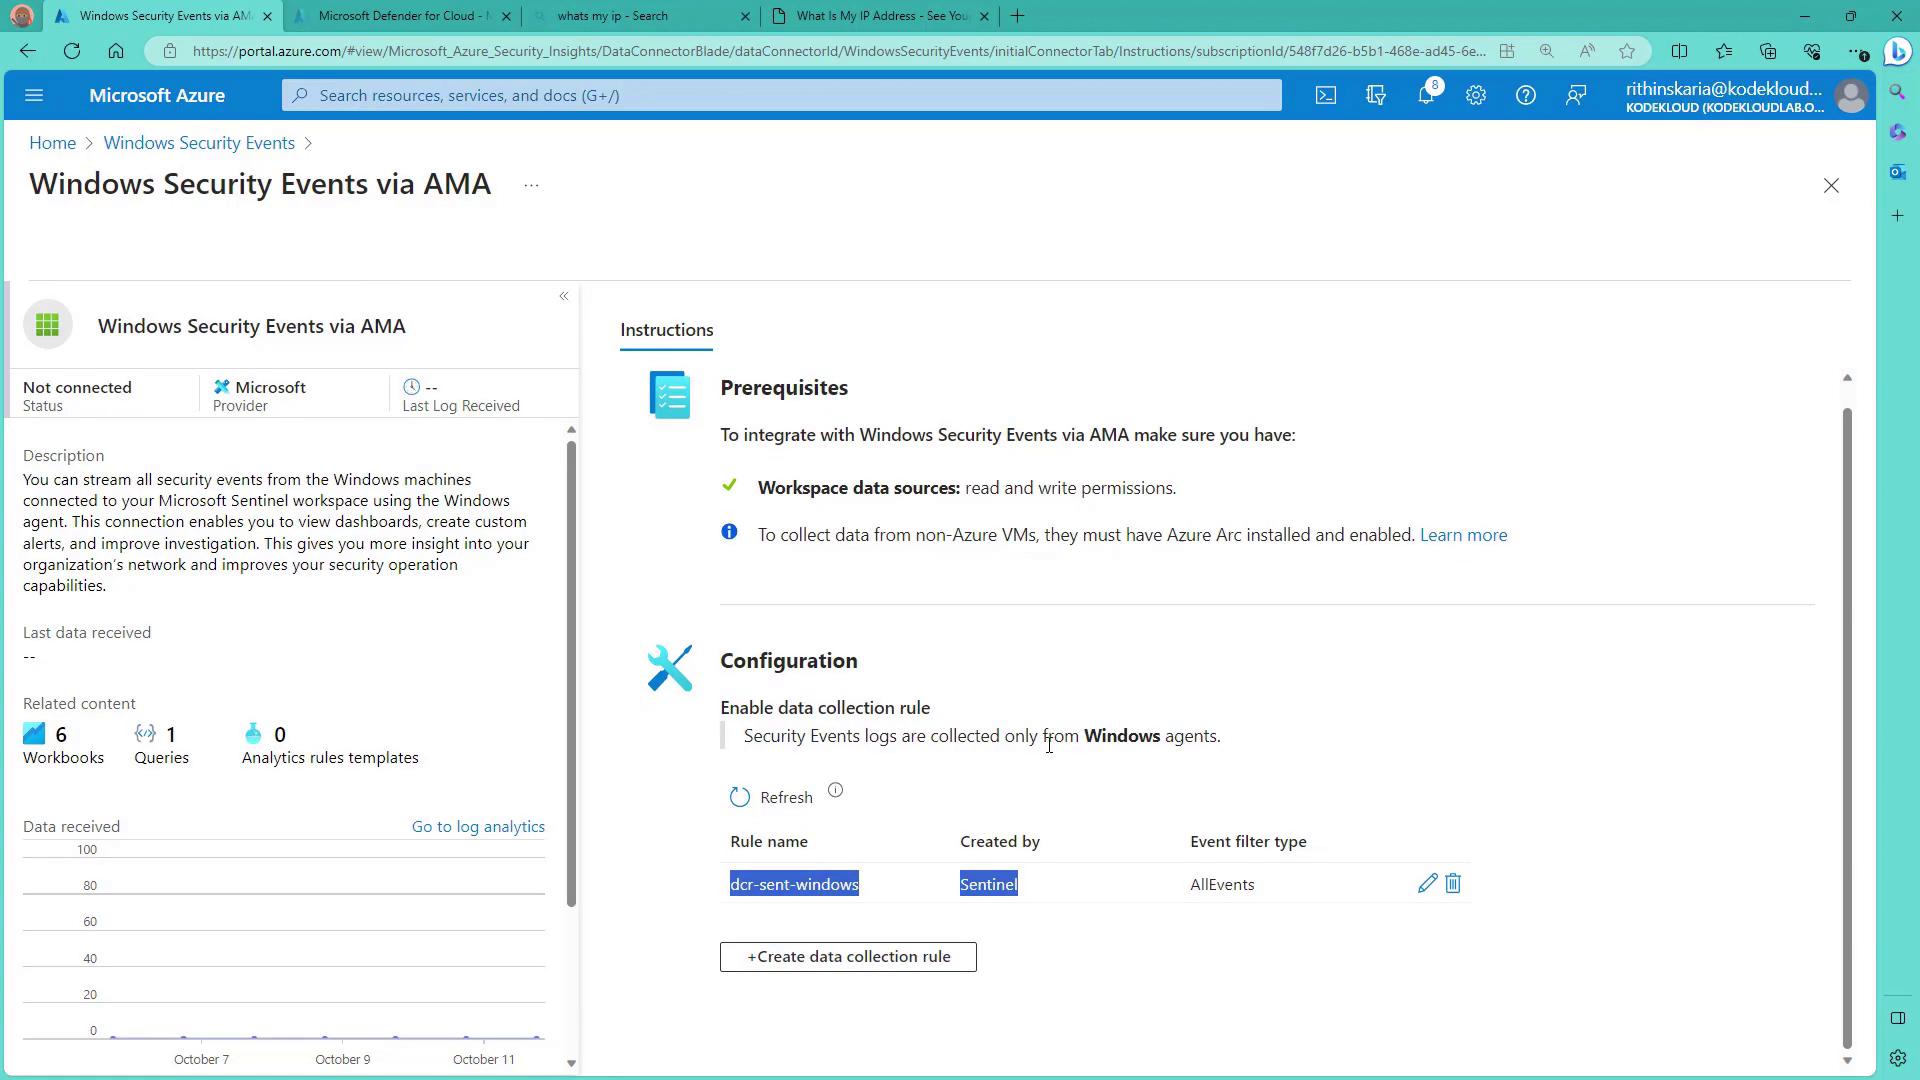
Wait for the installation to complete. Once finished, click on Manage for “Security Events via APM.” Since this connector requires a Data Collection Rule that collects data exclusively from Windows machines, create a new rule (for example, “DCR Sentinel Windows Resources”) and add your Windows machine to it. Under the collection configuration, specify that all security events should be collected.
After applying the rule, refresh the interface to verify that the new Data Collection Rule is visible.
Go back to the Manage section to confirm that the Data Collection Rule is properly listed. With this configuration, security events from your Windows machines are now being ingested by Azure Sentinel.
At this point, your Windows machine is successfully connected to Sentinel. To verify that logs are being collected, return to Sentinel and check for a table named SecurityEvent (or similar). Initially, this table might be empty if no events have occurred within the last 24 hours.
Consider creating custom workbooks to visualize your log data more intuitively. Workbooks can provide enhanced insights compared to raw queries.
In summary, this guide demonstrates how to onboard Windows servers—and other connectors—into Azure Sentinel. You can further analyze and visualize the collected data using workbooks. For example, to query security events in your log query window, you might use the following command:
Copy
SecurityEvent
Workbooks make it easier to explore and understand your security data, improving your overall monitoring experience.