> ## Documentation Index
> Fetch the complete documentation index at: https://notes.kodekloud.com/llms.txt
> Use this file to discover all available pages before exploring further.
# Forecast
> Explains the forecast command that analyzes Jenkins historical runs to predict GitHub Actions runner minutes, peak concurrency, queue behavior, and costs to plan pipeline migration.
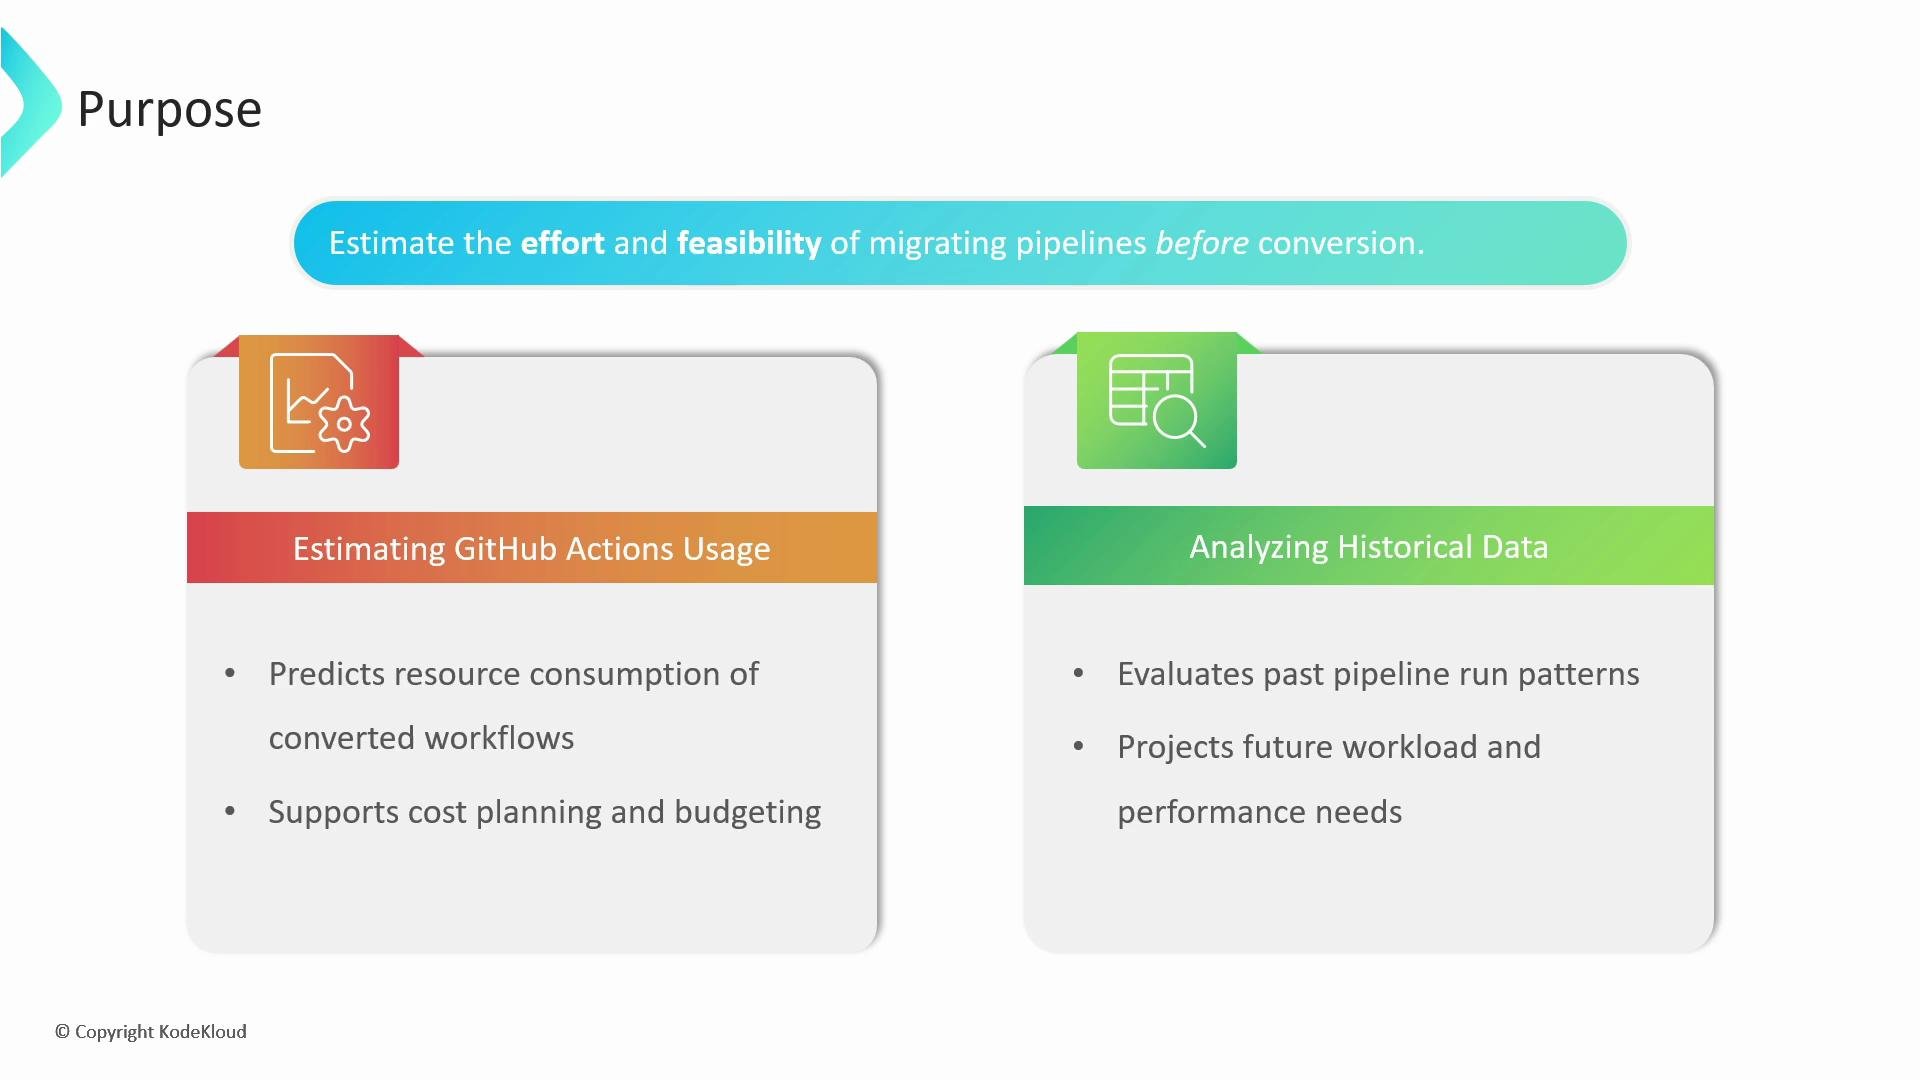
This lesson covers the `forecast` command from GitHub Actions Importer. The forecast step estimates the effort, resource usage, and feasibility of migrating Jenkins CI/CD pipelines to GitHub Actions before you convert them. By analyzing historical Jenkins run data, it predicts runner minutes, concurrency needs, and queue behavior so you can plan capacity and cost for GitHub-hosted or self-hosted runners.
 How the forecast command works — a high-level overview:
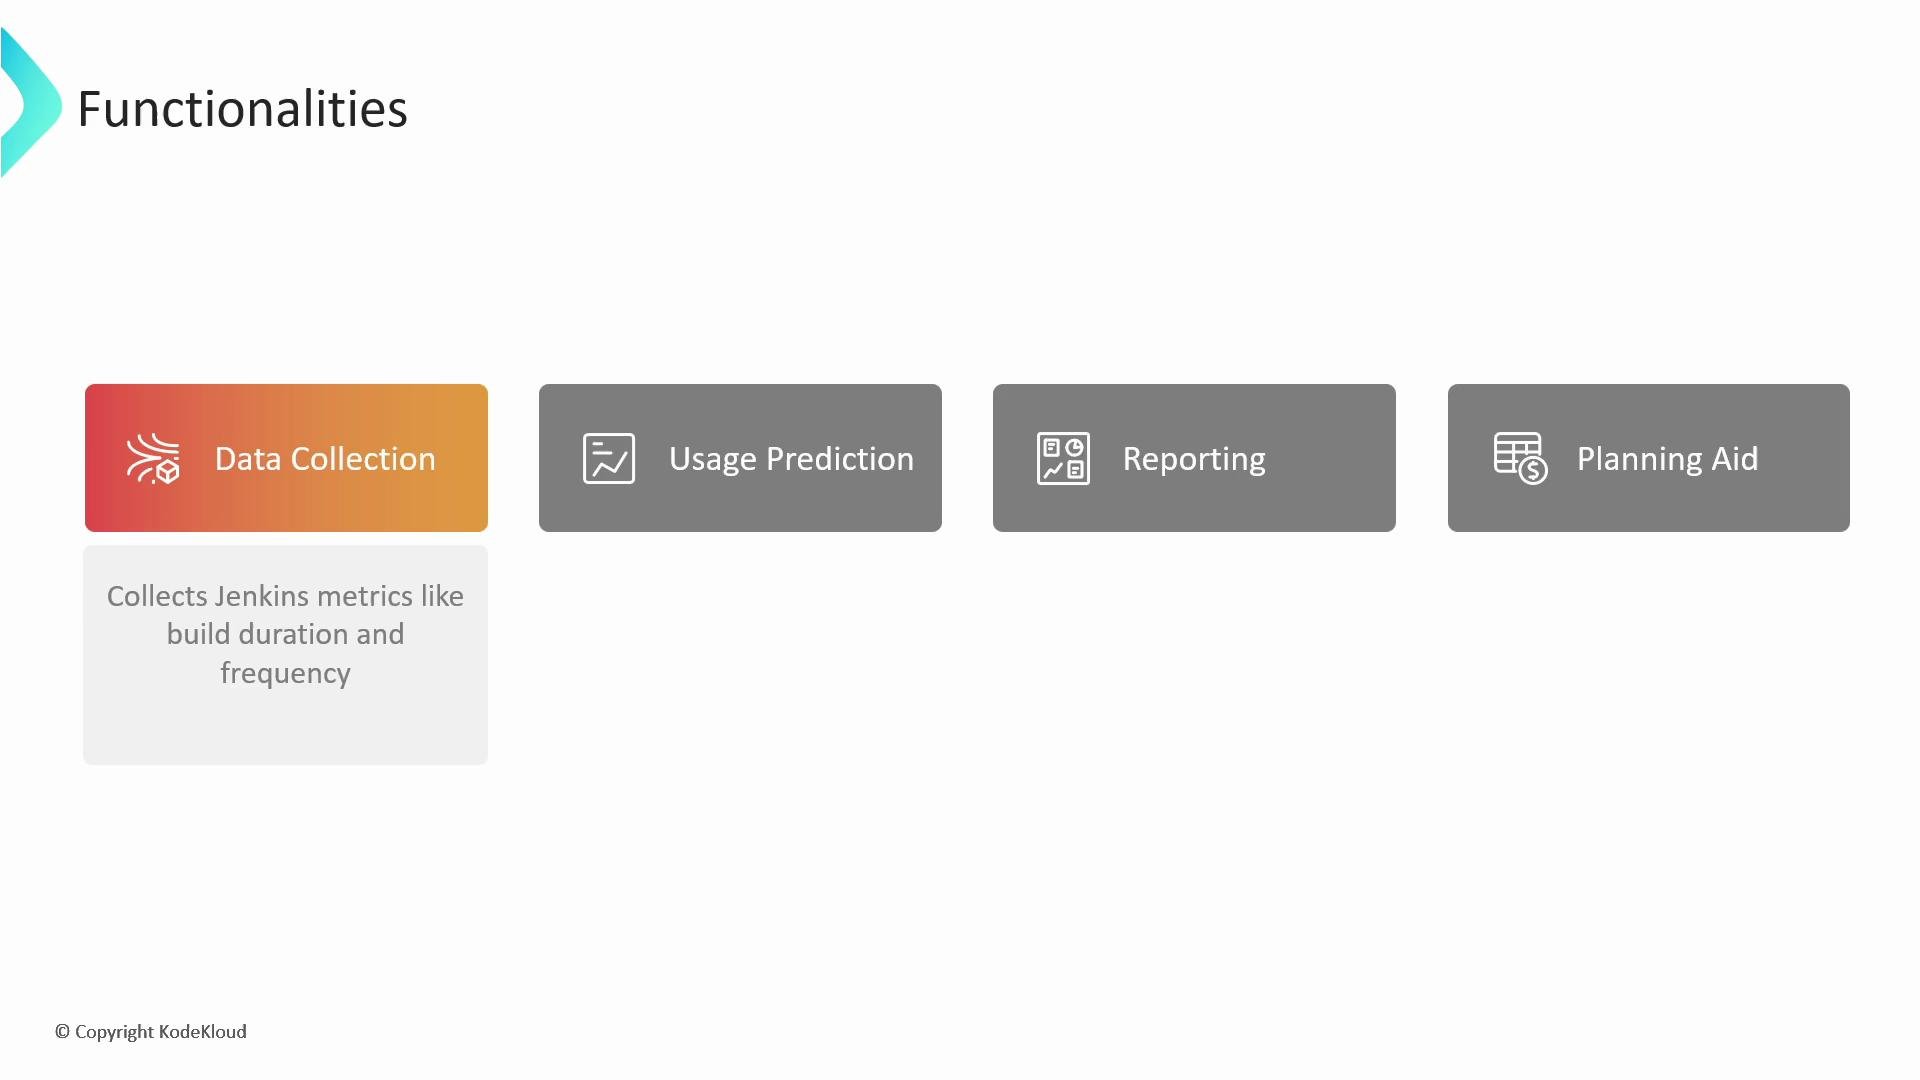
* Data collection: extracts Jenkins metrics such as build durations, frequencies, job metadata, and queue labels.
* Usage prediction: analyzes the collected metrics to estimate GitHub Actions runner minutes, peak concurrency, and expected queue times.
* Reporting: produces logs, datasets of completed jobs, and human-readable forecast reports.
* Planning aid: provides actionable numbers to size runner pools, choose runner types, and estimate billing costs.
How the forecast command works — a high-level overview:
* Data collection: extracts Jenkins metrics such as build durations, frequencies, job metadata, and queue labels.
* Usage prediction: analyzes the collected metrics to estimate GitHub Actions runner minutes, peak concurrency, and expected queue times.
* Reporting: produces logs, datasets of completed jobs, and human-readable forecast reports.
* Planning aid: provides actionable numbers to size runner pools, choose runner types, and estimate billing costs.
 ## Usage
Run the forecast against your Jenkins instance. The command writes logs and the forecast report to the output directory you specify:
```bash theme={null}
gh actions-importer forecast jenkins --output-dir tmp/forecast
```
After the command completes, the output directory (for example `tmp/forecast`) contains:
* Logs of the forecast process
* A dataset of completed Jenkins jobs used for analysis
* One or more forecast reports summarizing resource and concurrency predictions
## Key metrics included in the forecast report
The forecast report focuses on a concise set of metrics that drive migration planning. Use the table below to quickly understand each metric and why it matters.
| Metric | What it measures | Why it matters |
| ----------------- | ------------------------------------------------------------ | --------------------------------------------------------------------- |
| Job count | Total number of completed jobs analyzed | Helps validate dataset size and representativeness |
| Pipeline count | Number of unique pipelines (jobs) observed | Identifies breadth of workflows to migrate |
| Execution time | Time a runner spent executing a job (per-job and aggregated) | Direct input for calculating total runner minutes and cost |
| Queue time | Time jobs waited for a runner | Reveals need for higher concurrency or autoscaling |
| Concurrent jobs | Jobs running simultaneously over time | Determines peak runner count required |
| Per-queue metrics | Metrics broken down by Jenkins queue/label/node type | Useful when different queue types have different capacity or hardware |
Example summary from a forecast report:
```text theme={null}
- Job count: 73
- Pipeline count: 6
- Execution time
- Total: 27,057 minutes
- Median: 2 minutes
- P90: 19 minutes
- Min: 0 minutes
- Max: 15,625 minutes
```
Use those totals to estimate GitHub-hosted runner cost (runner minutes × price per minute for the chosen runner type). Refer to the GitHub Actions billing documentation to apply accurate pricing:
* [About billing for GitHub Actions](https://docs.github.com/en/billing/managing-billing-for-github-actions/about-billing-for-github-actions)
## How to interpret the numbers
* Execution time (total and percentiles): gives you expected monthly or yearly runner minutes. Multiply these by the per-minute price for the runner image you plan to use to estimate cost.
* Peak concurrency: informs how many simultaneous runners you should provide (self-hosted or GitHub-hosted concurrency limits).
* High queue time: indicates either not enough runners or uneven scheduling; consider autoscaling or redistributing workloads.
* Per-queue differences: prioritize migrating queues with predictable usage first; complex or highly variable queues may need capacity buffer or dedicated self-hosted runners.
Use the forecast results to size runner pools and estimate costs before migrating pipelines. Combine the forecasted runner minutes and peak concurrency with GitHub Actions pricing and your chosen runner types to prepare an accurate migration plan.
## Example planning steps after a forecast
1. Aggregate total runner minutes from the forecast for the migration window you care about (monthly, quarterly).
2. Choose runner types (GitHub-hosted images or self-hosted hardware), and apply cost per-minute or infrastructure cost estimates.
3. Evaluate peak concurrency to set a minimum runner pool or autoscaling policy.
4. For queues with large variance or long-running jobs, consider isolating those onto dedicated self-hosted runners or throttling parallelism.
5. Re-run forecasts periodically or after major pipeline changes to keep capacity planning accurate.
## Links and references
* [GitHub Actions billing documentation](https://docs.github.com/en/billing/managing-billing-for-github-actions/about-billing-for-github-actions)
* [GitHub Actions Importer (project README)](https://github.com/github-actions/importer) (reference for command usage and advanced options)
That’s all for now.
## Usage
Run the forecast against your Jenkins instance. The command writes logs and the forecast report to the output directory you specify:
```bash theme={null}
gh actions-importer forecast jenkins --output-dir tmp/forecast
```
After the command completes, the output directory (for example `tmp/forecast`) contains:
* Logs of the forecast process
* A dataset of completed Jenkins jobs used for analysis
* One or more forecast reports summarizing resource and concurrency predictions
## Key metrics included in the forecast report
The forecast report focuses on a concise set of metrics that drive migration planning. Use the table below to quickly understand each metric and why it matters.
| Metric | What it measures | Why it matters |
| ----------------- | ------------------------------------------------------------ | --------------------------------------------------------------------- |
| Job count | Total number of completed jobs analyzed | Helps validate dataset size and representativeness |
| Pipeline count | Number of unique pipelines (jobs) observed | Identifies breadth of workflows to migrate |
| Execution time | Time a runner spent executing a job (per-job and aggregated) | Direct input for calculating total runner minutes and cost |
| Queue time | Time jobs waited for a runner | Reveals need for higher concurrency or autoscaling |
| Concurrent jobs | Jobs running simultaneously over time | Determines peak runner count required |
| Per-queue metrics | Metrics broken down by Jenkins queue/label/node type | Useful when different queue types have different capacity or hardware |
Example summary from a forecast report:
```text theme={null}
- Job count: 73
- Pipeline count: 6
- Execution time
- Total: 27,057 minutes
- Median: 2 minutes
- P90: 19 minutes
- Min: 0 minutes
- Max: 15,625 minutes
```
Use those totals to estimate GitHub-hosted runner cost (runner minutes × price per minute for the chosen runner type). Refer to the GitHub Actions billing documentation to apply accurate pricing:
* [About billing for GitHub Actions](https://docs.github.com/en/billing/managing-billing-for-github-actions/about-billing-for-github-actions)
## How to interpret the numbers
* Execution time (total and percentiles): gives you expected monthly or yearly runner minutes. Multiply these by the per-minute price for the runner image you plan to use to estimate cost.
* Peak concurrency: informs how many simultaneous runners you should provide (self-hosted or GitHub-hosted concurrency limits).
* High queue time: indicates either not enough runners or uneven scheduling; consider autoscaling or redistributing workloads.
* Per-queue differences: prioritize migrating queues with predictable usage first; complex or highly variable queues may need capacity buffer or dedicated self-hosted runners.
Use the forecast results to size runner pools and estimate costs before migrating pipelines. Combine the forecasted runner minutes and peak concurrency with GitHub Actions pricing and your chosen runner types to prepare an accurate migration plan.
## Example planning steps after a forecast
1. Aggregate total runner minutes from the forecast for the migration window you care about (monthly, quarterly).
2. Choose runner types (GitHub-hosted images or self-hosted hardware), and apply cost per-minute or infrastructure cost estimates.
3. Evaluate peak concurrency to set a minimum runner pool or autoscaling policy.
4. For queues with large variance or long-running jobs, consider isolating those onto dedicated self-hosted runners or throttling parallelism.
5. Re-run forecasts periodically or after major pipeline changes to keep capacity planning accurate.
## Links and references
* [GitHub Actions billing documentation](https://docs.github.com/en/billing/managing-billing-for-github-actions/about-billing-for-github-actions)
* [GitHub Actions Importer (project README)](https://github.com/github-actions/importer) (reference for command usage and advanced options)
That’s all for now.