> ## Documentation Index
> Fetch the complete documentation index at: https://notes.kodekloud.com/llms.txt
> Use this file to discover all available pages before exploring further.
# Data Ingestion
> Guidance on collecting, managing, and designing scalable telemetry ingestion into Datadog, covering telemetry types, sources, sampling, tagging, retention, and cost control practices.
This lesson explains how telemetry is collected and sent into Datadog so you can observe what's happening across your applications and infrastructure. It covers the primary telemetry types, where they originate, and practical guidance for designing a scalable ingestion strategy.
## Telemetry types at a glance
Telemetry typically falls into four categories. Each type serves distinct use cases and has different volume and retention characteristics:
| Telemetry type | What it measures | Common sources | Typical retention / use case |
| -------------- | -----------------------------------------------: | ----------------------------------------------- | ---------------------------------------------------------------------- |
| Metrics | Numeric time-series (counts, gauges, histograms) | Host agents, custom app metrics, cloud services | Short-term high-resolution for alerts; aggregated long-term for trends |
| Logs | Unstructured or structured event records | Application logs, system logs, audit trails | High volume; filter/sampling to reduce cost |
| Traces | Distributed request flows across services | Application instrumentation (APM) | Sampled for performance debugging and root cause analysis |
| Profiles | CPU/memory/heap and runtime profiles | Profilers, APM integrations | Used for performance optimizations; lower volume but high value |
For Datadog-specific implementation details see the Datadog documentation: [https://docs.datadoghq.com/](https://docs.datadoghq.com/)
## Where telemetry originates
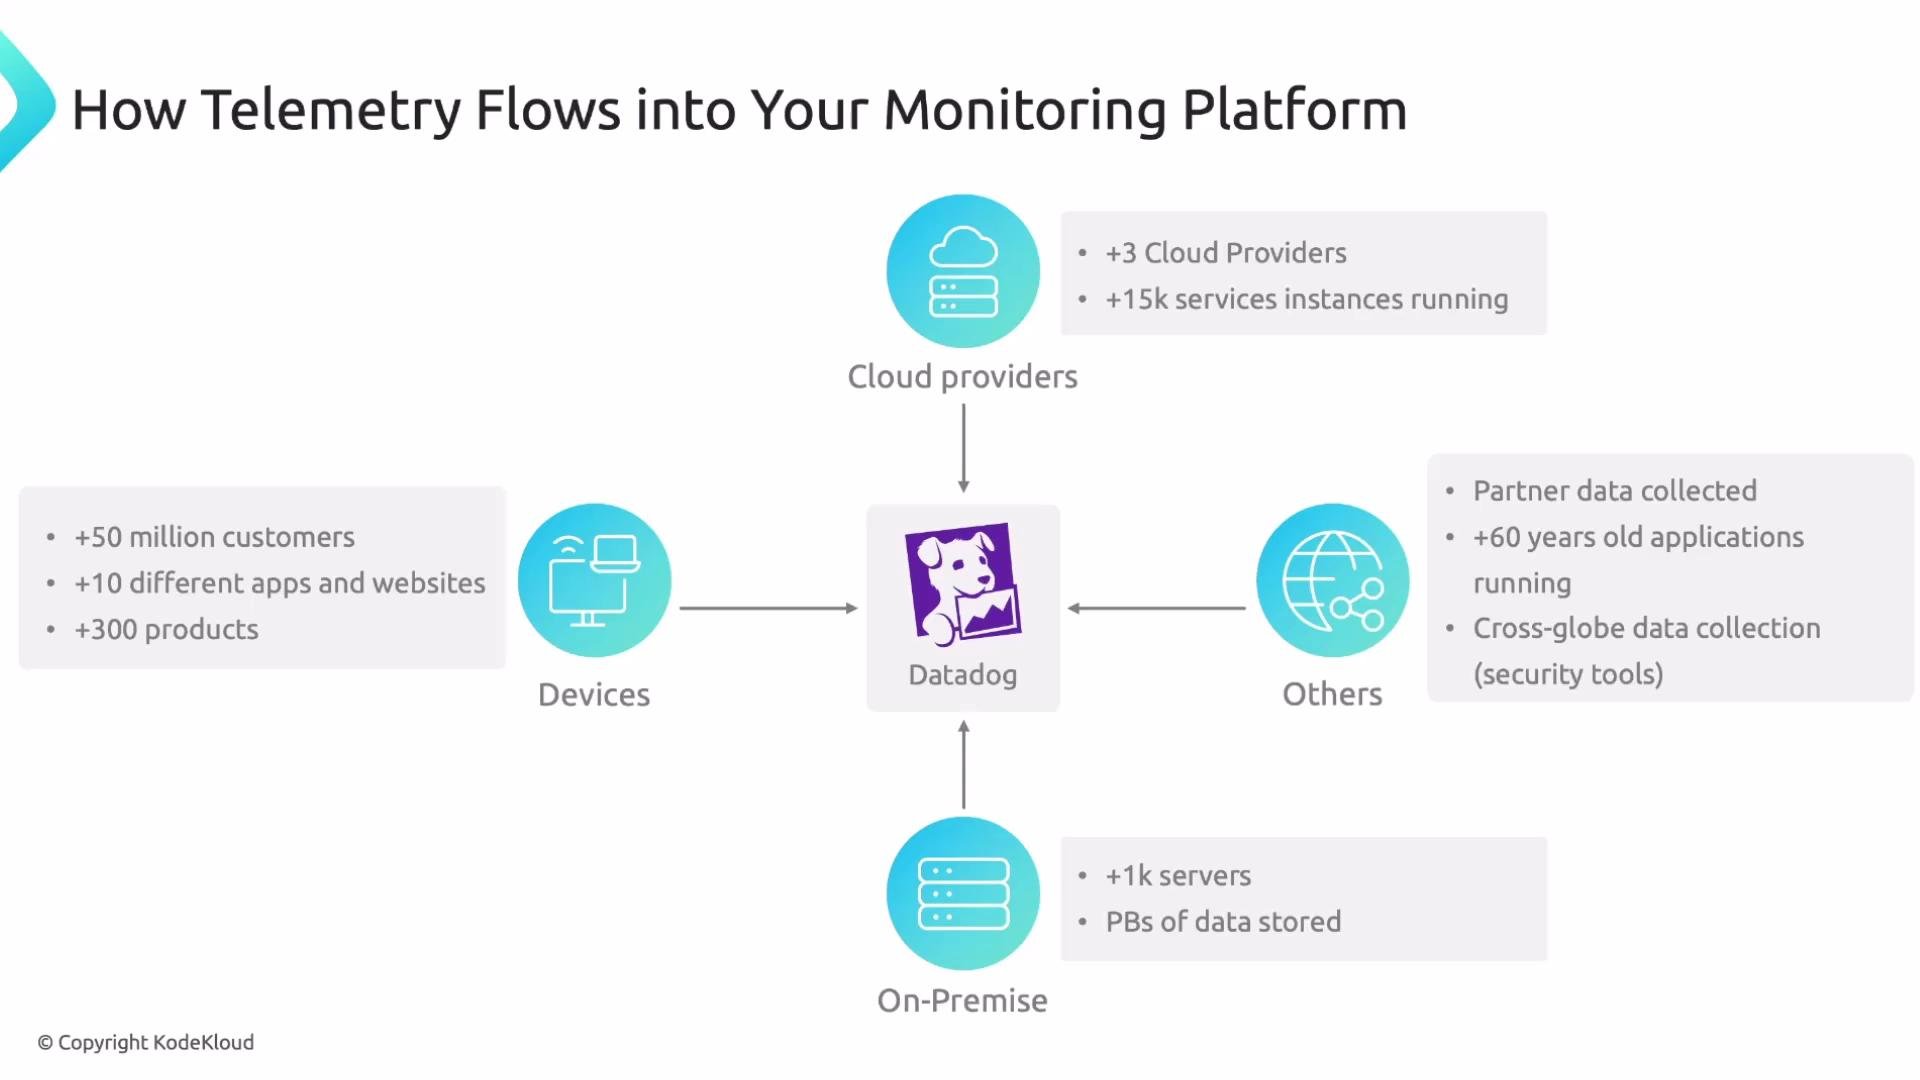
Telemetry can come from many places across your environment:
* End-user devices (browsers, mobile apps, IoT/wearables)
* Infrastructure (VMs, containers, serverless functions)
* Cloud provider services and managed platforms
* On-premises servers and legacy systems
* Third-party integrations and partner data feeds
* Custom instrumentation in business-critical services
Thinking in terms of a monitoring-first architecture helps you decide what to collect and where:
| Architecture layer | Role | Where to collect telemetry |
| -------------------- | ----------------------------------------------: | ----------------------------------------------------- |
| Entry layer | Ingress and edge (API gateways, load balancers) | Request/edge logs, synthetic monitoring, edge metrics |
| Business logic layer | Application services and business rules | Traces, service metrics, application logs |
| Data / storage layer | Databases and storage systems | DB query metrics, I/O metrics, audit logs |
This subdivision helps implement controls, apply security boundaries, and determine optimal collection points.
In modern systems, data sources emit a large and continuous volume of telemetry. That volume can quickly become costly and noisy if not managed intentionally.
 ## Designing a scalable ingestion strategy
Because telemetry volume grows rapidly, treat ingestion as a design decision rather than an afterthought. Use the following practices to keep cost and noise under control while preserving observability value.
| Area | Recommended practice | Why it matters |
| -------------------- | ------------------------------------------------------------: | --------------------------------------------------------------- |
| Source selection | Enable only the integrations and agents you need | Reduces noise and ingestion costs |
| Sampling & filtering | Sample high-volume traces; filter or redact verbose logs | Keeps signal-to-noise ratio high and controls storage |
| Tagging & metadata | Apply consistent tags and service names | Enables efficient querying and reduces cardinality issues |
| Rate limits & quotas | Configure agent-side and collector-side limits | Prevents accidental spikes from overwhelming ingestion |
| Retention & tiers | Use short-term high-resolution + long-term aggregated storage | Balances cost with the ability to investigate historical issues |
Practical checklist:
* Start with availability, performance, and error telemetry for critical services.
* Validate the business value before increasing retention or instrumenting additional sources.
* Apply consistent naming conventions and tags across services.
* Set log sampling rules and trace sampling rates per service.
* Monitor ingestion metrics (bytes ingested, events/sec, cardinality) for anomalies.
When designing ingestion, prioritize telemetry that answers your key questions: Is the service available? Is performance within SLO? Are errors rising? Begin with essential telemetry, validate its value, then expand integrations and retention as needed.
High-cardinality tags and unfiltered verbose logs are common causes of unexpected costs and query slowness. Apply tag governance and log-reduction rules early to avoid runaway ingestion bills.
## Tips for implementation
* Use official Datadog agents and integrations where possible to simplify collection and security.
* For cloud-native environments, instrument at the service level (APM + traces) and rely on exporters for metrics (e.g., Prometheus exporters).
* Implement structured logging to make logs searchable and to enable efficient parsing and indexing.
* Leverage telemetry sampling: adjust trace sampling dynamically for high-traffic endpoints.
* Monitor your observability platform's own telemetry (ingestion rates, costs, quota usage) and set alerts on unexpected changes.
Further reading and references:
* Datadog Observability: [https://docs.datadoghq.com/](https://docs.datadoghq.com/)
* Observability best practices: [https://www.datadoghq.com/solutions/observability/](https://www.datadoghq.com/solutions/observability/)
That's it for this lesson. Apply these principles when designing your telemetry ingestion pipeline to keep your observability effective and sustainable.
## Designing a scalable ingestion strategy
Because telemetry volume grows rapidly, treat ingestion as a design decision rather than an afterthought. Use the following practices to keep cost and noise under control while preserving observability value.
| Area | Recommended practice | Why it matters |
| -------------------- | ------------------------------------------------------------: | --------------------------------------------------------------- |
| Source selection | Enable only the integrations and agents you need | Reduces noise and ingestion costs |
| Sampling & filtering | Sample high-volume traces; filter or redact verbose logs | Keeps signal-to-noise ratio high and controls storage |
| Tagging & metadata | Apply consistent tags and service names | Enables efficient querying and reduces cardinality issues |
| Rate limits & quotas | Configure agent-side and collector-side limits | Prevents accidental spikes from overwhelming ingestion |
| Retention & tiers | Use short-term high-resolution + long-term aggregated storage | Balances cost with the ability to investigate historical issues |
Practical checklist:
* Start with availability, performance, and error telemetry for critical services.
* Validate the business value before increasing retention or instrumenting additional sources.
* Apply consistent naming conventions and tags across services.
* Set log sampling rules and trace sampling rates per service.
* Monitor ingestion metrics (bytes ingested, events/sec, cardinality) for anomalies.
When designing ingestion, prioritize telemetry that answers your key questions: Is the service available? Is performance within SLO? Are errors rising? Begin with essential telemetry, validate its value, then expand integrations and retention as needed.
High-cardinality tags and unfiltered verbose logs are common causes of unexpected costs and query slowness. Apply tag governance and log-reduction rules early to avoid runaway ingestion bills.
## Tips for implementation
* Use official Datadog agents and integrations where possible to simplify collection and security.
* For cloud-native environments, instrument at the service level (APM + traces) and rely on exporters for metrics (e.g., Prometheus exporters).
* Implement structured logging to make logs searchable and to enable efficient parsing and indexing.
* Leverage telemetry sampling: adjust trace sampling dynamically for high-traffic endpoints.
* Monitor your observability platform's own telemetry (ingestion rates, costs, quota usage) and set alerts on unexpected changes.
Further reading and references:
* Datadog Observability: [https://docs.datadoghq.com/](https://docs.datadoghq.com/)
* Observability best practices: [https://www.datadoghq.com/solutions/observability/](https://www.datadoghq.com/solutions/observability/)
That's it for this lesson. Apply these principles when designing your telemetry ingestion pipeline to keep your observability effective and sustainable.