> ## Documentation Index
> Fetch the complete documentation index at: https://notes.kodekloud.com/llms.txt
> Use this file to discover all available pages before exploring further.
# Alerts
> Guidance on migrating, testing, and managing monitoring alerts to ensure telemetry availability, reduce noise, and validate notifications when moving to Datadog or replacing legacy alerting systems.
Alerts make monitoring manageable by continuously evaluating telemetry (metrics, logs, traces) and notifying the right teams when predefined conditions are met. Proper alerting reduces mean time to detection and enables controlled responses instead of frantic firefights.
What alerts do, in short:
* Continuously evaluate telemetry.
* Fire when a configured condition or threshold is met.
* Deliver notifications to your teams or channels so they can take action.
A concrete example
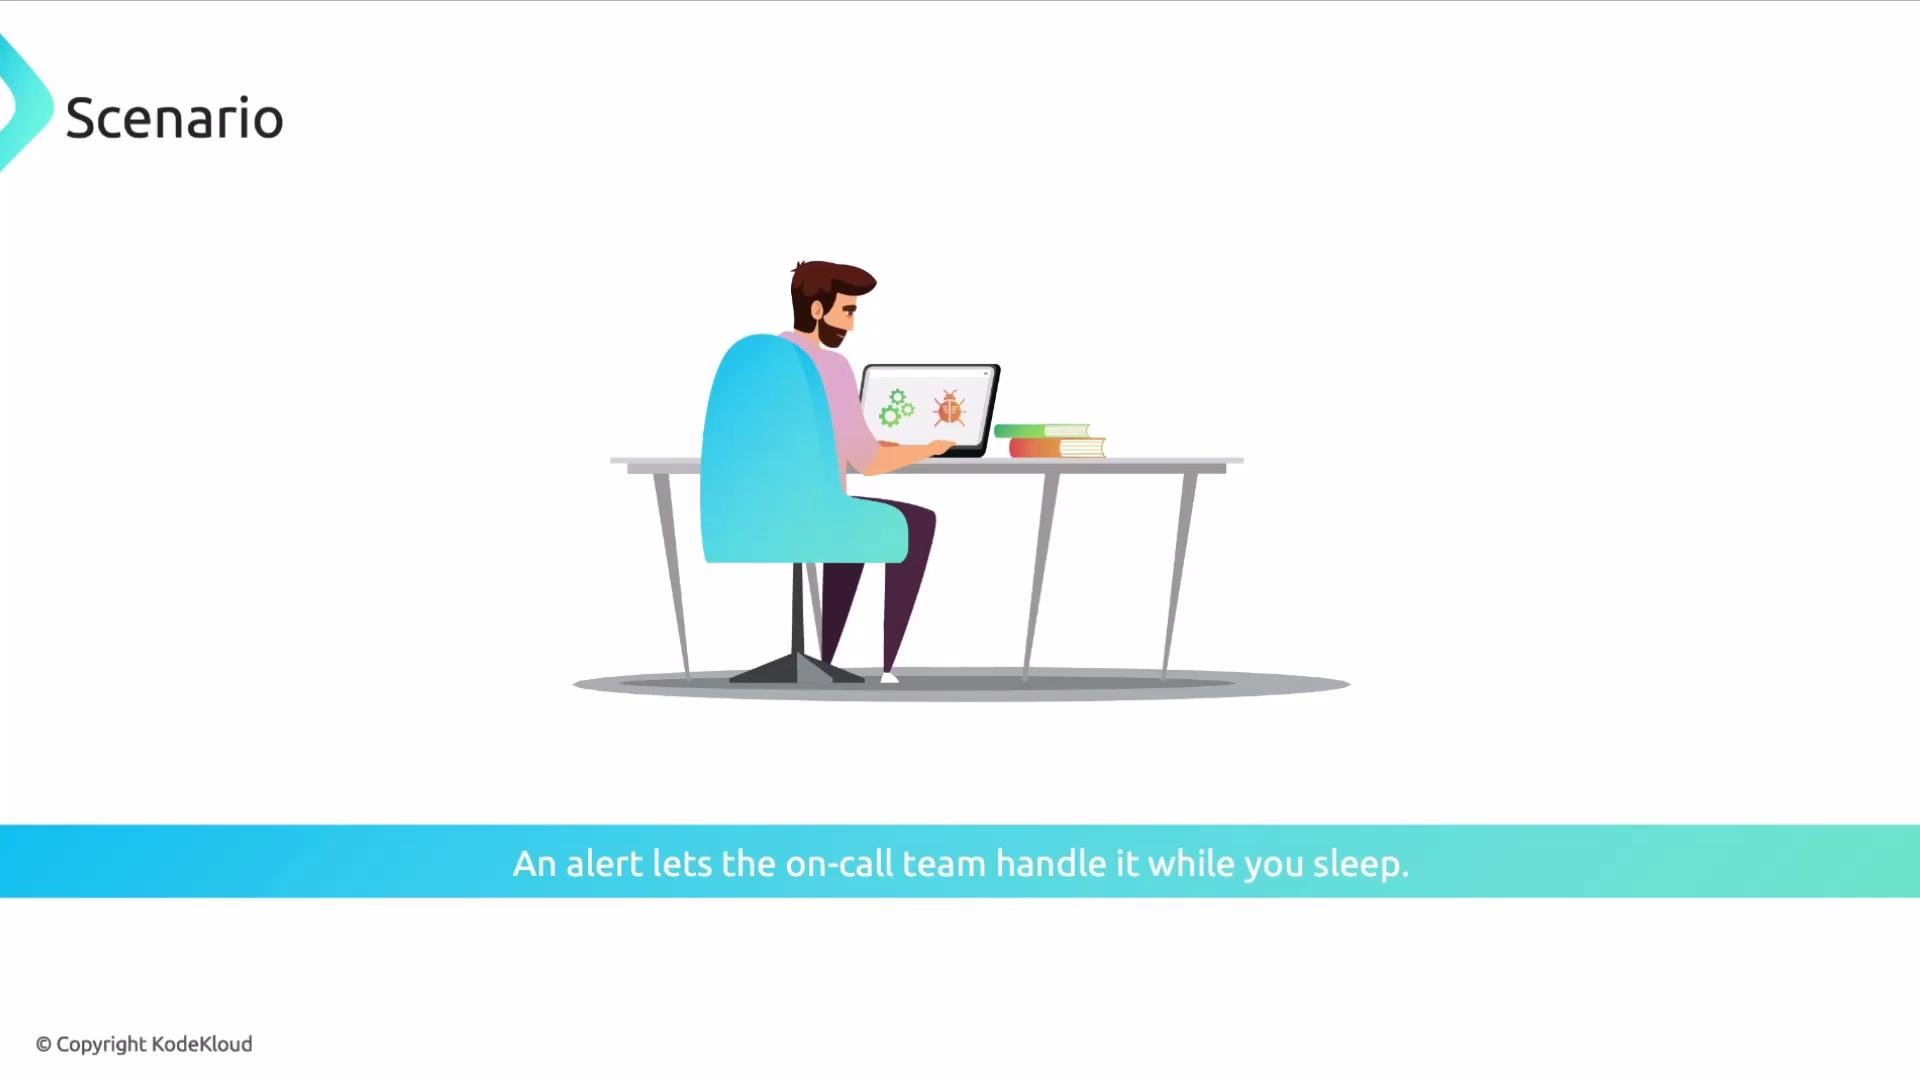
Your company processes payroll for multiple businesses. Payments execute at 1 a.m. on the last day of every month. If payroll jobs fail or are delayed, employees will likely contact support en masse. Without proactive alerting, you’ll wake up to dozens (or hundreds) of complaints and have to scramble to diagnose and remediate.
An alert that detects failed or delayed payroll jobs would notify the on-call team immediately, enabling a controlled investigation and remediation before employee outreach escalates.
 Use alerts to catch performance regressions early
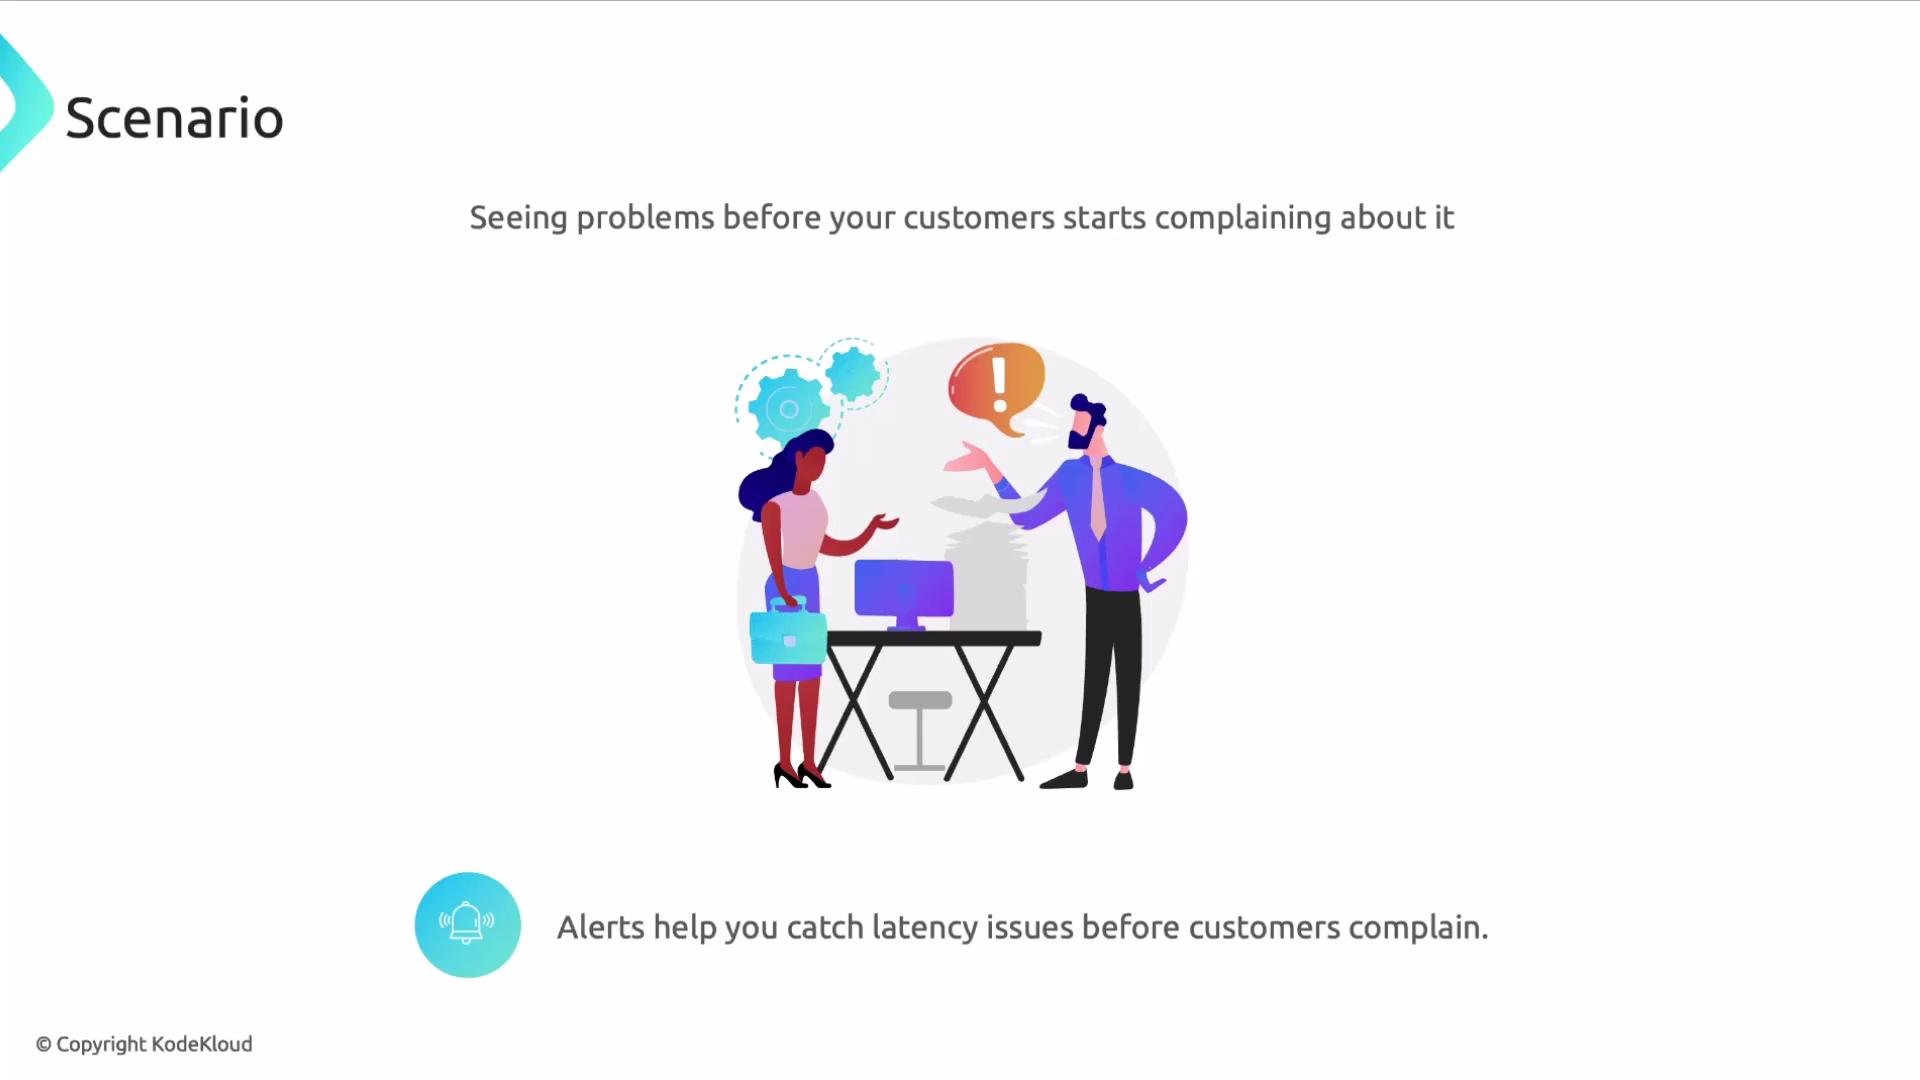
Alerts aren’t only for failures. Track application latency, error rates, throughput, or resource saturation so you can detect regressions before customers notice. For example, a latency alert that triggers when p95 response time increases beyond a threshold lets you investigate before SLA breaches occur.
Use alerts to catch performance regressions early
Alerts aren’t only for failures. Track application latency, error rates, throughput, or resource saturation so you can detect regressions before customers notice. For example, a latency alert that triggers when p95 response time increases beyond a threshold lets you investigate before SLA breaches occur.
 Alert migration: a recommended sequence
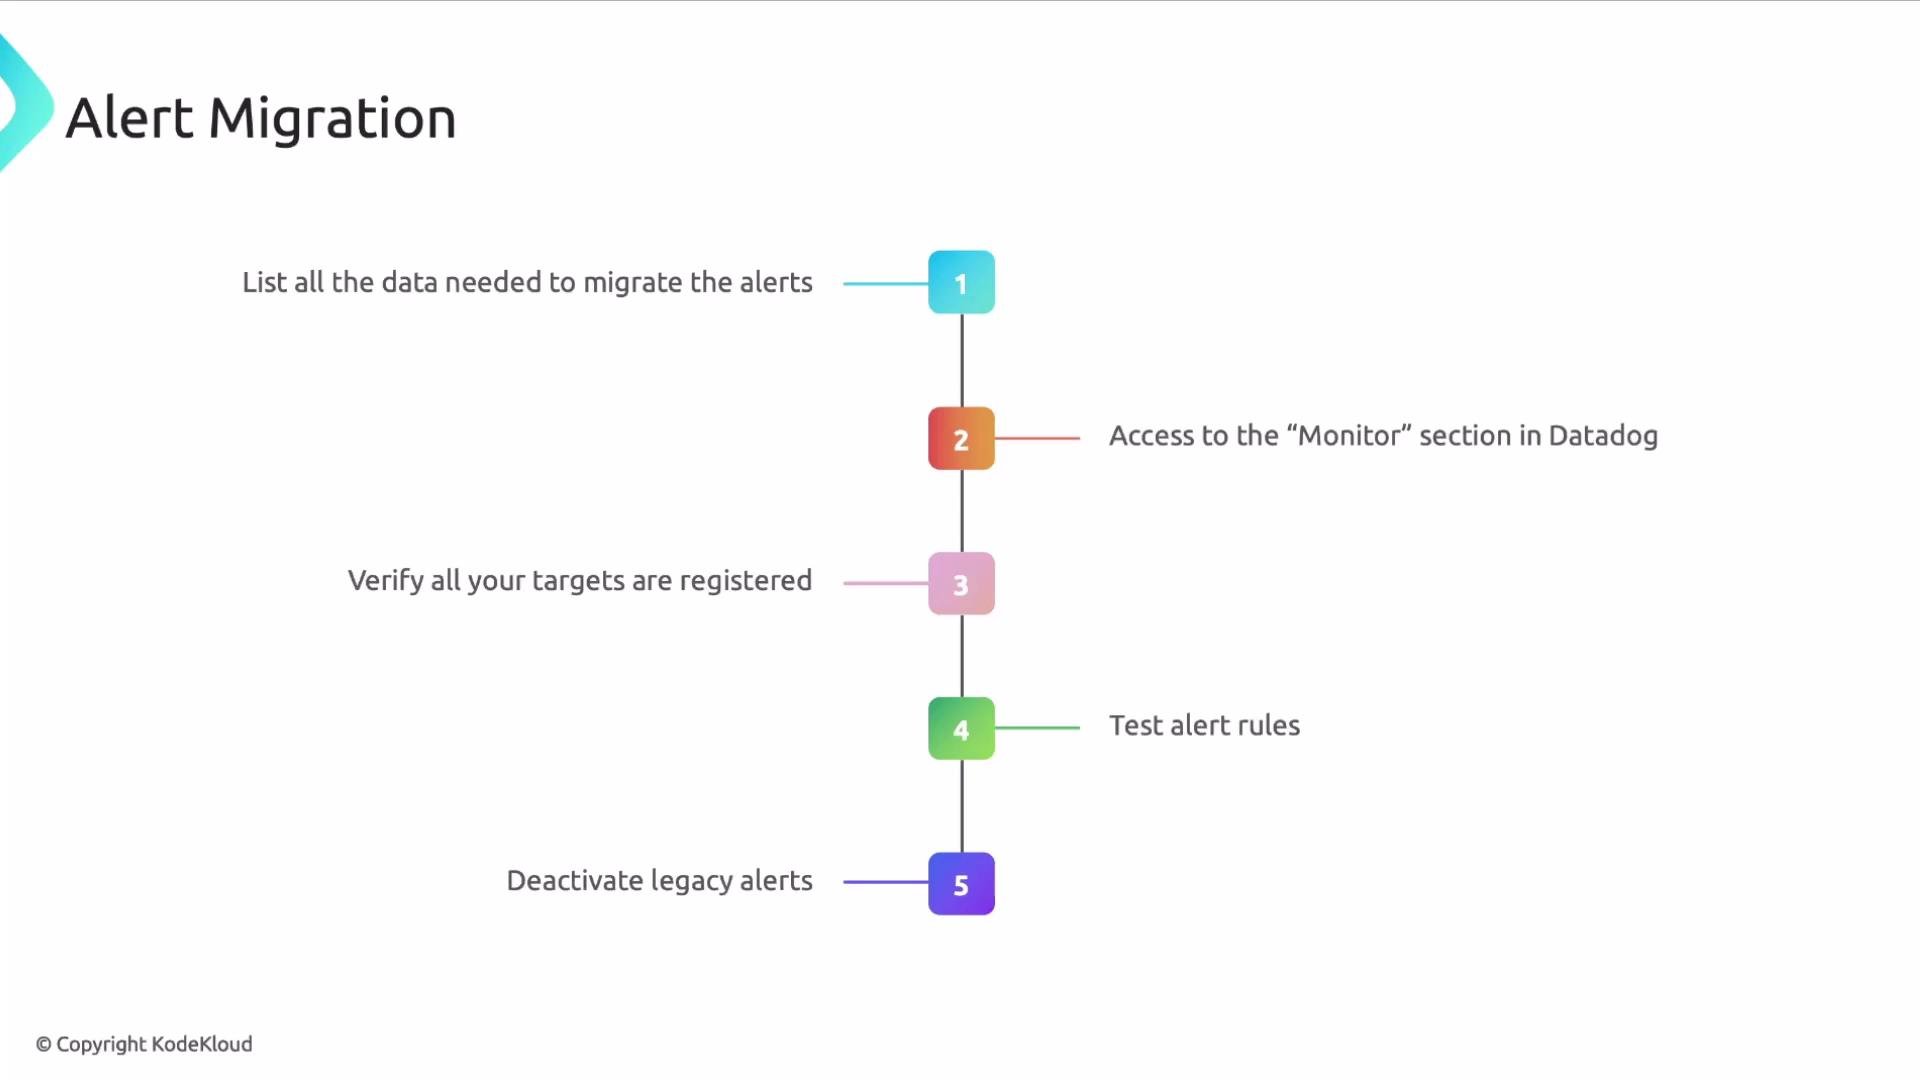
When migrating alerts into a new monitoring system (for example, migrating to Datadog), follow a repeatable, low-risk sequence:
1. Ensure required data is available
* Confirm collection of metrics, logs, and traces for the services you want to monitor.
* Request any necessary changes to the Datadog Agent configuration from your DevOps/infra team: [https://docs.datadoghq.com/agent/](https://docs.datadoghq.com/agent/)
2. Confirm access to the monitoring console
* Verify your team has permissions to create and manage monitors in Datadog: [https://docs.datadoghq.com/monitors/](https://docs.datadoghq.com/monitors/)
3. Validate notification targets
* Ensure recipients (email groups, PagerDuty services, Slack channels, Microsoft Teams, etc.) are configured and reachable.
4. Test alerts
* Simulate conditions or temporarily lower thresholds to confirm monitors fire and notifications are delivered.
5. Deactivate legacy alerts
* After Datadog monitors are validated in production, disable the old alerts in Grafana, Alertmanager, Dynatrace, or other tools you’re replacing.
Alert migration: a recommended sequence
When migrating alerts into a new monitoring system (for example, migrating to Datadog), follow a repeatable, low-risk sequence:
1. Ensure required data is available
* Confirm collection of metrics, logs, and traces for the services you want to monitor.
* Request any necessary changes to the Datadog Agent configuration from your DevOps/infra team: [https://docs.datadoghq.com/agent/](https://docs.datadoghq.com/agent/)
2. Confirm access to the monitoring console
* Verify your team has permissions to create and manage monitors in Datadog: [https://docs.datadoghq.com/monitors/](https://docs.datadoghq.com/monitors/)
3. Validate notification targets
* Ensure recipients (email groups, PagerDuty services, Slack channels, Microsoft Teams, etc.) are configured and reachable.
4. Test alerts
* Simulate conditions or temporarily lower thresholds to confirm monitors fire and notifications are delivered.
5. Deactivate legacy alerts
* After Datadog monitors are validated in production, disable the old alerts in Grafana, Alertmanager, Dynatrace, or other tools you’re replacing.
 Migration checklist (summary)
| Step | Purpose | Example / Link |
| ------------------------ | ------------------------------------------------ | ---------------------------------------------------------------------------------------------- |
| Ensure telemetry | Make sure metrics/logs/traces exist for services | Datadog Agent docs: [https://docs.datadoghq.com/agent/](https://docs.datadoghq.com/agent/) |
| Console access | Grant permissions to create/manage monitors | Datadog Monitors: [https://docs.datadoghq.com/monitors/](https://docs.datadoghq.com/monitors/) |
| Notification targets | Validate recipients and routing | PagerDuty, Slack, Teams, email groups |
| Test alerts | Verify firing and delivery | Simulate incidents or lower thresholds |
| Deactivate legacy alerts | Avoid duplicate notifications once validated | Grafana, Alertmanager, Dynatrace |
Common alert notification integrations
* Datadog mobile app
* Jira
* PagerDuty
* Slack
* Microsoft Teams
* ServiceNow
Best practices and tips
Tune thresholds and use multi-condition monitors to reduce noise. Prefer cloud-native integrations (PagerDuty, Slack) for reliable on-call routing, and run repeatable tests for each alert before decommissioning legacy monitors.
When you disable legacy alerts, keep them active until you have validated the new monitors in production and verified notifications reach the intended recipients. Accidentally deactivating early can blind you to outages.
When disabling legacy alerts, keep them enabled until Datadog monitors are fully validated in production. Accidentally deactivating alerts too early can leave you blind to outages.
Further reading and references
* Datadog Agent: [https://docs.datadoghq.com/agent/](https://docs.datadoghq.com/agent/)
* Datadog Monitors: [https://docs.datadoghq.com/monitors/](https://docs.datadoghq.com/monitors/)
* Grafana: [https://grafana.com/](https://grafana.com/)
* Prometheus Alertmanager: [https://prometheus.io/docs/alerting/latest/alertmanager/](https://prometheus.io/docs/alerting/latest/alertmanager/)
* Dynatrace: [https://www.dynatrace.com/](https://www.dynatrace.com/)
* PagerDuty: [https://www.pagerduty.com/](https://www.pagerduty.com/)
* Slack: [https://slack.com/](https://slack.com/)
* Microsoft Teams: [https://www.microsoft.com/en-us/microsoft-teams/group-chat-software](https://www.microsoft.com/en-us/microsoft-teams/group-chat-software)
* ServiceNow: [https://www.servicenow.com/](https://www.servicenow.com/)
That’s it for this lesson—use the migration checklist, validate thoroughly, and iterate to keep alerting effective and actionable.
Migration checklist (summary)
| Step | Purpose | Example / Link |
| ------------------------ | ------------------------------------------------ | ---------------------------------------------------------------------------------------------- |
| Ensure telemetry | Make sure metrics/logs/traces exist for services | Datadog Agent docs: [https://docs.datadoghq.com/agent/](https://docs.datadoghq.com/agent/) |
| Console access | Grant permissions to create/manage monitors | Datadog Monitors: [https://docs.datadoghq.com/monitors/](https://docs.datadoghq.com/monitors/) |
| Notification targets | Validate recipients and routing | PagerDuty, Slack, Teams, email groups |
| Test alerts | Verify firing and delivery | Simulate incidents or lower thresholds |
| Deactivate legacy alerts | Avoid duplicate notifications once validated | Grafana, Alertmanager, Dynatrace |
Common alert notification integrations
* Datadog mobile app
* Jira
* PagerDuty
* Slack
* Microsoft Teams
* ServiceNow
Best practices and tips
Tune thresholds and use multi-condition monitors to reduce noise. Prefer cloud-native integrations (PagerDuty, Slack) for reliable on-call routing, and run repeatable tests for each alert before decommissioning legacy monitors.
When you disable legacy alerts, keep them active until you have validated the new monitors in production and verified notifications reach the intended recipients. Accidentally deactivating early can blind you to outages.
When disabling legacy alerts, keep them enabled until Datadog monitors are fully validated in production. Accidentally deactivating alerts too early can leave you blind to outages.
Further reading and references
* Datadog Agent: [https://docs.datadoghq.com/agent/](https://docs.datadoghq.com/agent/)
* Datadog Monitors: [https://docs.datadoghq.com/monitors/](https://docs.datadoghq.com/monitors/)
* Grafana: [https://grafana.com/](https://grafana.com/)
* Prometheus Alertmanager: [https://prometheus.io/docs/alerting/latest/alertmanager/](https://prometheus.io/docs/alerting/latest/alertmanager/)
* Dynatrace: [https://www.dynatrace.com/](https://www.dynatrace.com/)
* PagerDuty: [https://www.pagerduty.com/](https://www.pagerduty.com/)
* Slack: [https://slack.com/](https://slack.com/)
* Microsoft Teams: [https://www.microsoft.com/en-us/microsoft-teams/group-chat-software](https://www.microsoft.com/en-us/microsoft-teams/group-chat-software)
* ServiceNow: [https://www.servicenow.com/](https://www.servicenow.com/)
That’s it for this lesson—use the migration checklist, validate thoroughly, and iterate to keep alerting effective and actionable.