> ## Documentation Index
> Fetch the complete documentation index at: https://notes.kodekloud.com/llms.txt
> Use this file to discover all available pages before exploring further.
# Course Introduction
> Hands-on course teaching observability fundamentals and step by step migration from legacy monitoring to Datadog, including planning, architecture, execution and post-migration validation
Welcome to Migrating to Datadog — a practical, step-by-step lesson that teaches observability fundamentals and how to migrate from legacy monitoring solutions to Datadog. This course is structured to guide you from core concepts through migration planning, execution, and post-migration validation.
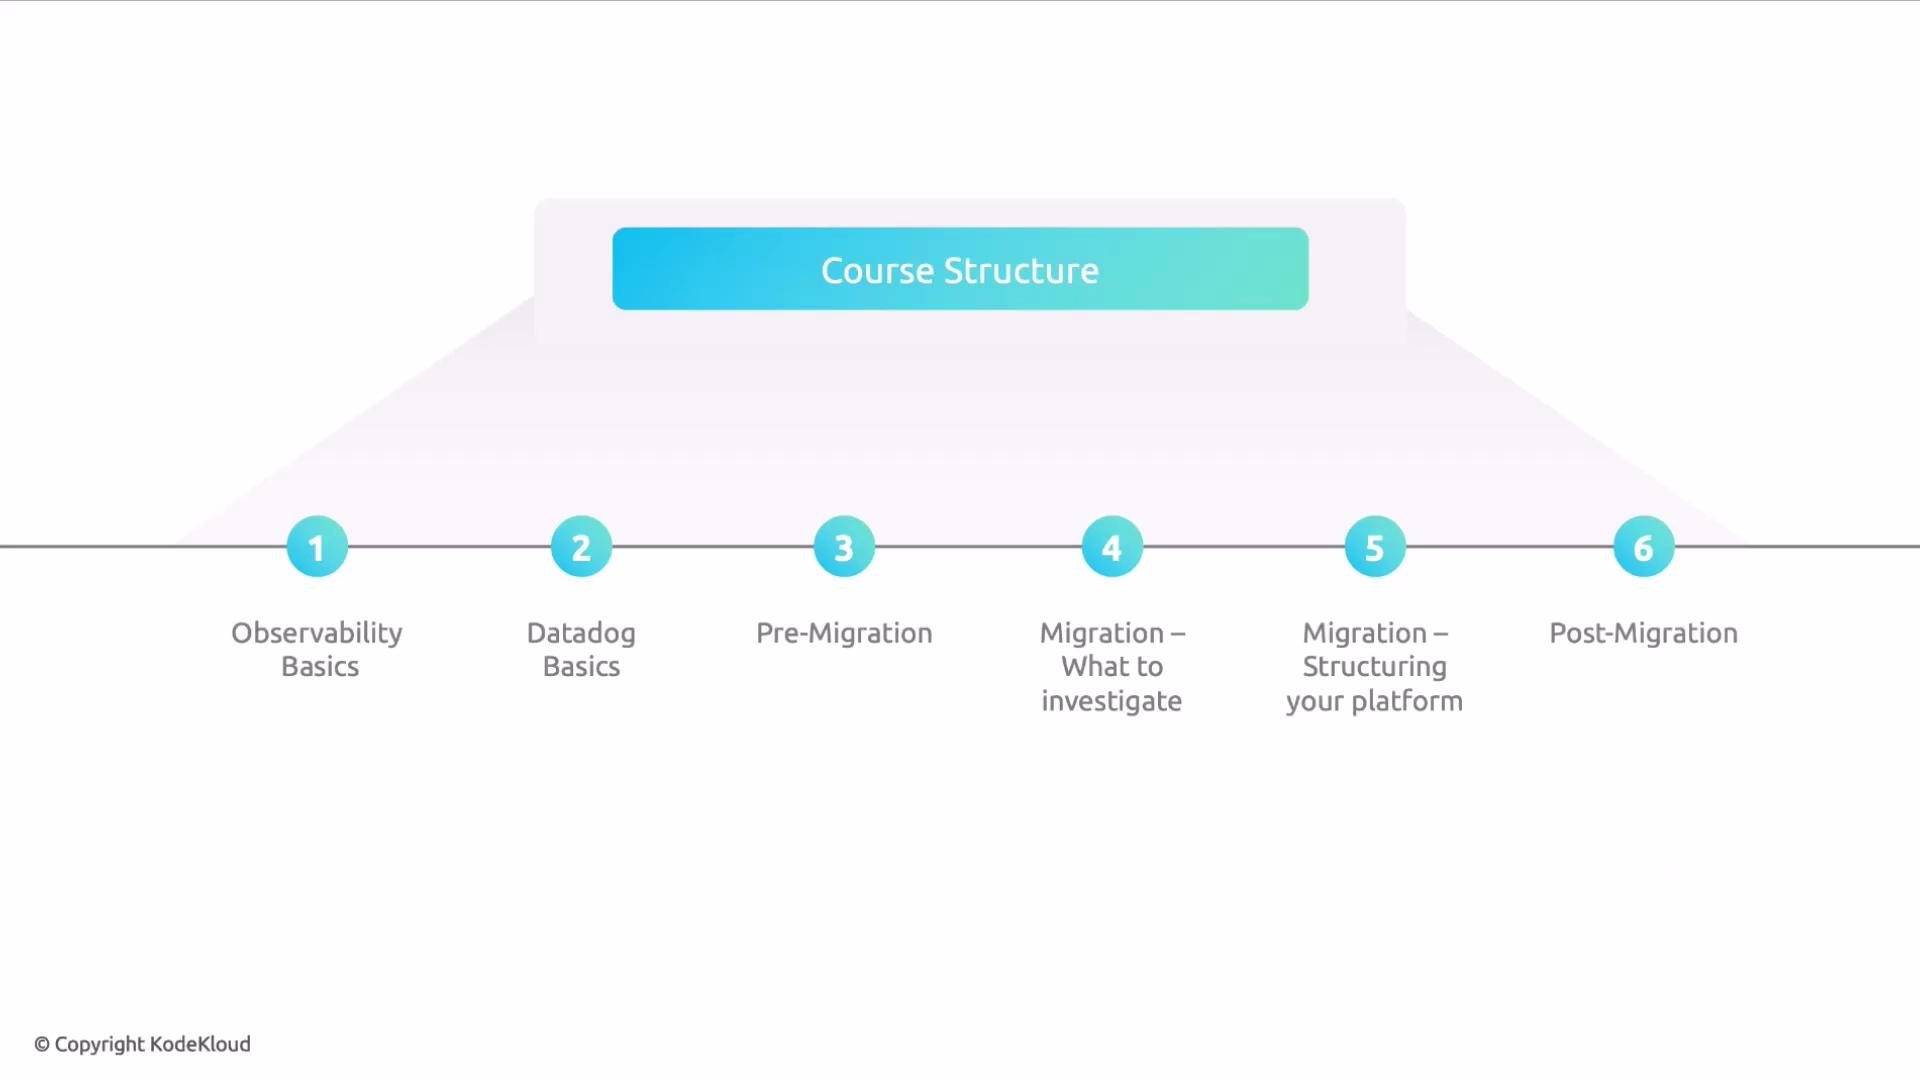
What this course covers (six sequential modules):
1. Observability Basics — What observability is and why it matters.
2. Datadog Basics — An introduction to the Datadog observability platform.
3. Pre-Migration — Considerations and preparations before migrating from a legacy observability solution.
4. Migration — What to investigate during the migration process.
5. Migration: Structuring Your Observability Platform — Architectural guidance while you migrate.
6. Post-Migration — Tasks and validations to perform after migration completes.
 After you complete the migration, you’ll still need to validate, optimize, and operationalize the new observability stack. This lesson covers that final phase and provides practical checks to ensure your monitoring, tracing, logging, and detection continue to meet operational needs.
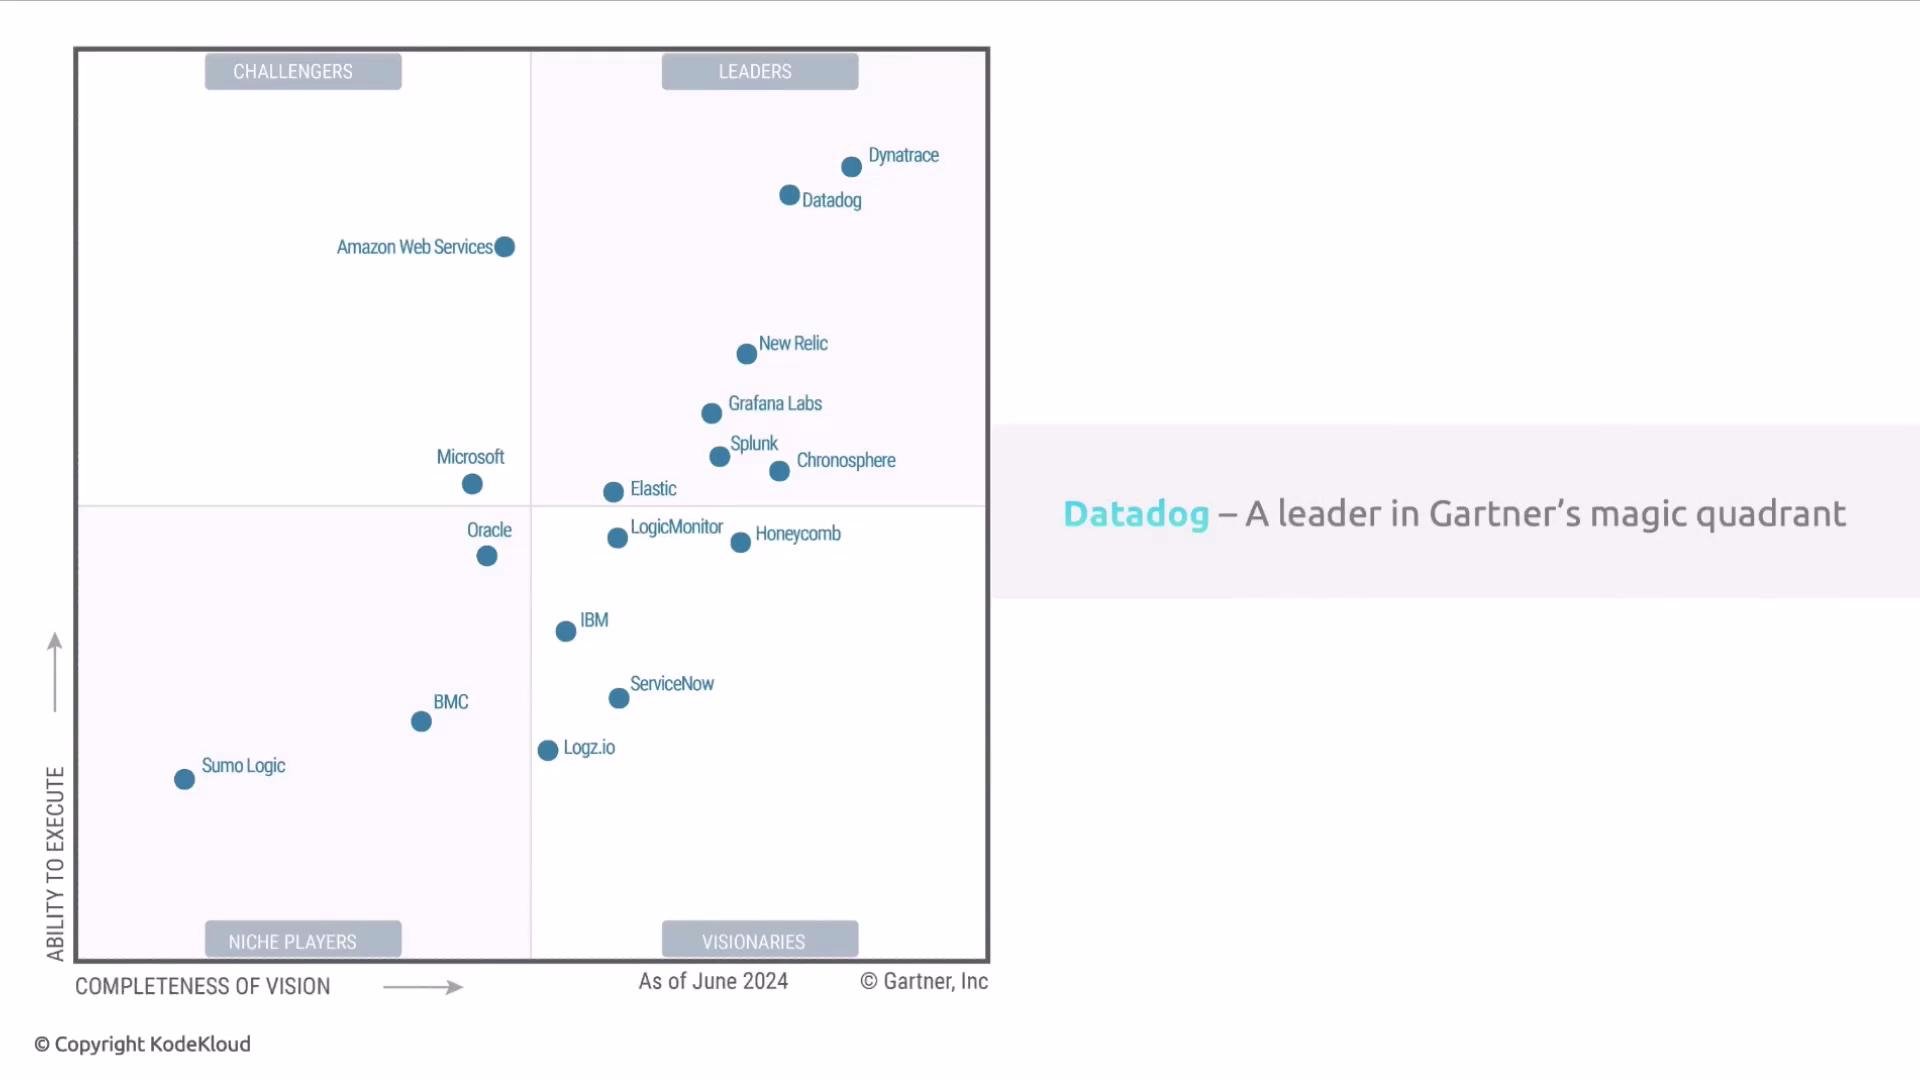
Why follow this lesson? Datadog is widely adopted and consistently ranked among leaders in observability platforms.
After you complete the migration, you’ll still need to validate, optimize, and operationalize the new observability stack. This lesson covers that final phase and provides practical checks to ensure your monitoring, tracing, logging, and detection continue to meet operational needs.
Why follow this lesson? Datadog is widely adopted and consistently ranked among leaders in observability platforms.
 Key industry problems Datadog helps solve:
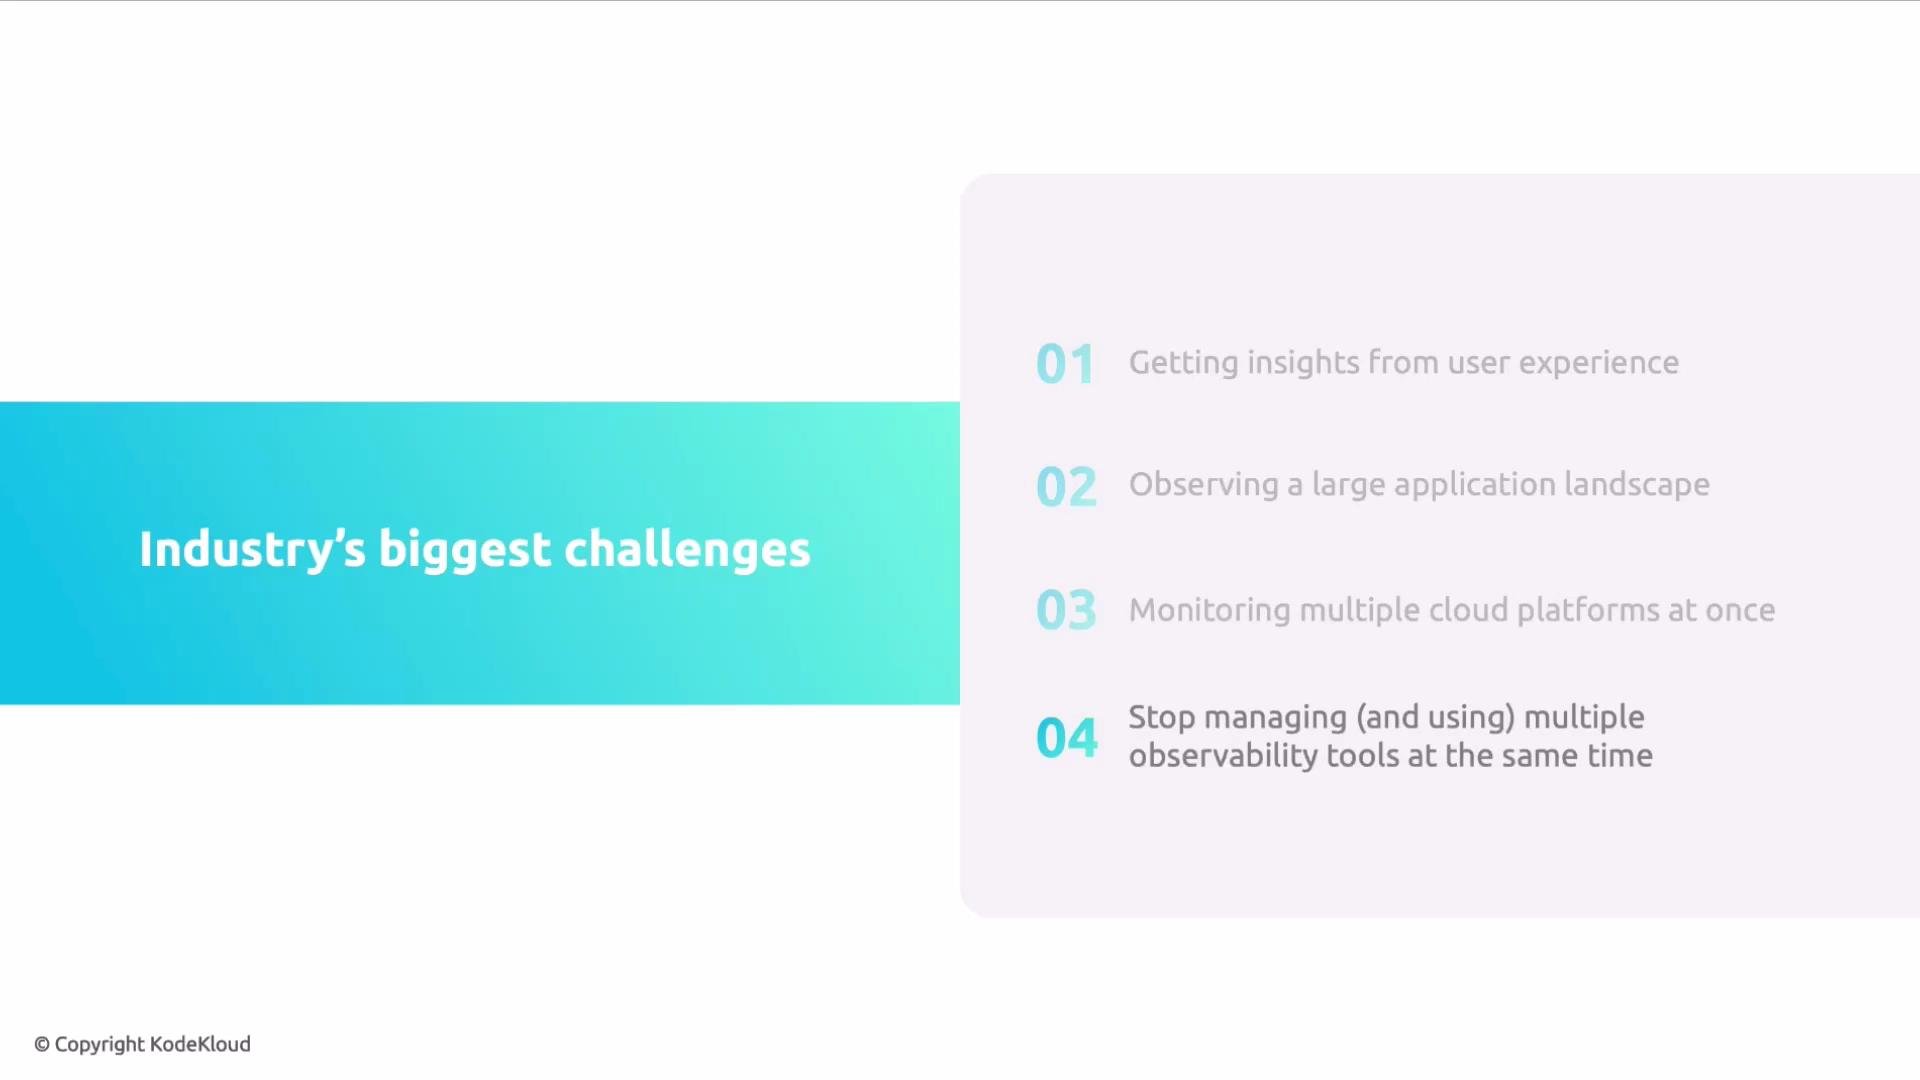 * Gaining visibility into user experience and feature adoption across front-end and back-end systems.
* Monitoring across multi-cloud and hybrid environments.
* Reducing operational overhead for deploying and upgrading monitoring stacks.
* Consolidating disparate data sources and tools to reduce fragmentation.
Datadog’s broad integration ecosystem and unified platform reduce the friction of maintaining multiple point tools (for example, stitching together solutions like Grafana Loki, Prometheus, and custom pipelines). With Datadog you can instrument and monitor everything from client-side applications to APIs, microservices, infrastructure, and databases — enabling a single-pane-of-glass view across your stack.
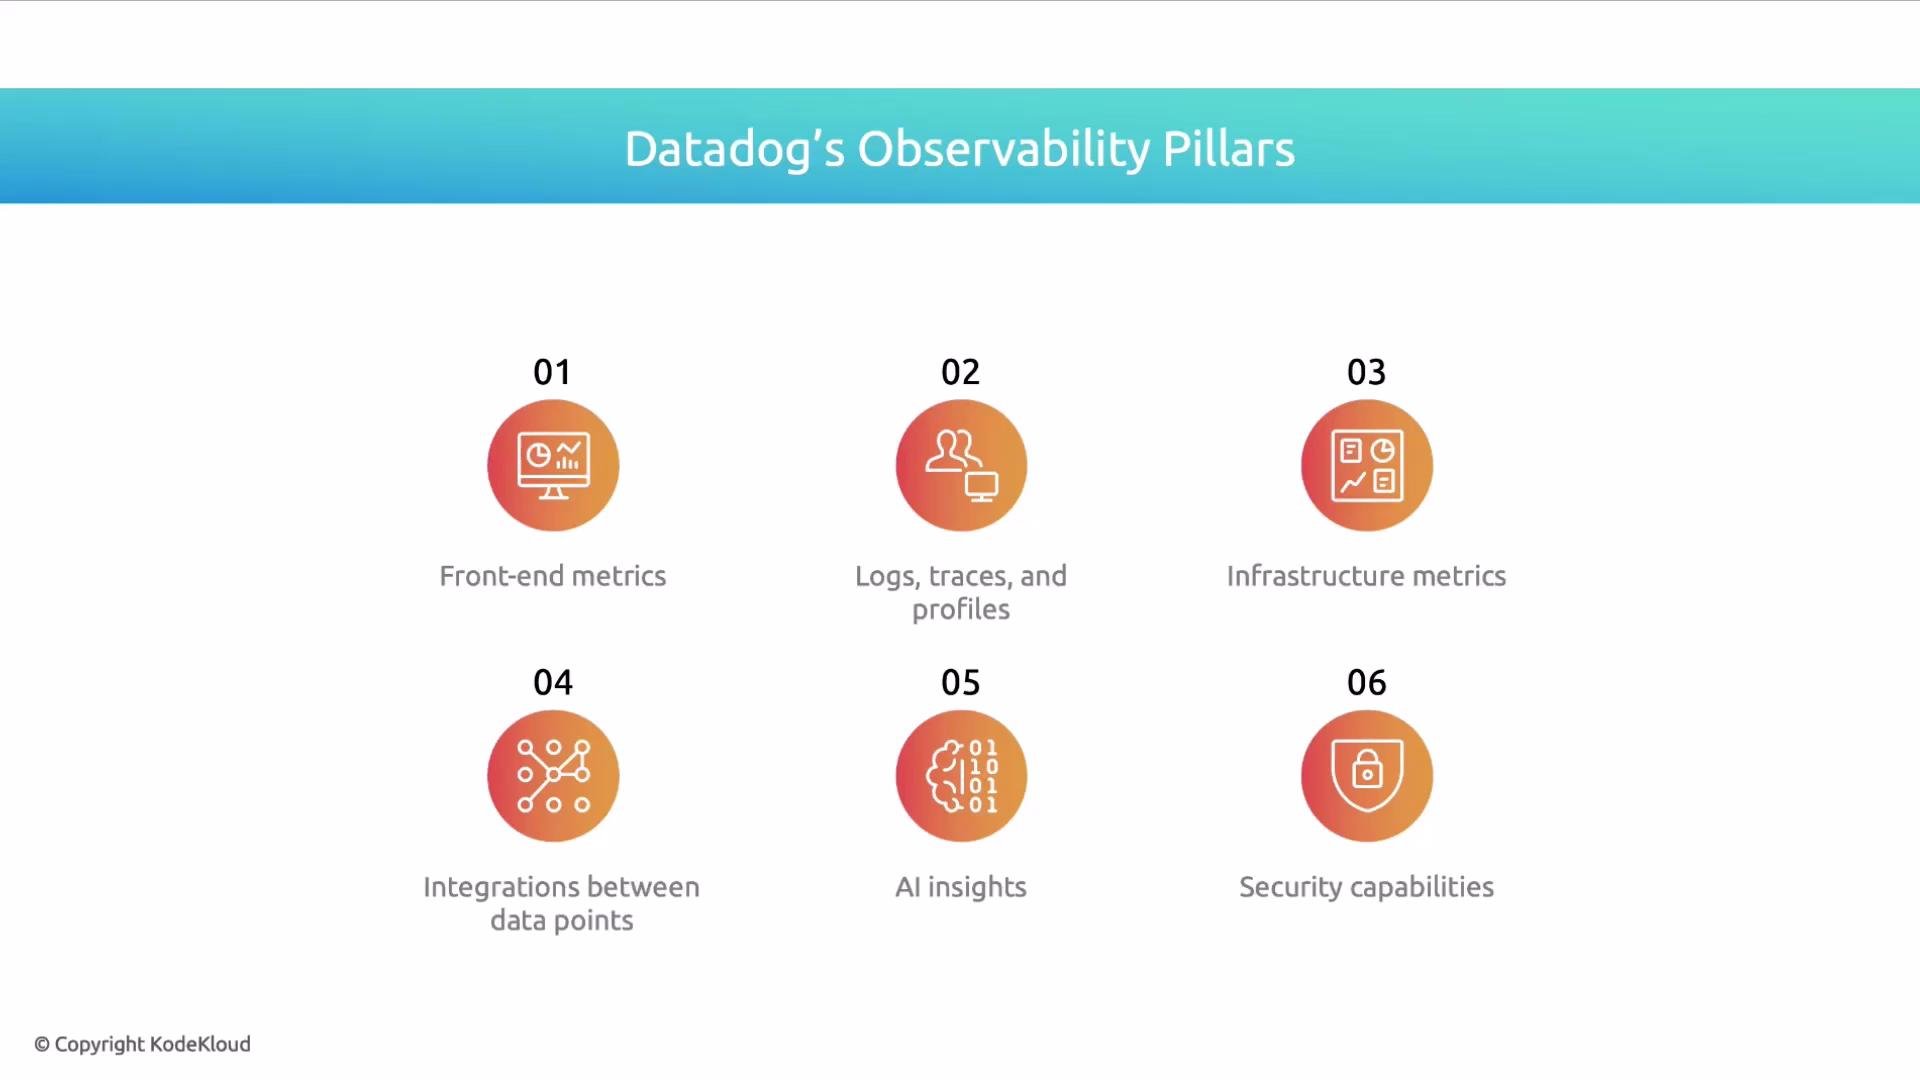
Core observability pillars covered in this course:
1. Frontend observability (client-side metrics and user experience)
2. Logs, traces, and profiles
3. Infrastructure metrics
4. Integration and correlation between data points
5. AI-driven insights and detection
6. Security capabilities
* Gaining visibility into user experience and feature adoption across front-end and back-end systems.
* Monitoring across multi-cloud and hybrid environments.
* Reducing operational overhead for deploying and upgrading monitoring stacks.
* Consolidating disparate data sources and tools to reduce fragmentation.
Datadog’s broad integration ecosystem and unified platform reduce the friction of maintaining multiple point tools (for example, stitching together solutions like Grafana Loki, Prometheus, and custom pipelines). With Datadog you can instrument and monitor everything from client-side applications to APIs, microservices, infrastructure, and databases — enabling a single-pane-of-glass view across your stack.
Core observability pillars covered in this course:
1. Frontend observability (client-side metrics and user experience)
2. Logs, traces, and profiles
3. Infrastructure metrics
4. Integration and correlation between data points
5. AI-driven insights and detection
6. Security capabilities
 To make these pillars actionable, here is a quick reference that maps each area to practical outcomes and migration focus points.
| Observability Pillar | Practical focus during migration | Typical Datadog features to adopt |
| ------------------------------ | -------------------------------------------------------------------: | --------------------------------------------------------------- |
| Frontend observability | Instrument client SDKs, monitor UX metrics and feature adoption | Real User Monitoring (RUM), Synthetic tests |
| Logs, traces, profiles | Centralize logs, enable distributed tracing and continuous profiling | Log Management, APM tracing, Continuous Profiler |
| Infrastructure metrics | Replace legacy collectors with unified agents | Datadog Agent, Metrics Explorer, Integrations |
| Data integration & correlation | Correlate logs, traces, and metrics for root cause analysis | Unified search, correlation widgets, service maps |
| AI-driven insights & detection | Configure anomaly detection and incident signals | Watchdog, Anomaly Detection, Monitors |
| Security capabilities | Integrate security telemetry and pipeline scanning | Cloud Security Posture Management, SAST/secret scanning plugins |
Datadog also provides security-focused features — like code analysis, secret scanning, and pipeline security — so teams can merge observability and security telemetry into a single operational plane.
Expected outcomes from this lesson:
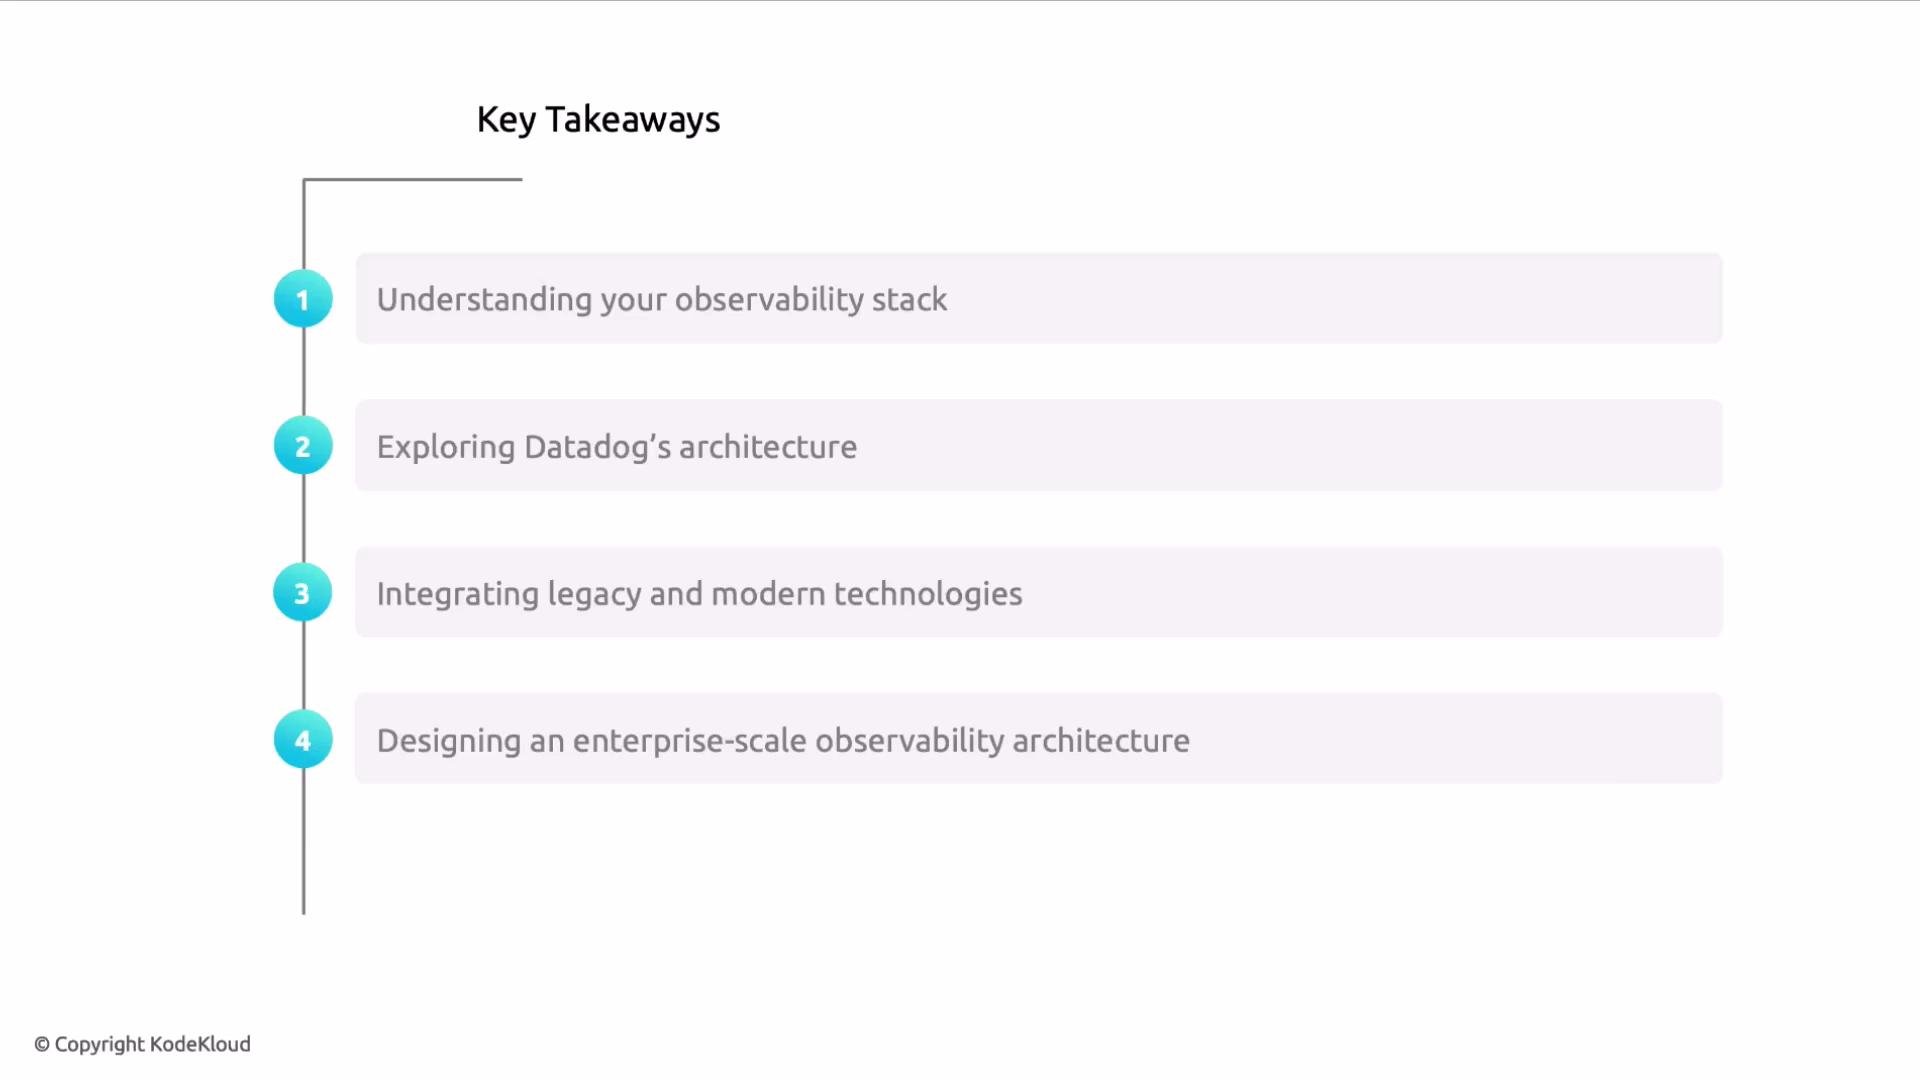
* Understand the components and trade-offs in an observability stack.
* Gain practical familiarity with Datadog’s architecture and core components for deployment and maintenance.
* Learn patterns for integrating legacy and modern systems so no components go unmonitored.
* Design an enterprise-scale observability architecture that supports reliability and incident response.
* Build confidence in why observability matters and how to plan a migration.
To make these pillars actionable, here is a quick reference that maps each area to practical outcomes and migration focus points.
| Observability Pillar | Practical focus during migration | Typical Datadog features to adopt |
| ------------------------------ | -------------------------------------------------------------------: | --------------------------------------------------------------- |
| Frontend observability | Instrument client SDKs, monitor UX metrics and feature adoption | Real User Monitoring (RUM), Synthetic tests |
| Logs, traces, profiles | Centralize logs, enable distributed tracing and continuous profiling | Log Management, APM tracing, Continuous Profiler |
| Infrastructure metrics | Replace legacy collectors with unified agents | Datadog Agent, Metrics Explorer, Integrations |
| Data integration & correlation | Correlate logs, traces, and metrics for root cause analysis | Unified search, correlation widgets, service maps |
| AI-driven insights & detection | Configure anomaly detection and incident signals | Watchdog, Anomaly Detection, Monitors |
| Security capabilities | Integrate security telemetry and pipeline scanning | Cloud Security Posture Management, SAST/secret scanning plugins |
Datadog also provides security-focused features — like code analysis, secret scanning, and pipeline security — so teams can merge observability and security telemetry into a single operational plane.
Expected outcomes from this lesson:
* Understand the components and trade-offs in an observability stack.
* Gain practical familiarity with Datadog’s architecture and core components for deployment and maintenance.
* Learn patterns for integrating legacy and modern systems so no components go unmonitored.
* Design an enterprise-scale observability architecture that supports reliability and incident response.
* Build confidence in why observability matters and how to plan a migration.
 This lesson emphasizes practical, migration-oriented guidance: prepare your environment, apply incremental changes, and validate outcomes so you can migrate reliably with minimal disruption.
By the end of this module you will be prepared to plan and execute a migration to Datadog — from discovery and planning through implementation and post-migration validation.
Links and references
* [Datadog Documentation](https://docs.datadoghq.com/)
* [Grafana Loki (example alternative)](https://learn.kodekloud.com/user/courses/grafana-loki)
* [Prometheus Certified Associate (PCA) prep (example alternative)](https://learn.kodekloud.com/user/courses/prometheus-certified-associate-pca)
This lesson emphasizes practical, migration-oriented guidance: prepare your environment, apply incremental changes, and validate outcomes so you can migrate reliably with minimal disruption.
By the end of this module you will be prepared to plan and execute a migration to Datadog — from discovery and planning through implementation and post-migration validation.
Links and references
* [Datadog Documentation](https://docs.datadoghq.com/)
* [Grafana Loki (example alternative)](https://learn.kodekloud.com/user/courses/grafana-loki)
* [Prometheus Certified Associate (PCA) prep (example alternative)](https://learn.kodekloud.com/user/courses/prometheus-certified-associate-pca)