> ## Documentation Index
> Fetch the complete documentation index at: https://notes.kodekloud.com/llms.txt
> Use this file to discover all available pages before exploring further.
# Exploring Observability
> Explains observability importance for modern distributed cloud systems, describing telemetry types, placement in architectures, and benefits for business and engineering teams.
This lesson explains how system architectures have evolved, why observability is essential for modern distributed systems, and where to place telemetry to gain actionable insights for both business and engineering teams.
## How system architectures have changed
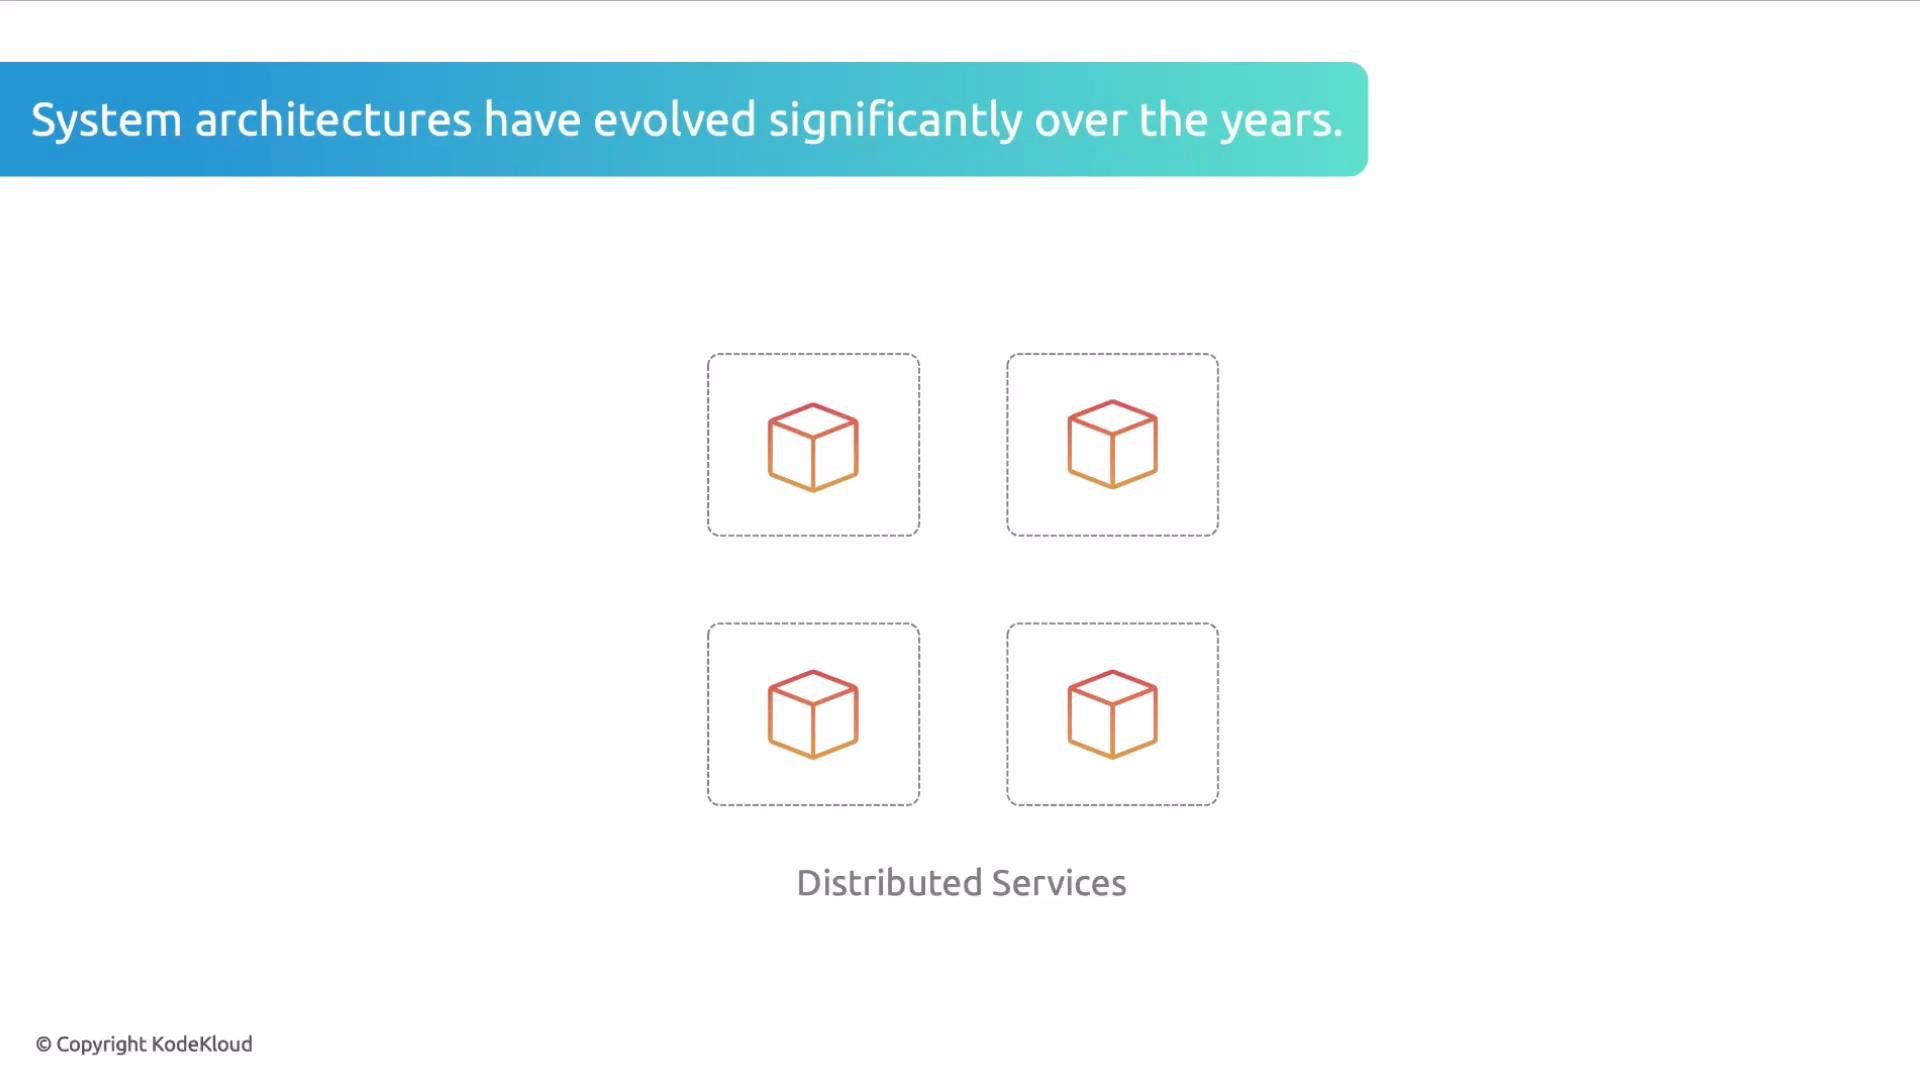
Over time we moved from single, bundled applications to highly distributed systems. Monoliths—where frontend, backend, integration layers, and databases were packaged together—gave way to services that run across many hosts, regions, and platforms. This architectural shift accelerated with widespread public cloud adoption.
 ## Where systems run today
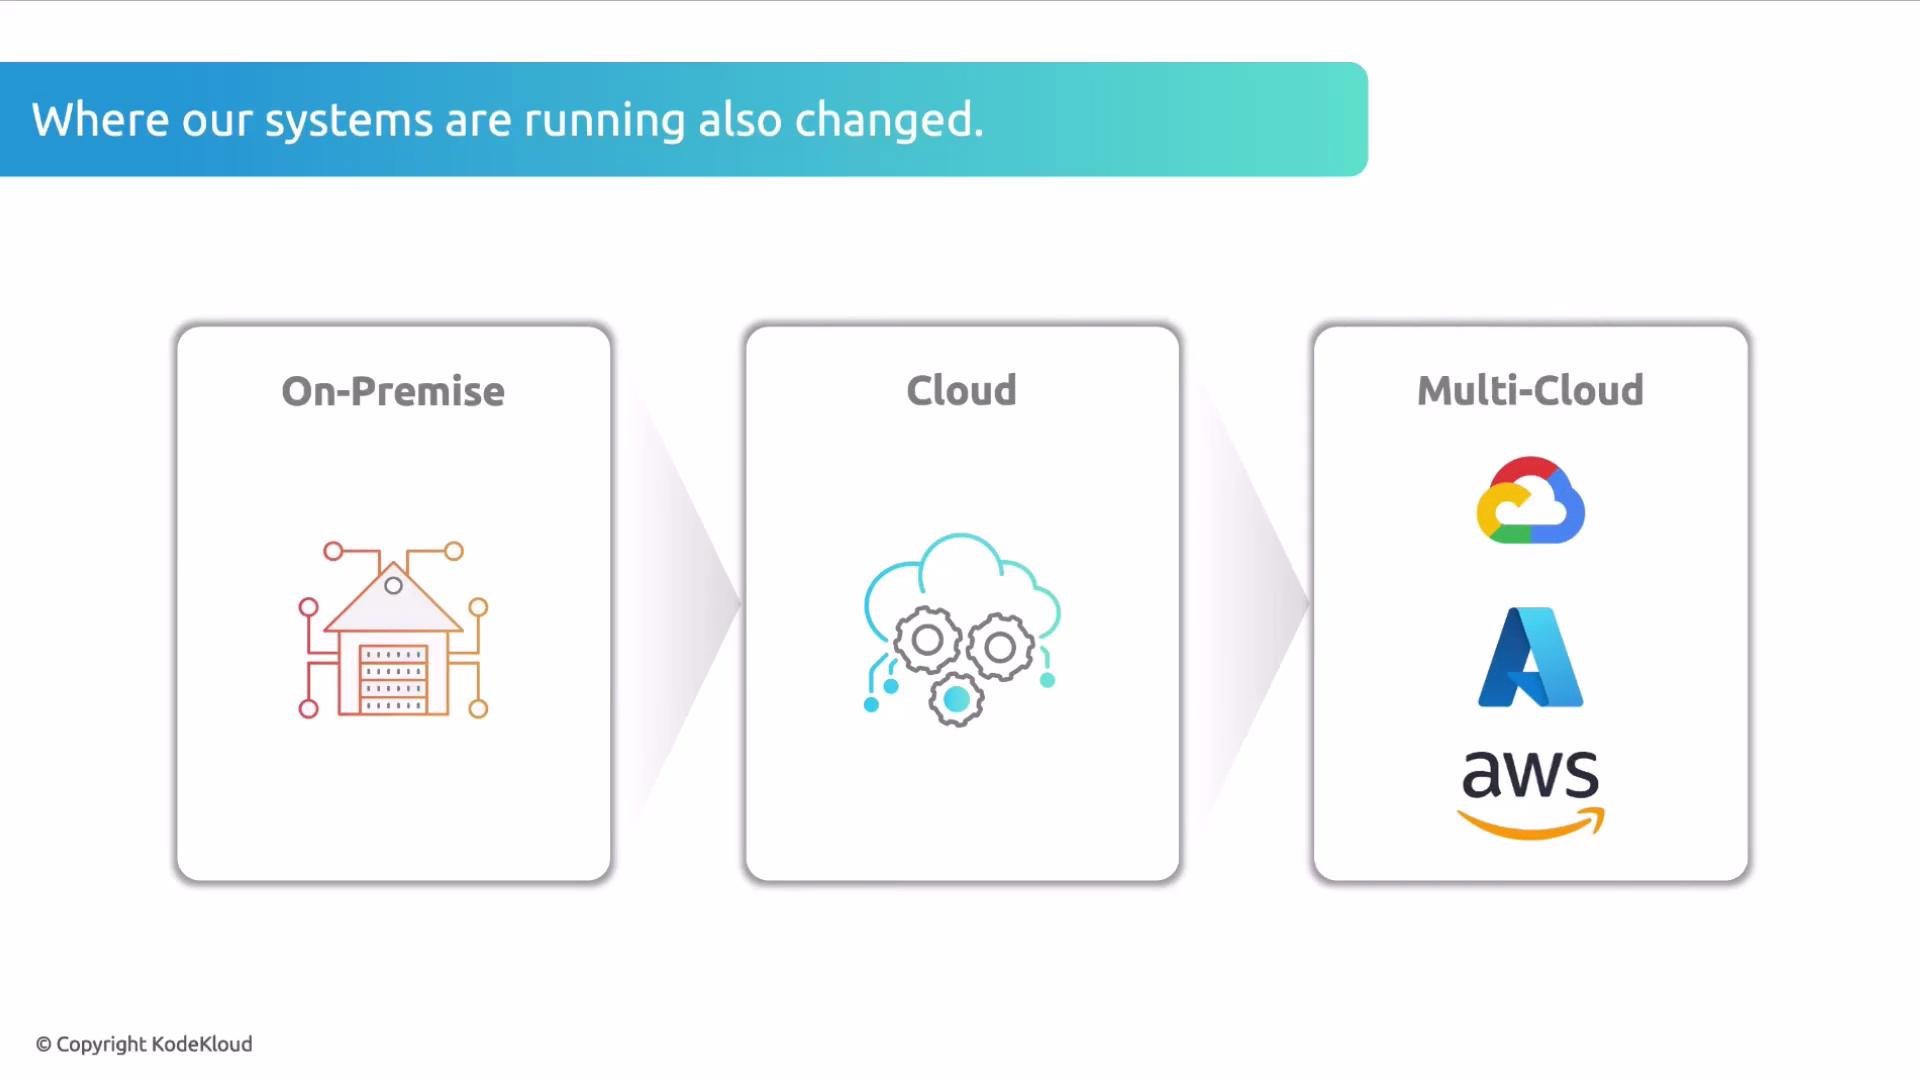
Hosting models also evolved: from on-premises data centers to public and private clouds, and now to hybrid and multi-cloud deployments that span multiple providers and regions. This diversification adds operational complexity and increases the need for consistent visibility across environments.
## Where systems run today
Hosting models also evolved: from on-premises data centers to public and private clouds, and now to hybrid and multi-cloud deployments that span multiple providers and regions. This diversification adds operational complexity and increases the need for consistent visibility across environments.
 ## From in-house monoliths to cloud-native platforms
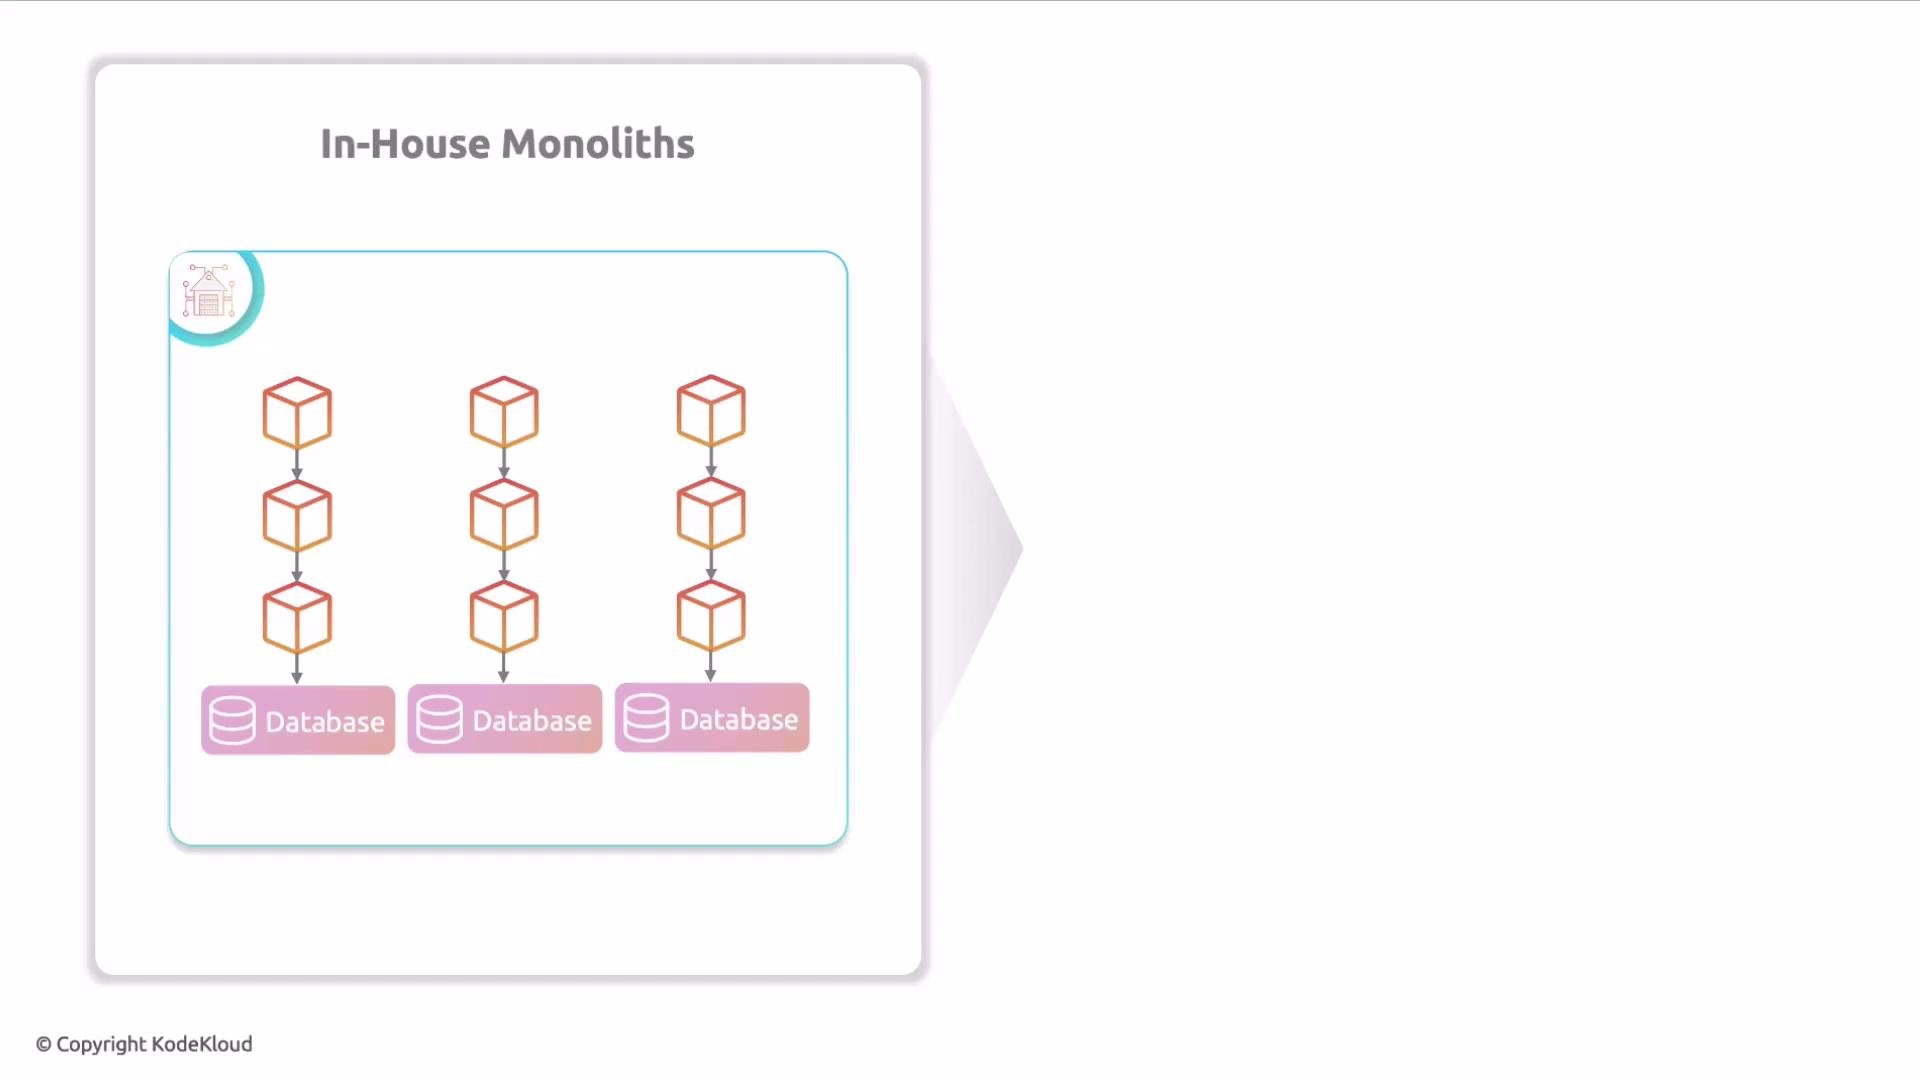
Historically, in-house monoliths ran on application servers and platform stacks such as Microsoft IIS or Linux-based application hosts and connected to local databases. Today’s distributed systems run across regions and cloud providers and often use orchestration and managed platforms like Kubernetes, Azure App Service, and Google Cloud Run.
## From in-house monoliths to cloud-native platforms
Historically, in-house monoliths ran on application servers and platform stacks such as Microsoft IIS or Linux-based application hosts and connected to local databases. Today’s distributed systems run across regions and cloud providers and often use orchestration and managed platforms like Kubernetes, Azure App Service, and Google Cloud Run.
 ## Why observability matters
Distributed architectures and multi-cloud deployments make root-cause analysis and performance tuning more challenging. Observability provides the telemetry and context teams need to understand system behavior, reduce mean time to detection (MTTD), and shorten mean time to resolution (MTTR).
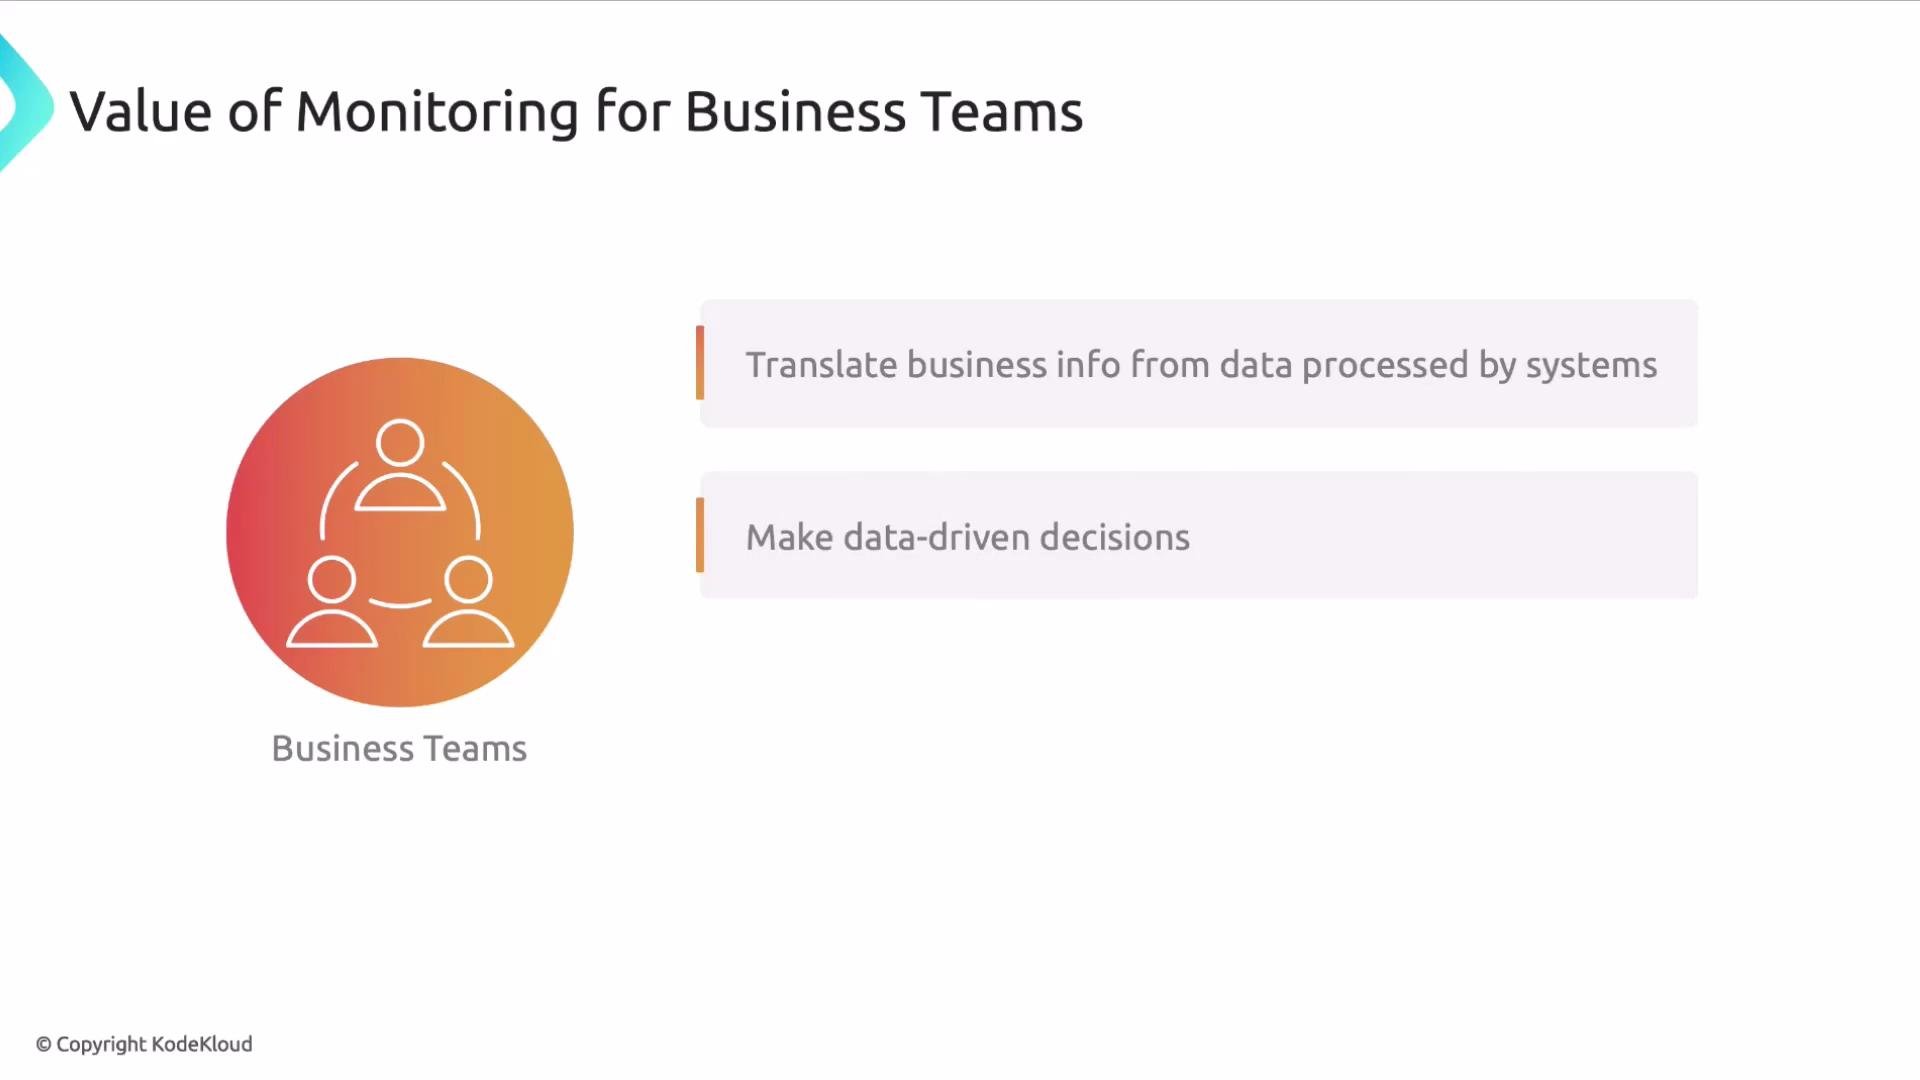
* For business teams: observability turns raw telemetry into actionable business insights and user behavior data, helping prioritize product and operational decisions.
* For engineering teams: it accelerates detection of performance regressions, pinpoints optimization opportunities, and improves incident response.
## Why observability matters
Distributed architectures and multi-cloud deployments make root-cause analysis and performance tuning more challenging. Observability provides the telemetry and context teams need to understand system behavior, reduce mean time to detection (MTTD), and shorten mean time to resolution (MTTR).
* For business teams: observability turns raw telemetry into actionable business insights and user behavior data, helping prioritize product and operational decisions.
* For engineering teams: it accelerates detection of performance regressions, pinpoints optimization opportunities, and improves incident response.
 Observability is the practice of deriving meaningful insight about system state and behavior from telemetry data—metrics, traces, and logs—so teams can diagnose issues, predict problems, and optimize performance.
## Core telemetry types and what they reveal
Use a combination of telemetry to get a complete view of system health and performance:
| Telemetry | What it measures | Typical example | Primary use |
| ------------ | ----------------------------------- | -------------------------------------------- | -------------------------------------- |
| Metrics | Numeric measurements over time | 250 ms average request latency | Trend analysis, alerting, SLA tracking |
| Traces | Distributed request flow and timing | Trace showing a slow DB call across services | Root-cause analysis for slow requests |
| Logs | Discrete events and error details | "Error: failed to connect to database" | Forensic diagnosis and context |
| Error counts | Aggregate failure rates | 130 HTTP 500 errors in the past hour | Detecting spikes in failures, alerting |
Combining these signals lets teams quickly triangulate the source of problems—e.g., a latency spike in metrics, traces that identify a slow downstream service, and logs that show the exception.
## Placing observability in your architecture
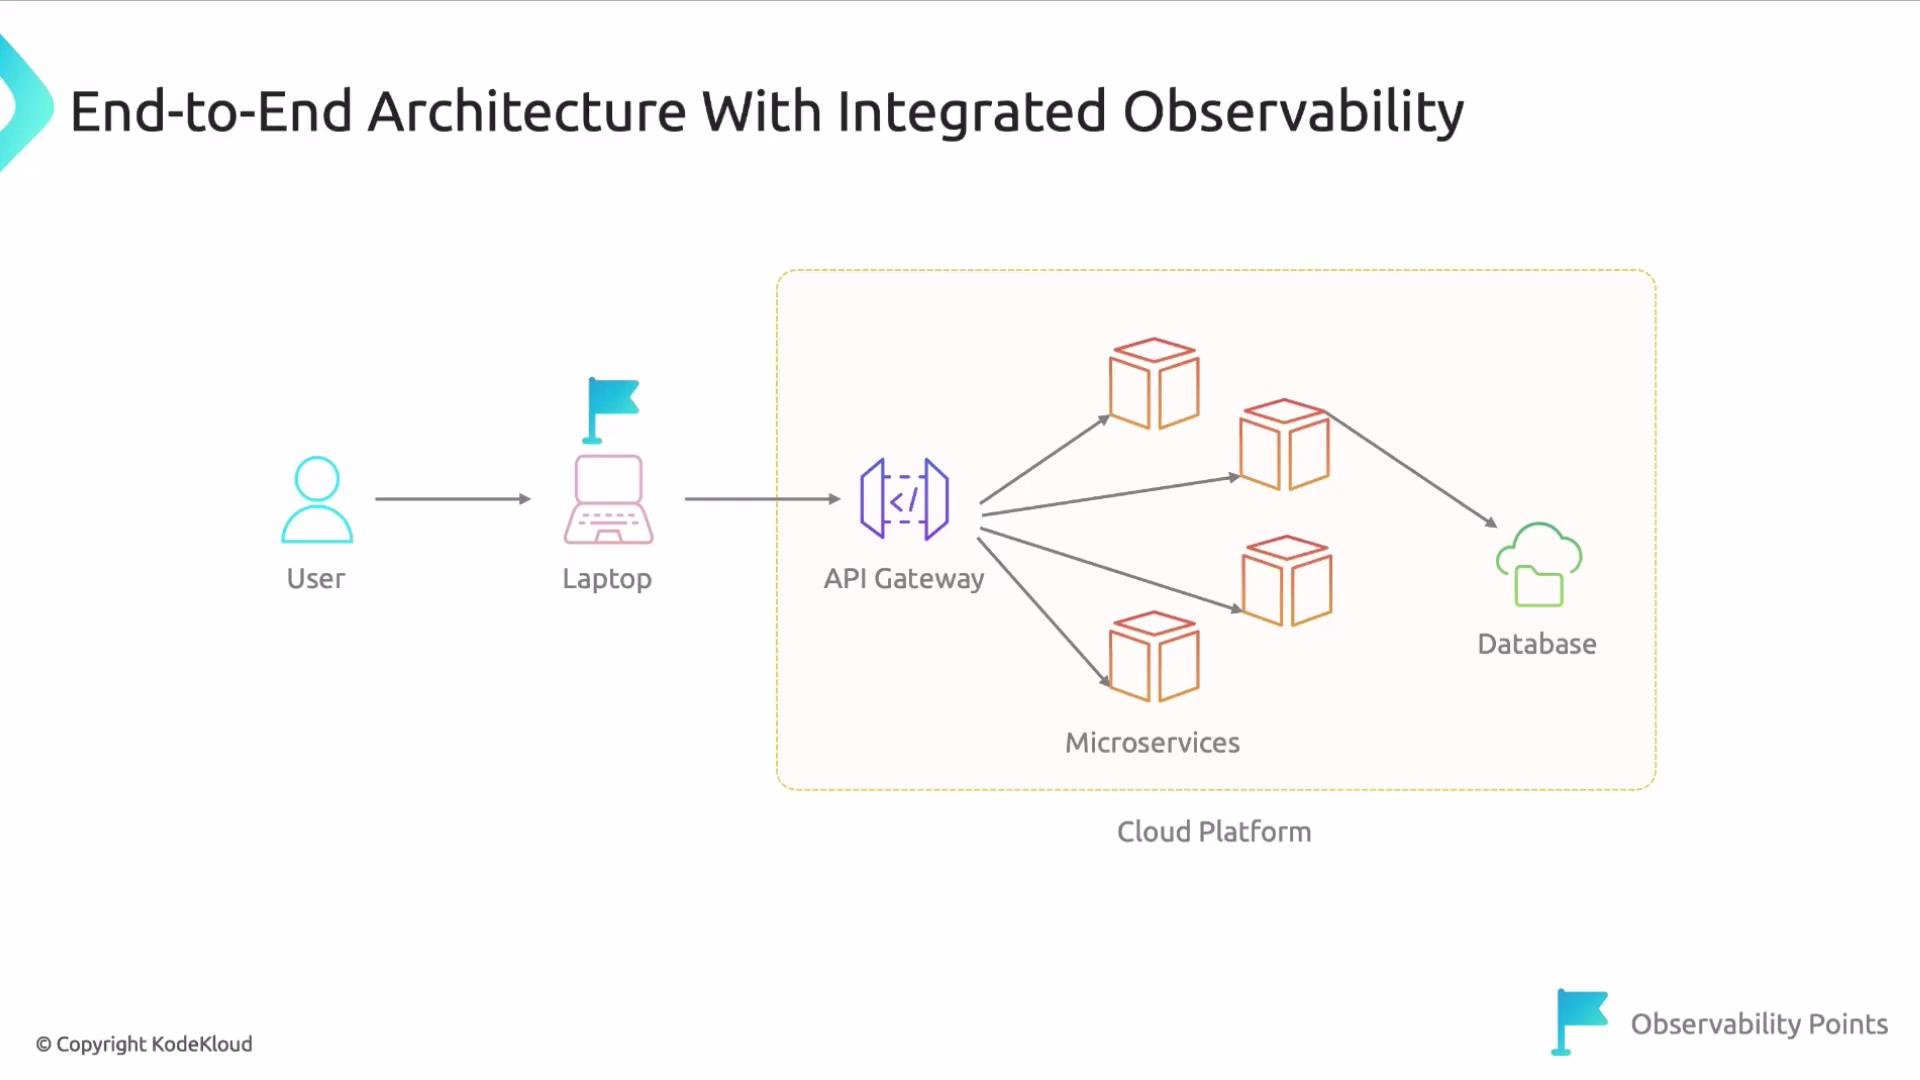
Observability should be integrated end-to-end: from the user device through API gateways and integration layers, into microservices or serverless functions, and down to data stores and infrastructure. Instrument the cloud platform, orchestrator, and underlying infrastructure to avoid blind spots.
Observability is the practice of deriving meaningful insight about system state and behavior from telemetry data—metrics, traces, and logs—so teams can diagnose issues, predict problems, and optimize performance.
## Core telemetry types and what they reveal
Use a combination of telemetry to get a complete view of system health and performance:
| Telemetry | What it measures | Typical example | Primary use |
| ------------ | ----------------------------------- | -------------------------------------------- | -------------------------------------- |
| Metrics | Numeric measurements over time | 250 ms average request latency | Trend analysis, alerting, SLA tracking |
| Traces | Distributed request flow and timing | Trace showing a slow DB call across services | Root-cause analysis for slow requests |
| Logs | Discrete events and error details | "Error: failed to connect to database" | Forensic diagnosis and context |
| Error counts | Aggregate failure rates | 130 HTTP 500 errors in the past hour | Detecting spikes in failures, alerting |
Combining these signals lets teams quickly triangulate the source of problems—e.g., a latency spike in metrics, traces that identify a slow downstream service, and logs that show the exception.
## Placing observability in your architecture
Observability should be integrated end-to-end: from the user device through API gateways and integration layers, into microservices or serverless functions, and down to data stores and infrastructure. Instrument the cloud platform, orchestrator, and underlying infrastructure to avoid blind spots.
 ## Quick reference: benefits by team
| Team | Observable outcomes |
| ---------- | --------------------------------------------------------------------- |
| Business | Data-driven decisions, user behavior insights, product health metrics |
| Technology | Faster incident response, performance tuning, capacity planning |
## Further reading and references
* [New Relic: What is observability?](https://newrelic.com/what-is/observability) — definition and context for observability practice.
* [Kubernetes documentation](https://kubernetes.io/docs/) — platform guidance for orchestrated deployments.
That concludes this lesson.
## Quick reference: benefits by team
| Team | Observable outcomes |
| ---------- | --------------------------------------------------------------------- |
| Business | Data-driven decisions, user behavior insights, product health metrics |
| Technology | Faster incident response, performance tuning, capacity planning |
## Further reading and references
* [New Relic: What is observability?](https://newrelic.com/what-is/observability) — definition and context for observability practice.
* [Kubernetes documentation](https://kubernetes.io/docs/) — platform guidance for orchestrated deployments.
That concludes this lesson.