> ## Documentation Index
> Fetch the complete documentation index at: https://notes.kodekloud.com/llms.txt
> Use this file to discover all available pages before exploring further.
# OpenTelemetry
> Overview of OpenTelemetry, a vendor neutral standard and Collector architecture for instrumenting, collecting, processing, and exporting telemetry to enable interoperable observability across tools
In this lesson we introduce OpenTelemetry — a vendor-neutral, open-source standard for collecting observability telemetry (traces, metrics, and logs). OpenTelemetry reduces fragmentation across tools and vendors by standardizing how telemetry is produced, collected, and exported. This simplifies instrumenting applications, integrating with backends, and migrating between observability providers.
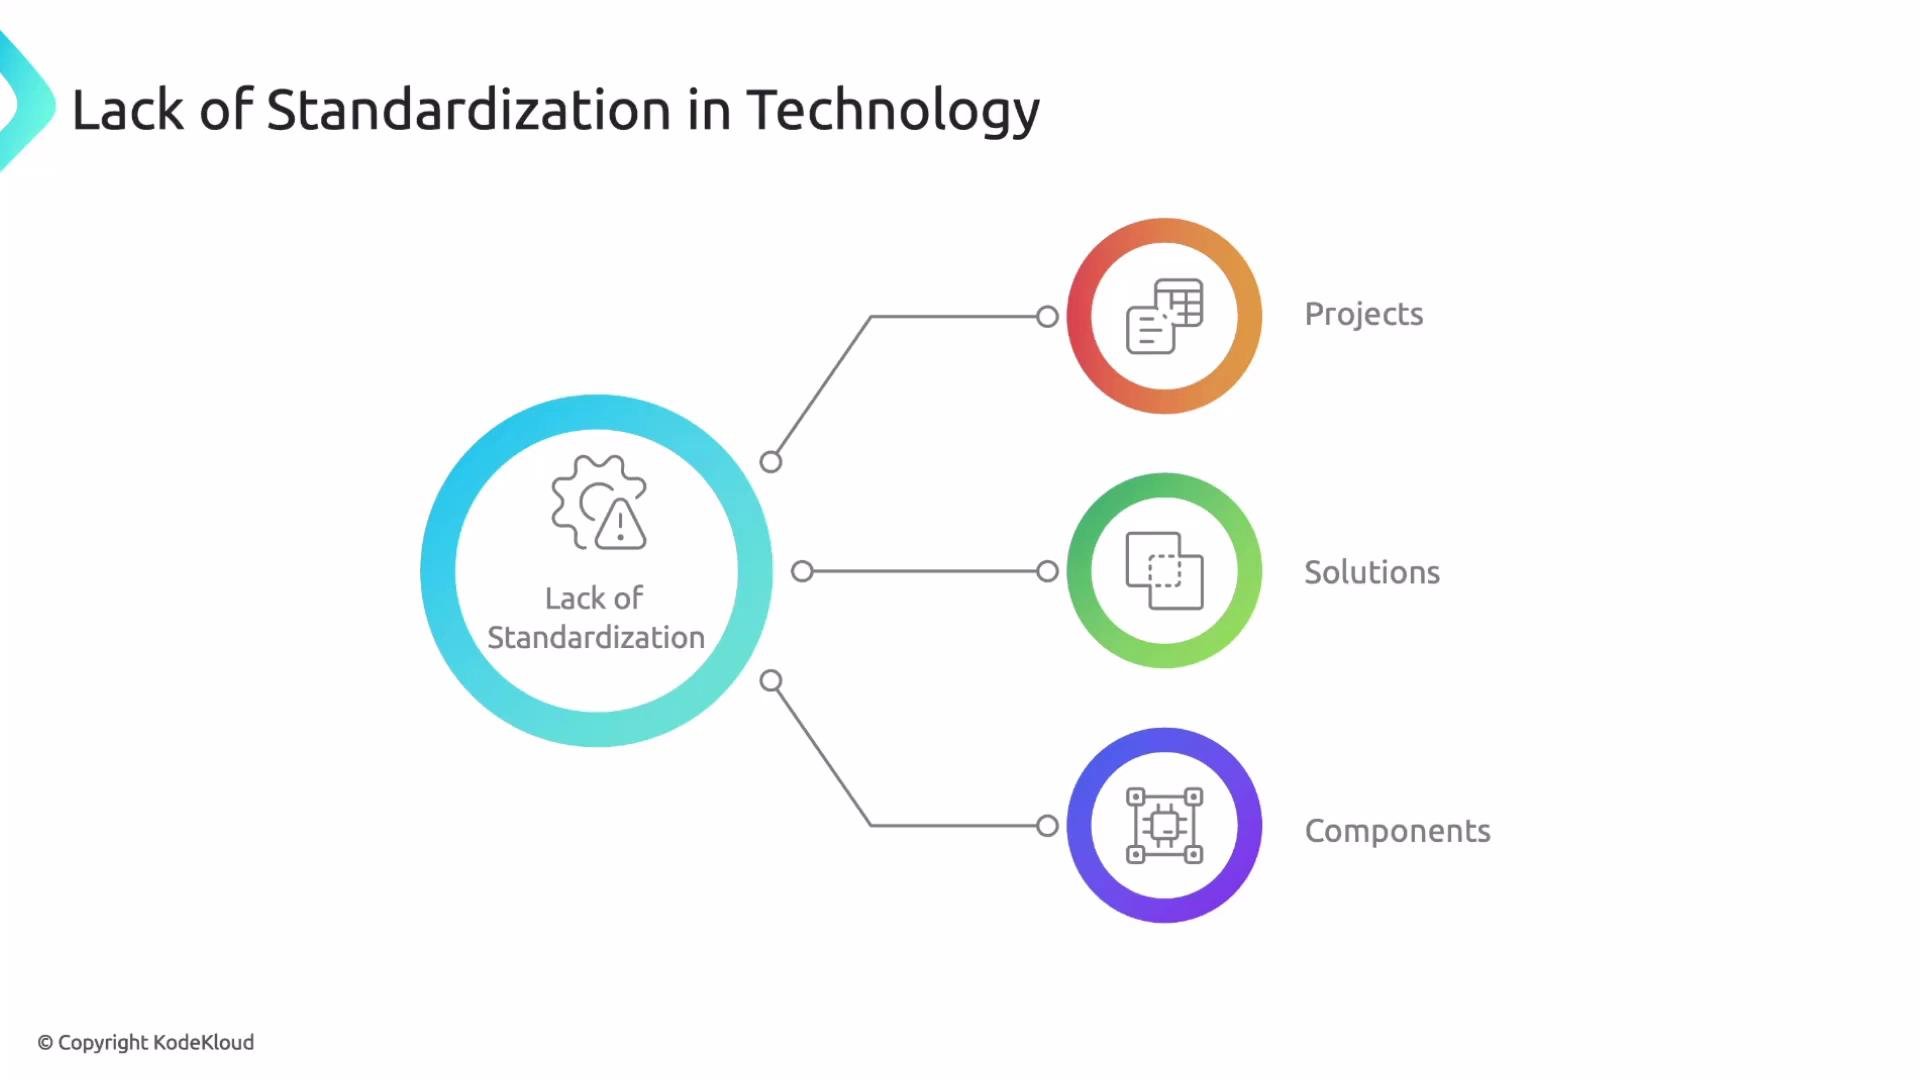
A common problem in the ecosystem is a lack of standardization. When projects, solutions, and components use different formats or protocols, integrations become brittle and migrations are harder.
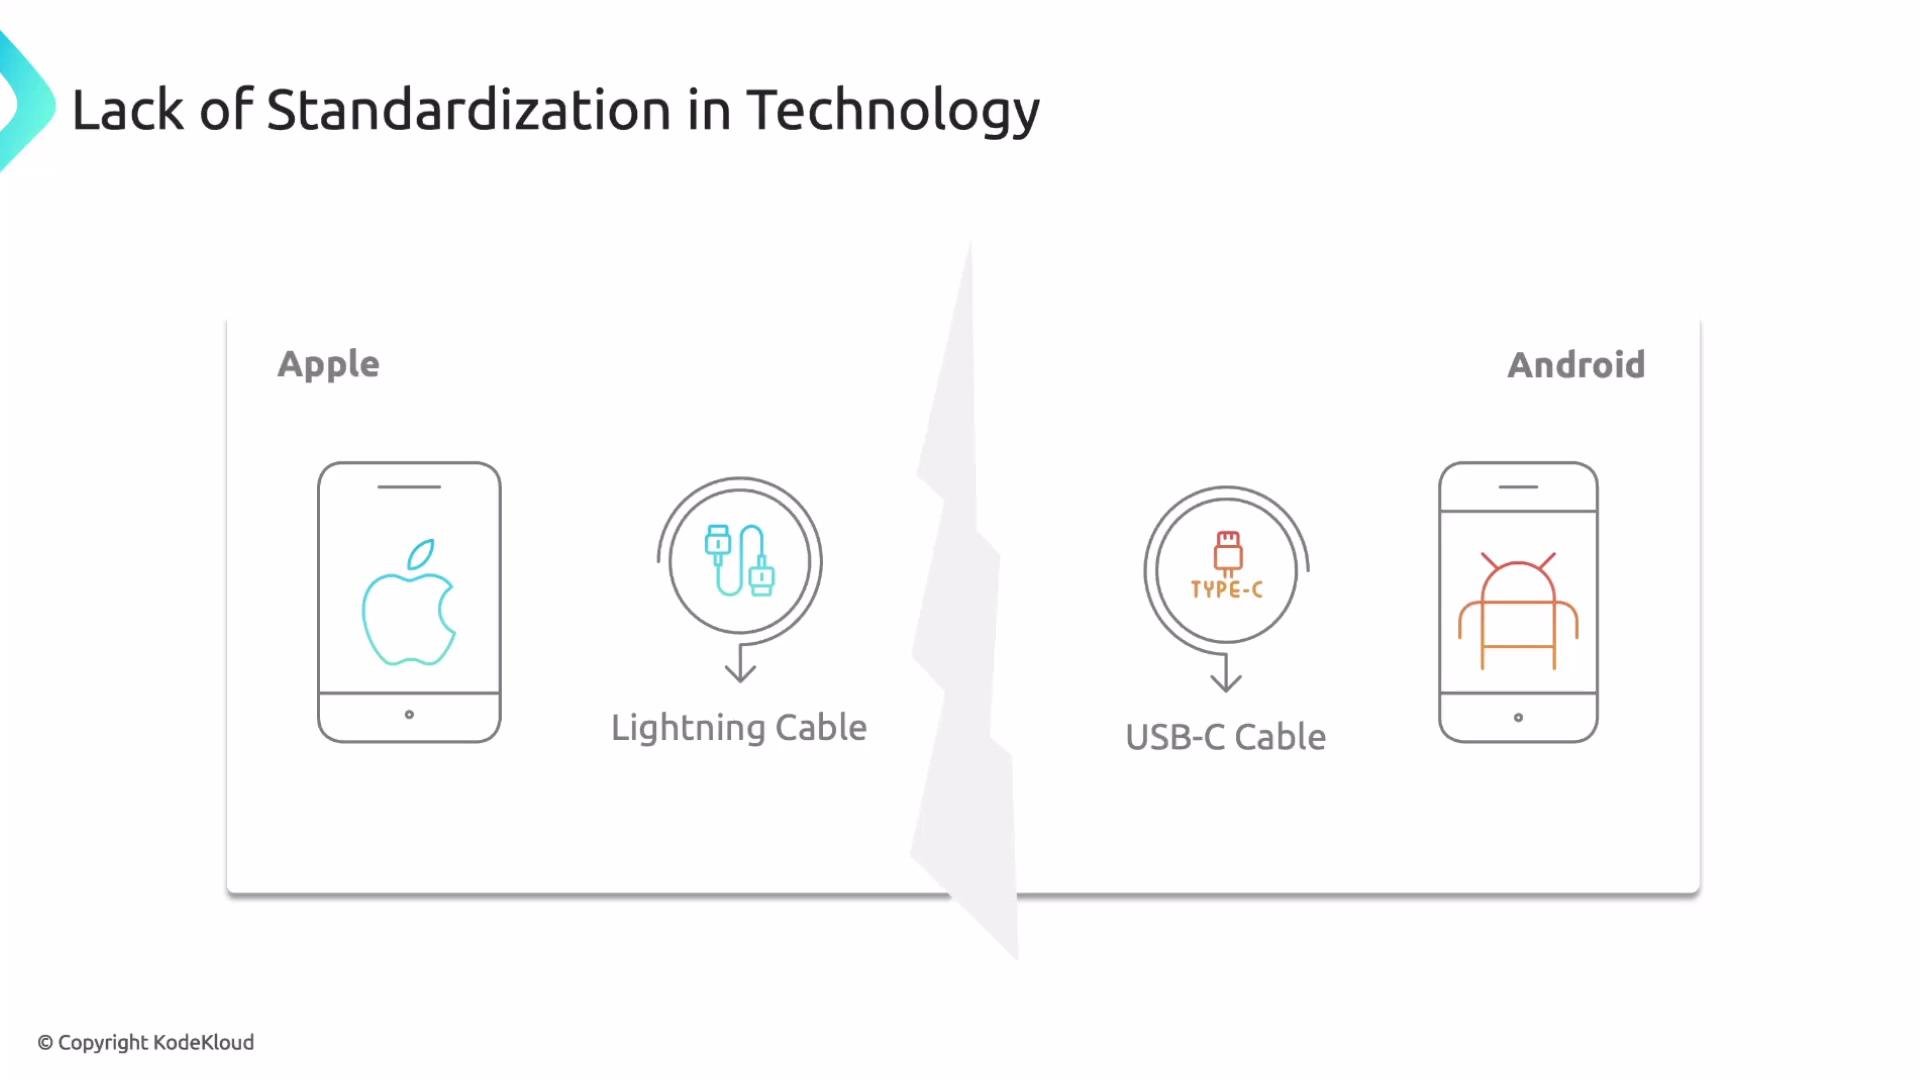
 A simple analogy is smartphone charging cables: historically, iPhones used Apple's Lightning connector while most Android devices used USB-C. This incompatibility prevented easy cable sharing and discouraged switching devices. With Apple’s move to USB-C, compatibility improved across vendors — the same pattern OpenTelemetry brings to observability.
 What is OpenTelemetry?
OpenTelemetry (often shortened to OTel) is a set of specifications, language APIs, SDKs, and components that standardize how telemetry is created and exported. It’s widely adopted and supported by major observability platforms such as [Datadog](https://www.datadoghq.com), [Grafana](https://grafana.com), and [Dynatrace](https://www.dynatrace.com).
At a high level, the OpenTelemetry architecture splits into two areas:
* Instrumentation and data collection (the telemetry sources)
* The OpenTelemetry Collector (central ingestion, processing, and export)
Instrumentation and sources
Common telemetry sources include application code, infrastructure, proxies, managed services, and APM integrations. Instrumentation typically comes in three forms:
* Auto-instrumentation: Agents or libraries that automatically add telemetry to applications without changing application logic. Useful for rapid coverage and legacy codebases.
* OpenTelemetry API (manual/custom instrumentation): A stable API developers use to add explicit traces, metrics, and logs where automatic instrumentation is insufficient or when richer semantics are required.
* SDKs: Language-specific SDK implementations that provide configuration, context propagation, resource attributes, and wiring to exporters.
Table: Instrumentation components
| Component | Purpose | When to use |
| -------------------- | ----------------------------------------------------------------------- | ------------------------------------------------------------------ |
| Auto-instrumentation | Automatically generates telemetry from runtime frameworks and libraries | Quick coverage, minimal code changes |
| OpenTelemetry API | Explicitly create spans, metrics, and logs in code | Custom instrumentation and business-level traces |
| SDKs | Language-specific implementations that handle context and exporting | Required for API-backed instrumentation and advanced configuration |
The OpenTelemetry Collector
The Collector is a vendor-neutral agent/gateway that centralizes collection, optional in-pipeline processing, and exporting of telemetry to backends. It decouples data producers from consumers so you can add, remove, or change backends without changing application instrumentation.
Core Collector components:
| Component | Role | Examples |
| ---------- | ---------------------------------------------------------- | ----------------------------------------------------------------------------------- |
| Receivers | Accept telemetry over various protocols | `OTLP`, [Jaeger](https://www.jaegertracing.io), [Prometheus](https://prometheus.io) |
| Processors | Transform, filter, batch, and sample telemetry in-pipeline | Batching, attribute enrichment, sampling |
| Exporters | Send processed telemetry to backends or sinks | Datadog, Grafana, Dynatrace, backend APIs |
Telemetry sources send data to the Collector, which ingests, optionally transforms, and exports it to configured backends. Using the Collector enables centralized control over sampling, enrichment, and routing.
What is OpenTelemetry?
OpenTelemetry (often shortened to OTel) is a set of specifications, language APIs, SDKs, and components that standardize how telemetry is created and exported. It’s widely adopted and supported by major observability platforms such as [Datadog](https://www.datadoghq.com), [Grafana](https://grafana.com), and [Dynatrace](https://www.dynatrace.com).
At a high level, the OpenTelemetry architecture splits into two areas:
* Instrumentation and data collection (the telemetry sources)
* The OpenTelemetry Collector (central ingestion, processing, and export)
Instrumentation and sources
Common telemetry sources include application code, infrastructure, proxies, managed services, and APM integrations. Instrumentation typically comes in three forms:
* Auto-instrumentation: Agents or libraries that automatically add telemetry to applications without changing application logic. Useful for rapid coverage and legacy codebases.
* OpenTelemetry API (manual/custom instrumentation): A stable API developers use to add explicit traces, metrics, and logs where automatic instrumentation is insufficient or when richer semantics are required.
* SDKs: Language-specific SDK implementations that provide configuration, context propagation, resource attributes, and wiring to exporters.
Table: Instrumentation components
| Component | Purpose | When to use |
| -------------------- | ----------------------------------------------------------------------- | ------------------------------------------------------------------ |
| Auto-instrumentation | Automatically generates telemetry from runtime frameworks and libraries | Quick coverage, minimal code changes |
| OpenTelemetry API | Explicitly create spans, metrics, and logs in code | Custom instrumentation and business-level traces |
| SDKs | Language-specific implementations that handle context and exporting | Required for API-backed instrumentation and advanced configuration |
The OpenTelemetry Collector
The Collector is a vendor-neutral agent/gateway that centralizes collection, optional in-pipeline processing, and exporting of telemetry to backends. It decouples data producers from consumers so you can add, remove, or change backends without changing application instrumentation.
Core Collector components:
| Component | Role | Examples |
| ---------- | ---------------------------------------------------------- | ----------------------------------------------------------------------------------- |
| Receivers | Accept telemetry over various protocols | `OTLP`, [Jaeger](https://www.jaegertracing.io), [Prometheus](https://prometheus.io) |
| Processors | Transform, filter, batch, and sample telemetry in-pipeline | Batching, attribute enrichment, sampling |
| Exporters | Send processed telemetry to backends or sinks | Datadog, Grafana, Dynatrace, backend APIs |
Telemetry sources send data to the Collector, which ingests, optionally transforms, and exports it to configured backends. Using the Collector enables centralized control over sampling, enrichment, and routing.
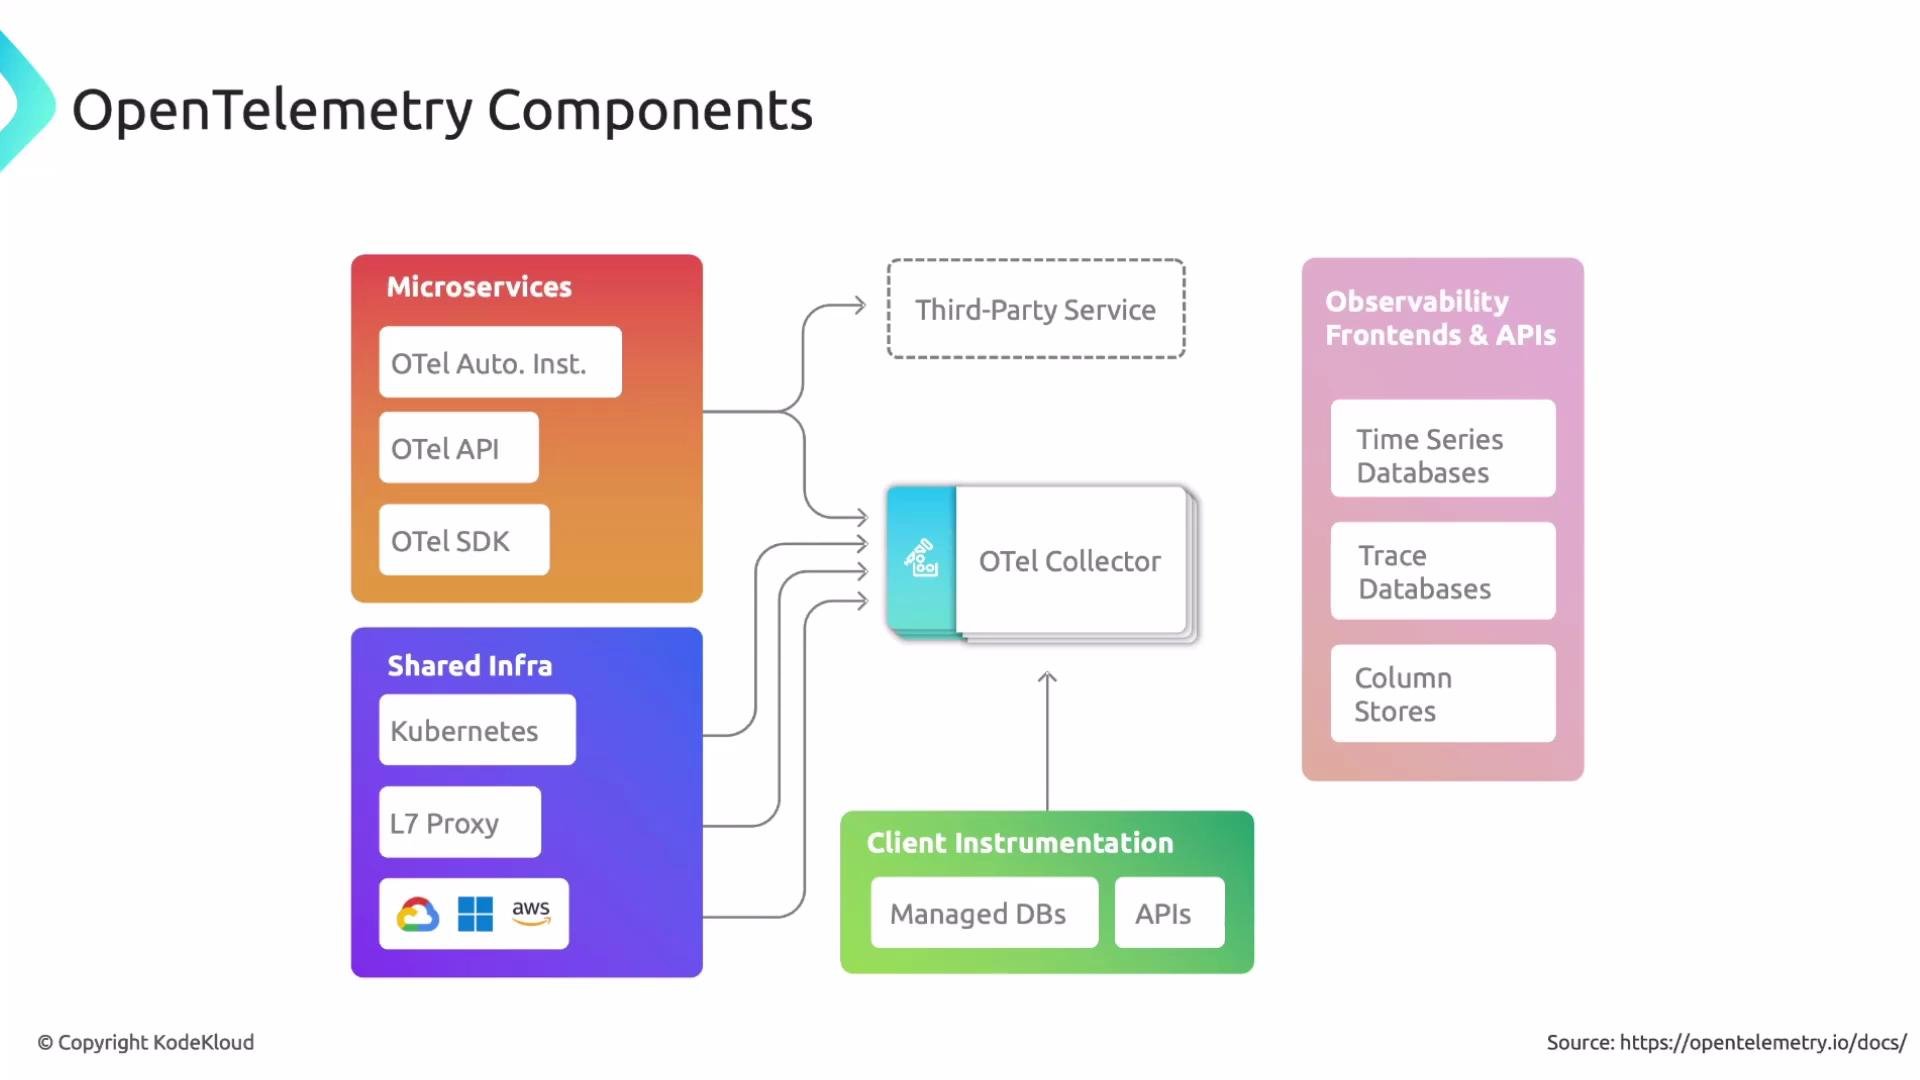 The OpenTelemetry Collector can be deployed as an agent (sidecar or node-level) close to your applications, or as a gateway (centralized) to receive and forward telemetry from multiple sources — choose the deployment model that matches your scaling and security needs.
Benefits of using OpenTelemetry
* Higher-quality telemetry\
The OpenTelemetry specification encourages consistent resource attributes and rich metadata, improving traceability and making cross-service correlation easier.
* Vendor flexibility and easier migrations\
Standardized instrumentation lets you switch or add observability backends with minimal changes to application code.
* Scalability and performance\
Collector and SDK implementations are designed for high-throughput environments; proper configuration ensures reliable telemetry under heavy load.
* Centralized processing and control\
Using the Collector allows you to apply sampling, filtering, enrichment, and routing consistently across all your telemetry.
Getting started
* Explore official guides and quickstarts at the OpenTelemetry website: [https://opentelemetry.io](https://opentelemetry.io)
* Consider an initial setup that includes auto-instrumentation plus a Collector deployment (agent or gateway) that exports to your chosen backend(s).
* For production, design Collector topology (agent vs gateway), sampling strategy, and resource attribute conventions before scaling.
References and further reading
* [OpenTelemetry Documentation](https://opentelemetry.io/docs/)
* [OTLP protocol specification](https://opentelemetry.io/docs/reference/specification/protocol/)
* [Jaeger Tracing](https://www.jaegertracing.io)
* [Prometheus](https://prometheus.io)
* [Datadog](https://www.datadoghq.com)
* [Grafana](https://grafana.com)
* [Dynatrace](https://www.dynatrace.com)
That's it for now.
The OpenTelemetry Collector can be deployed as an agent (sidecar or node-level) close to your applications, or as a gateway (centralized) to receive and forward telemetry from multiple sources — choose the deployment model that matches your scaling and security needs.
Benefits of using OpenTelemetry
* Higher-quality telemetry\
The OpenTelemetry specification encourages consistent resource attributes and rich metadata, improving traceability and making cross-service correlation easier.
* Vendor flexibility and easier migrations\
Standardized instrumentation lets you switch or add observability backends with minimal changes to application code.
* Scalability and performance\
Collector and SDK implementations are designed for high-throughput environments; proper configuration ensures reliable telemetry under heavy load.
* Centralized processing and control\
Using the Collector allows you to apply sampling, filtering, enrichment, and routing consistently across all your telemetry.
Getting started
* Explore official guides and quickstarts at the OpenTelemetry website: [https://opentelemetry.io](https://opentelemetry.io)
* Consider an initial setup that includes auto-instrumentation plus a Collector deployment (agent or gateway) that exports to your chosen backend(s).
* For production, design Collector topology (agent vs gateway), sampling strategy, and resource attribute conventions before scaling.
References and further reading
* [OpenTelemetry Documentation](https://opentelemetry.io/docs/)
* [OTLP protocol specification](https://opentelemetry.io/docs/reference/specification/protocol/)
* [Jaeger Tracing](https://www.jaegertracing.io)
* [Prometheus](https://prometheus.io)
* [Datadog](https://www.datadoghq.com)
* [Grafana](https://grafana.com)
* [Dynatrace](https://www.dynatrace.com)
That's it for now.