> ## Documentation Index
> Fetch the complete documentation index at: https://notes.kodekloud.com/llms.txt
> Use this file to discover all available pages before exploring further.
# Watchdog
> Datadog Watchdog is an AI observability assistant that automatically detects and prioritizes anomalies by baselining behavior and correlating metrics, logs, traces, and events for faster root cause analysis.
Watchdog is Datadog’s AI-powered observability assistant that surfaces anomalous behaviors across applications and infrastructure. Rather than only monitoring metrics, Watchdog applies machine learning to provide contextualized, prioritized insights that help engineers detect, understand, and act on issues faster.
Datadog introduced Watchdog to meet the growing need for solution-integrated AI capabilities—tools that not only detect anomalies but also correlate signals across your stack so you can focus on the most impactful problems.
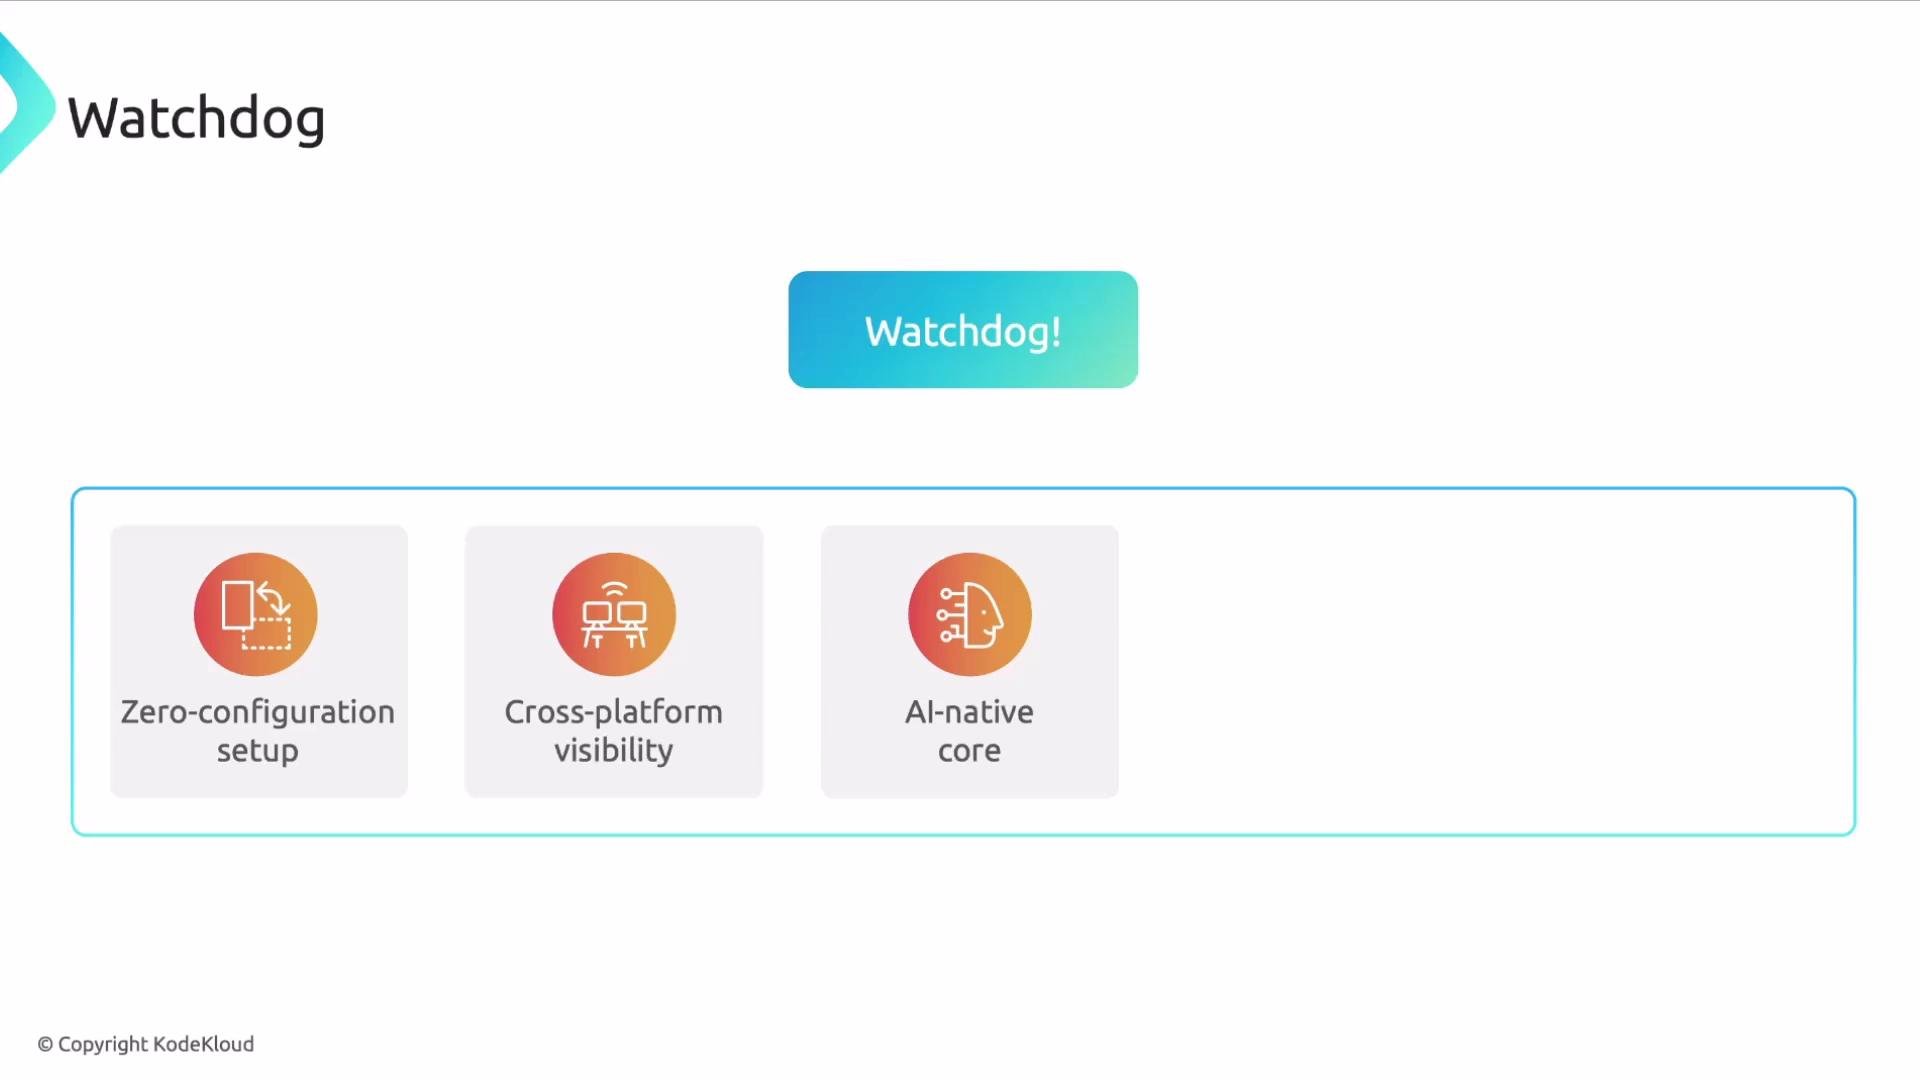
Watchdog's core advantages include zero-configuration setup, cross-platform visibility, and an AI-native core:
 Watchdog is available directly from the Datadog console and surfaces insights under Monitors and the dedicated Watchdog view. It helps you prioritize by highlighting the most impactful anomalies and indicating which issues to investigate first.
How Watchdog builds and uses baselines
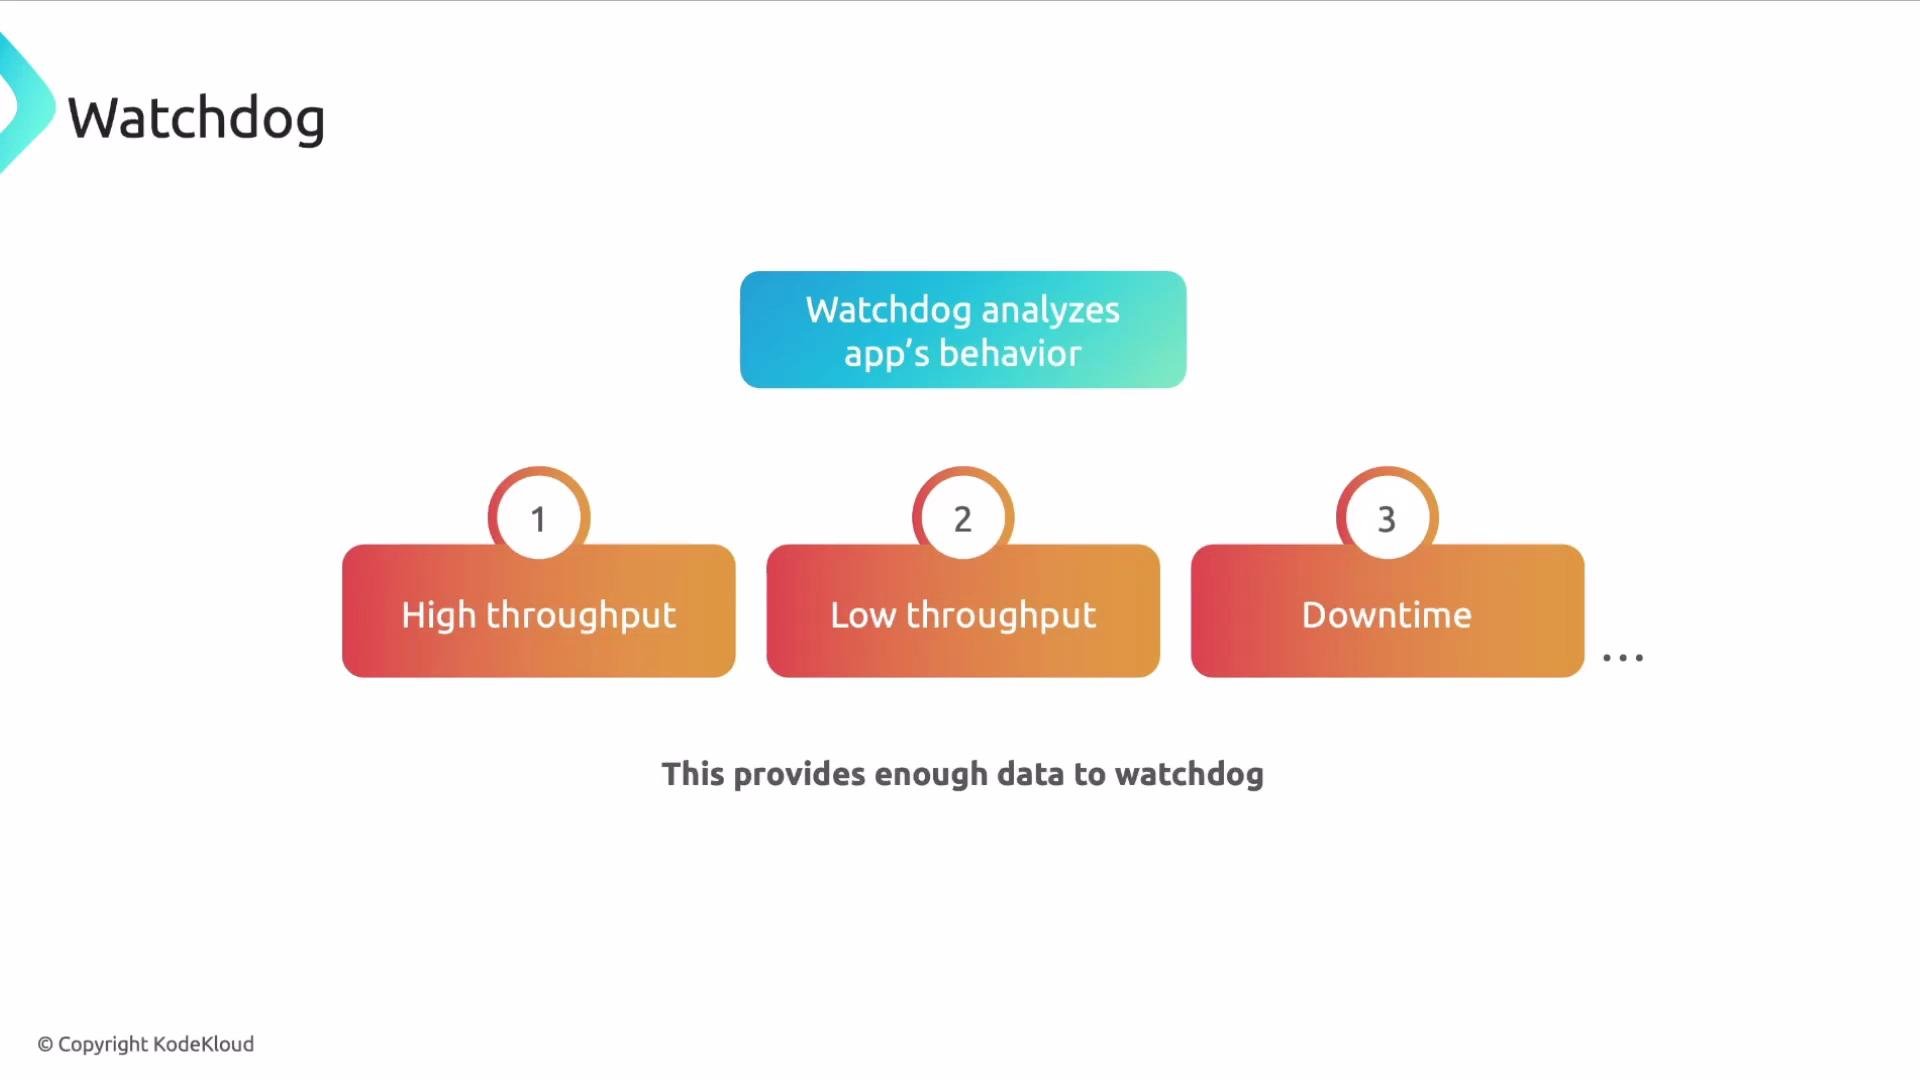
Watchdog constructs a model of “normal” behavior by analyzing historical signals across operational modes—high throughput, low throughput, downtime, and other conditions. With this baseline, it detects deviations from expected patterns, often surfacing problems earlier than threshold-based monitors.
Watchdog is available directly from the Datadog console and surfaces insights under Monitors and the dedicated Watchdog view. It helps you prioritize by highlighting the most impactful anomalies and indicating which issues to investigate first.
How Watchdog builds and uses baselines
Watchdog constructs a model of “normal” behavior by analyzing historical signals across operational modes—high throughput, low throughput, downtime, and other conditions. With this baseline, it detects deviations from expected patterns, often surfacing problems earlier than threshold-based monitors.
 When Watchdog detects a significant anomaly it:
* Flags the anomalous behavior and can trigger alerts or create monitors automatically.
* Provides a correlated timeline of relevant events to speed root-cause analysis.
* Correlates logs and distributed traces (APM) with other signals such as security alerts and infrastructure failures.
* Suggests probable root causes or contributing factors so you can begin debugging from an informed hypothesis.
This multi-signal correlation reduces manual effort in piecing together timelines across tools, lowers false positives, and improves alert signal-to-noise so teams can act on what matters.
Quick feature summary
| Feature | Why it matters | Example outcome |
| ------------------------- | ---------------------------------------- | --------------------------------------------------- |
| Zero-configuration | Immediate value with minimal setup | Detects anomalies without custom instrumentation |
| Cross-platform visibility | Correlates app, infra, logs, and traces | Faster identification of upstream/downstream causes |
| AI-native baselining | Learns normal behavior across conditions | Fewer false positives and better prioritization |
Watchdog uses historical baselining and multi-signal correlation to lower false positives and provide contextualized, prioritized insights. You can find these insights under [Monitors](https://docs.datadoghq.com/monitors/) in the [Datadog console](https://app.datadoghq.com/).
Further reading and resources
* Datadog Watchdog product page: [https://www.datadoghq.com/product/watchdog/](https://www.datadoghq.com/product/watchdog/)
* Datadog Monitors documentation: [https://docs.datadoghq.com/monitors/](https://docs.datadoghq.com/monitors/)
* Datadog APM and distributed tracing: [https://docs.datadoghq.com/tracing/](https://docs.datadoghq.com/tracing/)
That's it for this lesson. I hope you found it helpful.
When Watchdog detects a significant anomaly it:
* Flags the anomalous behavior and can trigger alerts or create monitors automatically.
* Provides a correlated timeline of relevant events to speed root-cause analysis.
* Correlates logs and distributed traces (APM) with other signals such as security alerts and infrastructure failures.
* Suggests probable root causes or contributing factors so you can begin debugging from an informed hypothesis.
This multi-signal correlation reduces manual effort in piecing together timelines across tools, lowers false positives, and improves alert signal-to-noise so teams can act on what matters.
Quick feature summary
| Feature | Why it matters | Example outcome |
| ------------------------- | ---------------------------------------- | --------------------------------------------------- |
| Zero-configuration | Immediate value with minimal setup | Detects anomalies without custom instrumentation |
| Cross-platform visibility | Correlates app, infra, logs, and traces | Faster identification of upstream/downstream causes |
| AI-native baselining | Learns normal behavior across conditions | Fewer false positives and better prioritization |
Watchdog uses historical baselining and multi-signal correlation to lower false positives and provide contextualized, prioritized insights. You can find these insights under [Monitors](https://docs.datadoghq.com/monitors/) in the [Datadog console](https://app.datadoghq.com/).
Further reading and resources
* Datadog Watchdog product page: [https://www.datadoghq.com/product/watchdog/](https://www.datadoghq.com/product/watchdog/)
* Datadog Monitors documentation: [https://docs.datadoghq.com/monitors/](https://docs.datadoghq.com/monitors/)
* Datadog APM and distributed tracing: [https://docs.datadoghq.com/tracing/](https://docs.datadoghq.com/tracing/)
That's it for this lesson. I hope you found it helpful.