> ## Documentation Index
> Fetch the complete documentation index at: https://notes.kodekloud.com/llms.txt
> Use this file to discover all available pages before exploring further.
# Evaluating Statistical Significance of Fine Tuning
> Assessing LLM fine-tuning significance using hypothesis testing p-values, appropriate statistical tests, and complementary measures like effect sizes and confidence intervals.
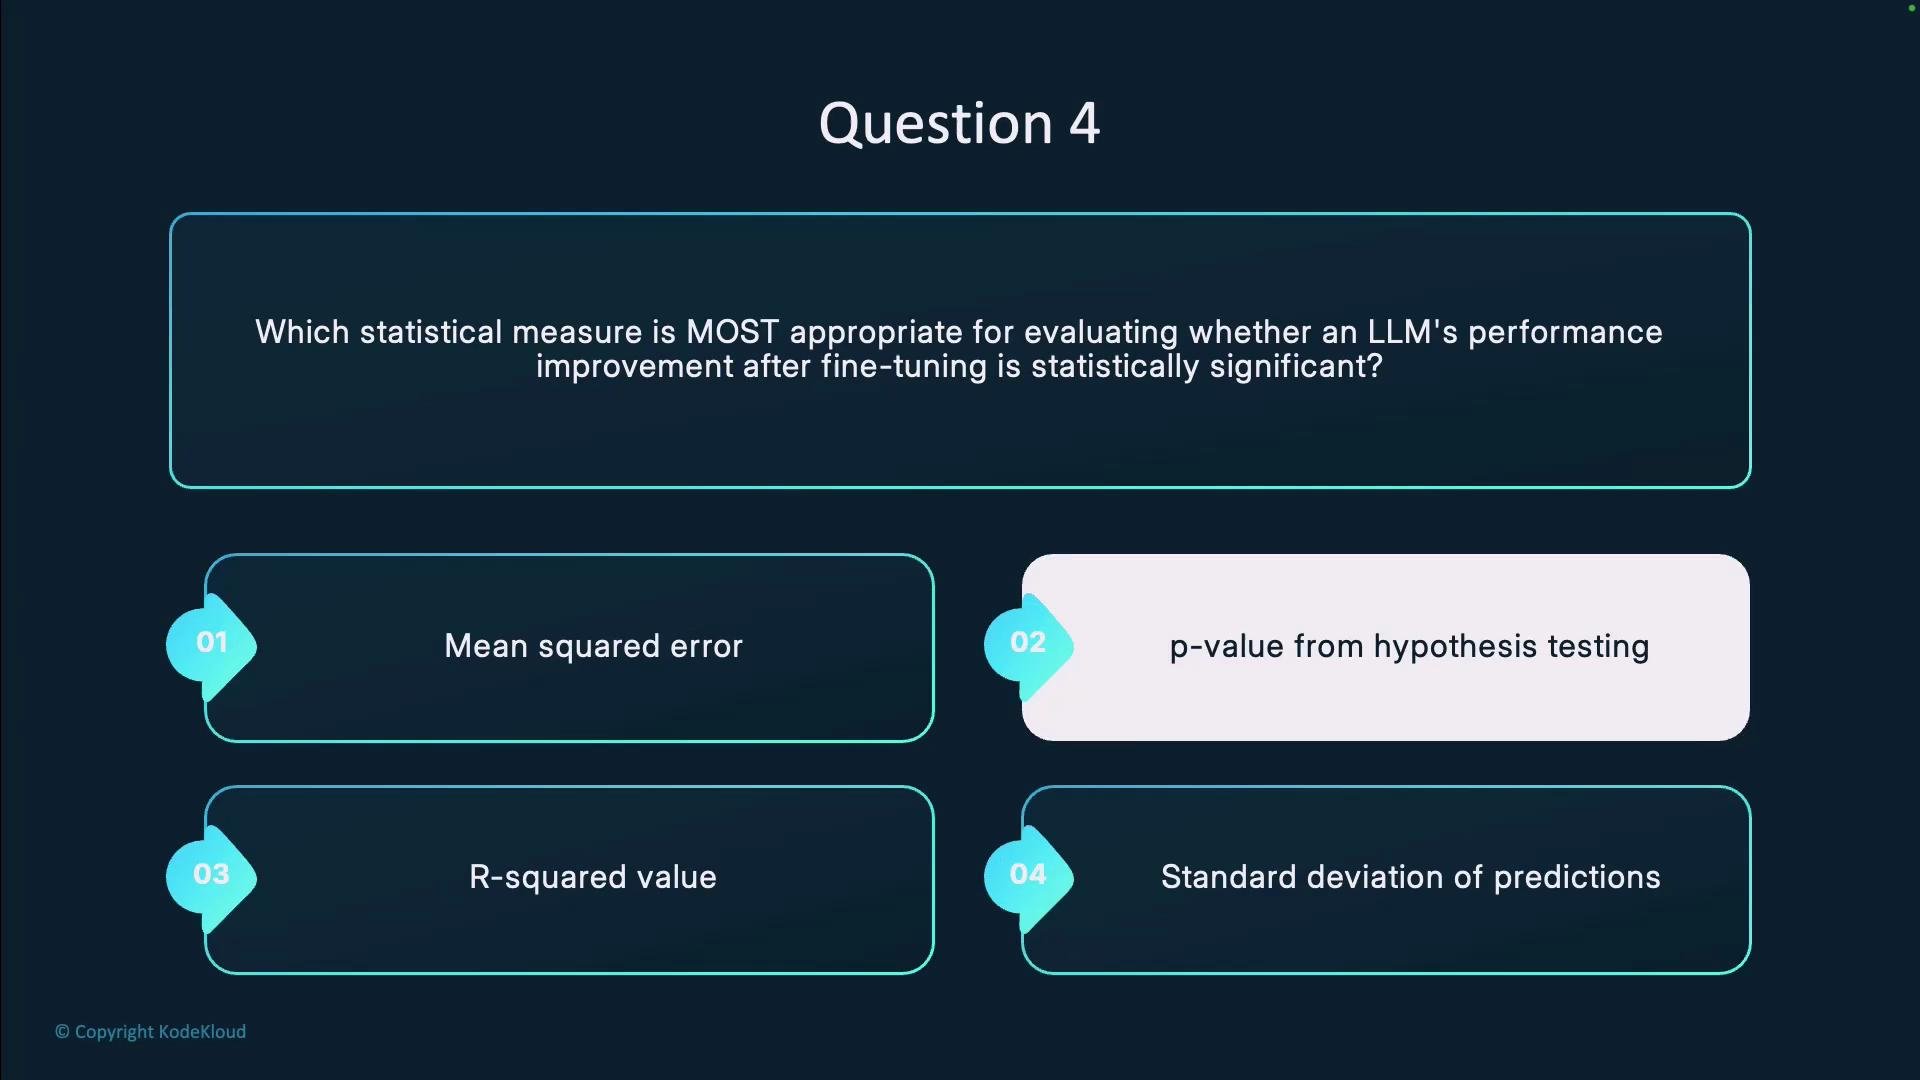
Question 4.
Which statistical measure is most appropriate for evaluating whether an LLM's performance improvement after fine-tuning is statistically significant?
Options:
* Mean Squared Error
* P-value from hypothesis testing
* R-squared value
* Standard deviation of predictions
Answer: [P-value](https://en.wikipedia.org/wiki/P-value) from [hypothesis testing](https://en.wikipedia.org/wiki/Statistical_hypothesis_testing)
The [p-value](https://en.wikipedia.org/wiki/P-value) from a correctly chosen [hypothesis test](https://en.wikipedia.org/wiki/Statistical_hypothesis_testing) is the primary statistic used to judge whether an observed performance difference between two model versions (e.g., base vs. fine-tuned) is unlikely to be due to random chance. It expresses the probability of observing results as extreme as the ones in your data under the null hypothesis (for example: "no difference in performance").
 Practical notes for using p-values to compare models:
* Select the hypothesis test that matches your evaluation design and data properties:
* Use a paired test (e.g., [paired t-test](https://en.wikipedia.org/wiki/Student%27s_t-test#Paired_t-test) or [Wilcoxon signed-rank test](https://en.wikipedia.org/wiki/Wilcoxon_signed-rank_test)) when the same prompts/test set are evaluated by both models.
* Use [permutation/randomization tests](https://en.wikipedia.org/wiki/Permutation_test) or [bootstrap methods](https://en.wikipedia.org/wiki/Bootstrapping_\(statistics\)) when normality or other parametric assumptions are questionable.
* Always report complementary statistics to give practical context:
* Effect size (e.g., [Cohen's d](https://en.wikipedia.org/wiki/Cohen%27s_d))
* Confidence intervals for metric differences
* Absolute metric changes (accuracy, F1, MSE, etc.)
* Correct for multiple comparisons when running many tests (multiple metrics, prompts, or model variants) using methods such as the [Bonferroni correction](https://en.wikipedia.org/wiki/Bonferroni_correction) or the [Benjamini–Hochberg procedure](https://en.wikipedia.org/wiki/Benjamini%E2%80%93Hochberg_procedure).
Table: Common tests and when to use them
| Test | When to use | Notes |
| ------------------------- | ---------------------------------------------------------------------------------------------------------------------------- | ------------------------------------------------------ |
| Paired t-test | Comparing continuous metrics on the same test items (paired samples) when differences are approximately normally distributed | Common and powerful when assumptions hold |
| Wilcoxon signed-rank test | Paired comparisons without normality assumption | Nonparametric alternative to paired t-test |
| Permutation test | Any paired/unpaired comparison; useful when distributional assumptions fail | Exact or approximate significance from label shuffling |
| Bootstrap | Estimating confidence intervals and stability of metrics | Useful for small samples and complex metrics |
Use hypothesis testing to determine whether observed improvements are unlikely under the null hypothesis, but always pair p-values with effect sizes and confidence intervals to communicate practical significance.
A small [p-value](https://en.wikipedia.org/wiki/P-value) does not guarantee a meaningful improvement. Large evaluation sets can produce tiny p-values for negligible effect sizes—always inspect absolute metric changes and effect sizes before declaring a meaningful gain.
Why the other options are less appropriate:
* Mean Squared Error (MSE): A performance metric that quantifies average squared errors; useful for reporting but not a statistical test of significance by itself.
* R-squared: Indicates proportion of variance explained in regression tasks; it does not test whether differences between model versions are statistically significant.
* Standard deviation of predictions: Measures variability of outputs but does not assess whether differences between model versions are unlikely under the null hypothesis.
In summary, use an appropriate hypothesis test and report the resulting p-value to assess statistical significance when comparing LLM performance after fine-tuning. Complement p-values with effect sizes, confidence intervals, and absolute metric differences to provide a complete, practically meaningful evaluation.
Practical notes for using p-values to compare models:
* Select the hypothesis test that matches your evaluation design and data properties:
* Use a paired test (e.g., [paired t-test](https://en.wikipedia.org/wiki/Student%27s_t-test#Paired_t-test) or [Wilcoxon signed-rank test](https://en.wikipedia.org/wiki/Wilcoxon_signed-rank_test)) when the same prompts/test set are evaluated by both models.
* Use [permutation/randomization tests](https://en.wikipedia.org/wiki/Permutation_test) or [bootstrap methods](https://en.wikipedia.org/wiki/Bootstrapping_\(statistics\)) when normality or other parametric assumptions are questionable.
* Always report complementary statistics to give practical context:
* Effect size (e.g., [Cohen's d](https://en.wikipedia.org/wiki/Cohen%27s_d))
* Confidence intervals for metric differences
* Absolute metric changes (accuracy, F1, MSE, etc.)
* Correct for multiple comparisons when running many tests (multiple metrics, prompts, or model variants) using methods such as the [Bonferroni correction](https://en.wikipedia.org/wiki/Bonferroni_correction) or the [Benjamini–Hochberg procedure](https://en.wikipedia.org/wiki/Benjamini%E2%80%93Hochberg_procedure).
Table: Common tests and when to use them
| Test | When to use | Notes |
| ------------------------- | ---------------------------------------------------------------------------------------------------------------------------- | ------------------------------------------------------ |
| Paired t-test | Comparing continuous metrics on the same test items (paired samples) when differences are approximately normally distributed | Common and powerful when assumptions hold |
| Wilcoxon signed-rank test | Paired comparisons without normality assumption | Nonparametric alternative to paired t-test |
| Permutation test | Any paired/unpaired comparison; useful when distributional assumptions fail | Exact or approximate significance from label shuffling |
| Bootstrap | Estimating confidence intervals and stability of metrics | Useful for small samples and complex metrics |
Use hypothesis testing to determine whether observed improvements are unlikely under the null hypothesis, but always pair p-values with effect sizes and confidence intervals to communicate practical significance.
A small [p-value](https://en.wikipedia.org/wiki/P-value) does not guarantee a meaningful improvement. Large evaluation sets can produce tiny p-values for negligible effect sizes—always inspect absolute metric changes and effect sizes before declaring a meaningful gain.
Why the other options are less appropriate:
* Mean Squared Error (MSE): A performance metric that quantifies average squared errors; useful for reporting but not a statistical test of significance by itself.
* R-squared: Indicates proportion of variance explained in regression tasks; it does not test whether differences between model versions are statistically significant.
* Standard deviation of predictions: Measures variability of outputs but does not assess whether differences between model versions are unlikely under the null hypothesis.
In summary, use an appropriate hypothesis test and report the resulting p-value to assess statistical significance when comparing LLM performance after fine-tuning. Complement p-values with effect sizes, confidence intervals, and absolute metric differences to provide a complete, practically meaningful evaluation.