> ## Documentation Index
> Fetch the complete documentation index at: https://notes.kodekloud.com/llms.txt
> Use this file to discover all available pages before exploring further.
# Model Selection for Imbalanced Data Accuracy vs F1
> Guidance on choosing LLM classifiers for imbalanced datasets, preferring F1 over accuracy and recommending per-class metrics, PR-AUC, and techniques to improve minority class performance
Welcome to the Data Analysis module from the [NVIDIA Generative AI LLMs Associate Certification](https://learn.kodekloud.com/user/courses/nvidia-generative-ai-llms-associate-certification).
Question 1
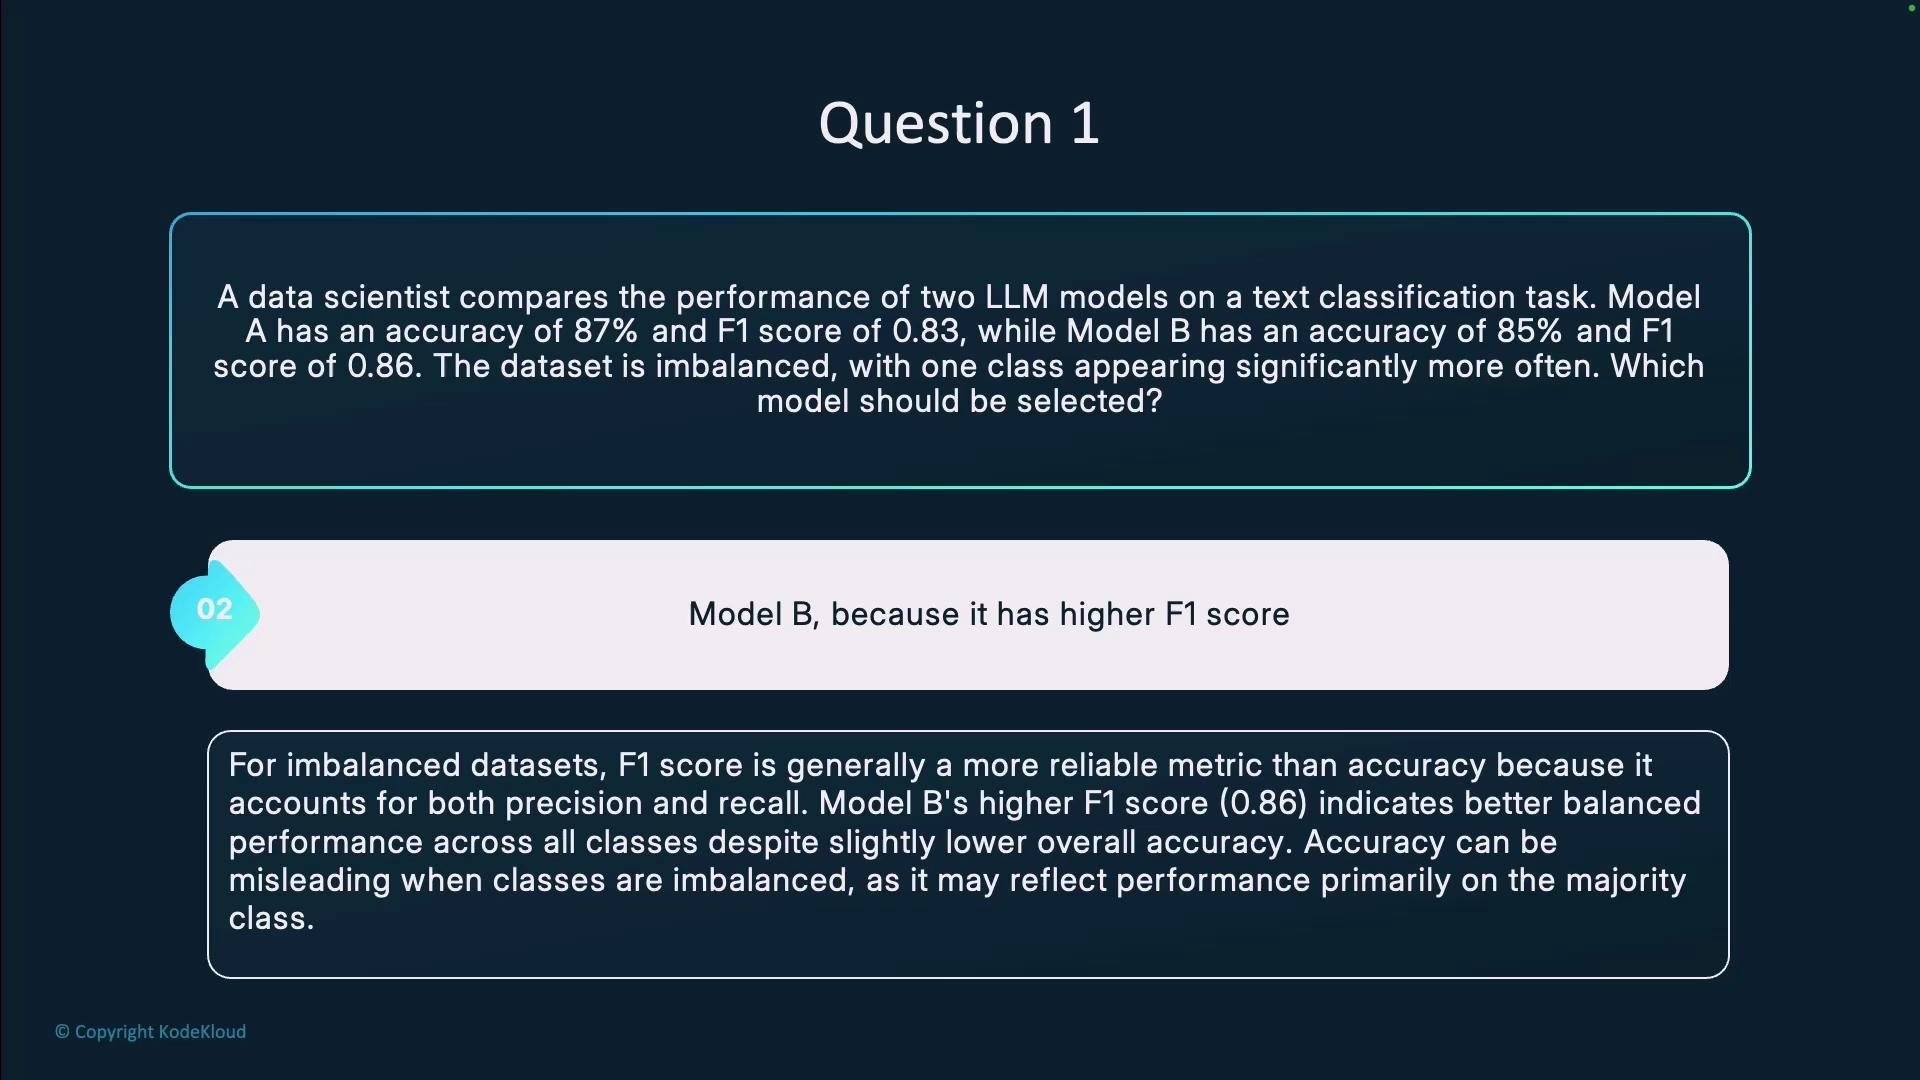
A data scientist compares two LLM models on a text classification task:
* Model A: accuracy = 87%, F1 = 0.83
* Model B: accuracy = 85%, F1 = 0.86
The dataset is imbalanced, with one class much more frequent than the other.
Which model should be selected?
* Model A, because it has higher accuracy.
* Model B, because it has a higher F1 score.
* Both models perform equally well, or neither model is suitable for imbalanced datasets.
Answer: Model B — it has the higher F1 score.
 Summary
* Although Model A shows higher overall accuracy, Model B is the better choice for imbalanced datasets because its higher F1 score (0.86) indicates a healthier balance between precision and recall on the minority class.
* Accuracy can be misleading when class distribution is skewed: a trivial classifier that always predicts the majority class can still yield high accuracy while failing to identify the minority class.
Metric definitions and quick formulas
| Metric | What it measures | Formula |
| -------------------- | ------------------------------------------------------ | ------------------------------------------------------ |
| Precision | Of predicted positives, how many are actually positive | `Precision = TP / (TP + FP)` |
| Recall (Sensitivity) | Of actual positives, how many did we detect | `Recall = TP / (TP + FN)` |
| F1 score | Harmonic mean of precision and recall — balances both | `F1 = 2 * (Precision * Recall) / (Precision + Recall)` |
| Accuracy | Overall fraction of correct predictions | `Accuracy = (TP + TN) / (TP + TN + FP + FN)` |
Why F1 is preferable for imbalanced classes
* F1 combines precision and recall, so it penalizes models that achieve high accuracy by only predicting the majority class.
* When the minority class is important (e.g., fraud detection, disease diagnosis), missing positives (low recall) or producing many false positives (low precision) are both costly — F1 captures both types of errors.
* Use macro-F1 to treat classes equally, and weighted-F1 to account for class frequency while still exposing poor minority-class performance.
When to prefer which metric
* Prefer F1 / macro-F1 / weighted-F1: imbalanced datasets, minority-class importance, or class-wise performance matters.
* Use PR-AUC (precision-recall AUC) for rare positive classes — PR curves emphasize performance on the positive class.
* Use ROC-AUC only when classes are reasonably balanced or when you want a threshold-agnostic measure and false positive/negative costs are similar. In extreme imbalance, ROC-AUC can be overly optimistic.
* Accuracy is acceptable when classes are balanced and the costs of different error types are similar.
Practical evaluation checklist
* Inspect the confusion matrix and per-class precision/recall — don’t rely solely on a single scalar like accuracy.
* Report multiple metrics: `precision`, `recall`, `F1`, `macro-F1`, `weighted-F1`, and `PR-AUC` where applicable.
* Consider business impact: define whether false positives or false negatives are more costly and tune thresholds accordingly.
* Improve minority-class performance if needed:
* Class weighting in the loss function.
* Resampling: oversample minority class (SMOTE, ADASYN) or undersample majority class.
* Use ensemble methods or specialized algorithms for imbalanced data.
* Calibrate classification thresholds based on precision/recall trade-offs.
Practical example (intuition)
* If 90% of the data is class A and 10% is class B, a model that always predicts class A gets 90% accuracy but zero recall on class B. F1 for class B will be 0 — clearly showing the model is useless for the minority class despite high accuracy.
Recommendations for this scenario
* Choose Model B because its higher F1 (0.86) signals better balance between precision and recall for the minority class, which is the key concern in imbalanced datasets.
* Report per-class metrics and include macro-F1 / weighted-F1 in any model comparison to make decisions transparent.
When classes are imbalanced, favor F1-based metrics and per-class evaluation (precision, recall, confusion matrix). Model B is the better choice here because its higher F1 indicates more balanced performance across classes despite slightly lower accuracy.
Links and references
* [Precision and Recall — Wikipedia](https://en.wikipedia.org/wiki/Precision_and_recall)
* [Understanding the ROC Curve — Towards Data Science](https://towardsdatascience.com/understanding-the-roc-curve-8ffa8b5e0a76)
* [Scikit-learn metrics — Precision, Recall, F1](https://scikit-learn.org/stable/modules/model_evaluation.html#precision-recall-f-measures)
Summary
* Although Model A shows higher overall accuracy, Model B is the better choice for imbalanced datasets because its higher F1 score (0.86) indicates a healthier balance between precision and recall on the minority class.
* Accuracy can be misleading when class distribution is skewed: a trivial classifier that always predicts the majority class can still yield high accuracy while failing to identify the minority class.
Metric definitions and quick formulas
| Metric | What it measures | Formula |
| -------------------- | ------------------------------------------------------ | ------------------------------------------------------ |
| Precision | Of predicted positives, how many are actually positive | `Precision = TP / (TP + FP)` |
| Recall (Sensitivity) | Of actual positives, how many did we detect | `Recall = TP / (TP + FN)` |
| F1 score | Harmonic mean of precision and recall — balances both | `F1 = 2 * (Precision * Recall) / (Precision + Recall)` |
| Accuracy | Overall fraction of correct predictions | `Accuracy = (TP + TN) / (TP + TN + FP + FN)` |
Why F1 is preferable for imbalanced classes
* F1 combines precision and recall, so it penalizes models that achieve high accuracy by only predicting the majority class.
* When the minority class is important (e.g., fraud detection, disease diagnosis), missing positives (low recall) or producing many false positives (low precision) are both costly — F1 captures both types of errors.
* Use macro-F1 to treat classes equally, and weighted-F1 to account for class frequency while still exposing poor minority-class performance.
When to prefer which metric
* Prefer F1 / macro-F1 / weighted-F1: imbalanced datasets, minority-class importance, or class-wise performance matters.
* Use PR-AUC (precision-recall AUC) for rare positive classes — PR curves emphasize performance on the positive class.
* Use ROC-AUC only when classes are reasonably balanced or when you want a threshold-agnostic measure and false positive/negative costs are similar. In extreme imbalance, ROC-AUC can be overly optimistic.
* Accuracy is acceptable when classes are balanced and the costs of different error types are similar.
Practical evaluation checklist
* Inspect the confusion matrix and per-class precision/recall — don’t rely solely on a single scalar like accuracy.
* Report multiple metrics: `precision`, `recall`, `F1`, `macro-F1`, `weighted-F1`, and `PR-AUC` where applicable.
* Consider business impact: define whether false positives or false negatives are more costly and tune thresholds accordingly.
* Improve minority-class performance if needed:
* Class weighting in the loss function.
* Resampling: oversample minority class (SMOTE, ADASYN) or undersample majority class.
* Use ensemble methods or specialized algorithms for imbalanced data.
* Calibrate classification thresholds based on precision/recall trade-offs.
Practical example (intuition)
* If 90% of the data is class A and 10% is class B, a model that always predicts class A gets 90% accuracy but zero recall on class B. F1 for class B will be 0 — clearly showing the model is useless for the minority class despite high accuracy.
Recommendations for this scenario
* Choose Model B because its higher F1 (0.86) signals better balance between precision and recall for the minority class, which is the key concern in imbalanced datasets.
* Report per-class metrics and include macro-F1 / weighted-F1 in any model comparison to make decisions transparent.
When classes are imbalanced, favor F1-based metrics and per-class evaluation (precision, recall, confusion matrix). Model B is the better choice here because its higher F1 indicates more balanced performance across classes despite slightly lower accuracy.
Links and references
* [Precision and Recall — Wikipedia](https://en.wikipedia.org/wiki/Precision_and_recall)
* [Understanding the ROC Curve — Towards Data Science](https://towardsdatascience.com/understanding-the-roc-curve-8ffa8b5e0a76)
* [Scikit-learn metrics — Precision, Recall, F1](https://scikit-learn.org/stable/modules/model_evaluation.html#precision-recall-f-measures)