> ## Documentation Index
> Fetch the complete documentation index at: https://notes.kodekloud.com/llms.txt
> Use this file to discover all available pages before exploring further.
# Rigorous Statistical Comparison of Two LLM Models
> Guidelines for rigorously comparing two LLMs using paired per-example statistical tests, recommended tests, reporting practices, and a practical checklist to ensure valid significance and effect size estimation.
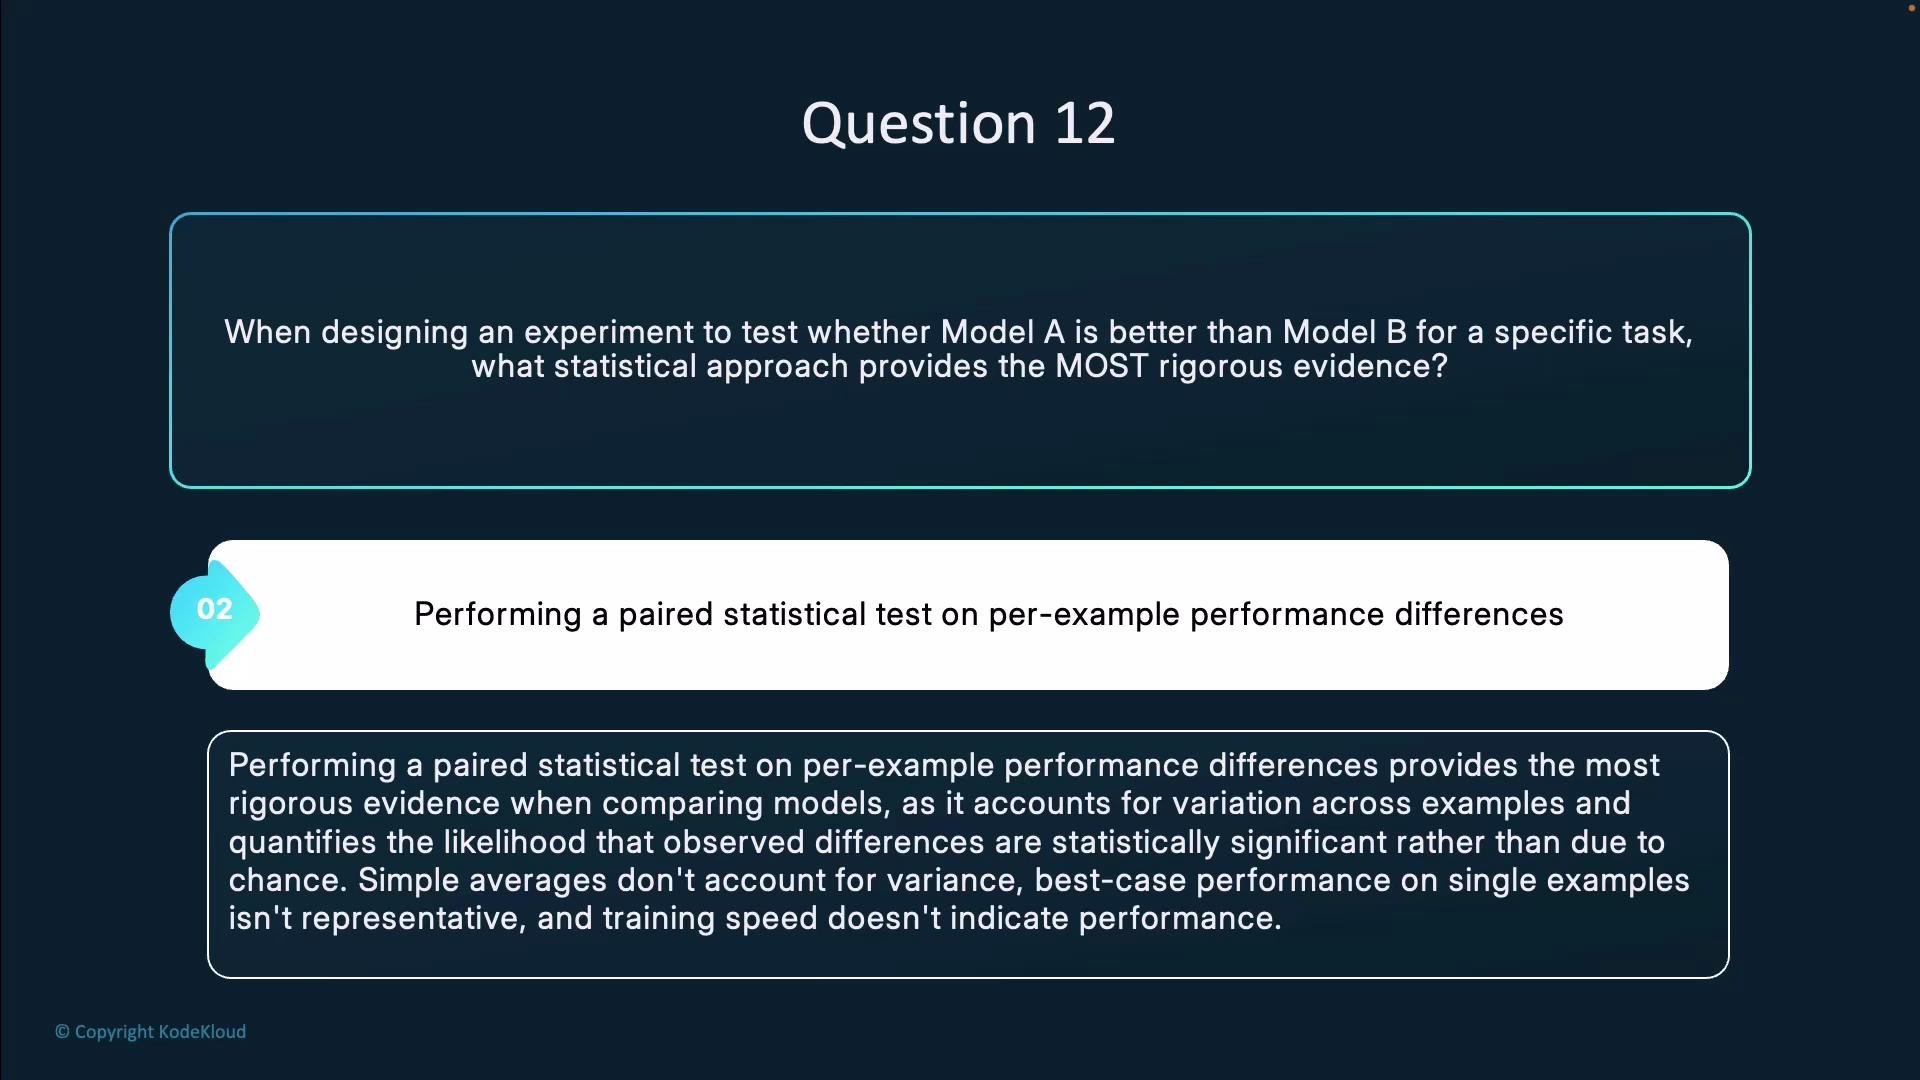
Question 12.
When designing an experiment to test whether Model A is better than Model B for a specific task, which statistical approach provides the most rigorous evidence?
* Calculating the average performance of each model on the test set?
* Performing a paired statistical test on per-example performance differences?
* Comparing the best performance each model achieves on any single example?
* Measuring how quickly each model was trained?
Answer: Performing a paired statistical test on per-example performance differences.
Why this is the best approach
* It compares models on the same examples, controlling for example-level difficulty and increasing statistical power.
* It preserves per-example variance instead of averaging it away, which helps detect consistent differences rather than extreme outliers.
* It yields a formal probability (p-value) and can be paired with effect-size and confidence-interval estimates to quantify practical significance.
Recommended paired tests by outcome type
| Outcome type | Recommended paired test(s) | When to use |
| ------------------------------------------------------------------------------------------------------------- | ------------------------------------ | ------------------------------------------------------------------ |
| Continuous or approximately continuous scores (e.g., BLEU, accuracy over many classes represented as numeric) | `paired t-test` | Use when per-example differences are roughly normally distributed. |
| Continuous but non-normal or small sample | `Wilcoxon signed-rank test` | Nonparametric alternative to the paired t-test. |
| Paired binary/categorical outcomes (e.g., correct vs incorrect) | `McNemar's test` | Compares discordant pairs for binary outcomes. |
| Any distribution / flexible approach | Paired permutation test or bootstrap | Useful when assumptions for parametric tests do not hold. |
Practical checklist for a rigorous comparison
1. Define the evaluation metric at the example level (e.g., correct/incorrect, per-example score).
2. Evaluate both models on the exact same test examples to enable paired comparisons.
3. Compute per-example differences: `diff_i = score_A(i) - score_B(i)`.
4. Inspect the differences for distributional assumptions (histogram, Q-Q plot).
5. Select the appropriate paired test (see table).
6. Report: test statistic, p-value, effect size (e.g., Cohen’s d or median difference), and confidence interval.
7. If you run multiple hypotheses (e.g., many tasks or metrics), correct for multiple comparisons (Bonferroni, Holm, or false discovery rate methods).
8. Share code and the example-level results so others can reproduce the test.
Always report both statistical significance and effect size. A small p-value can be meaningless if the effect is tiny; conversely, a large effect with insufficient sample size can be inconclusive without a confidence interval.
 Why the other options are insufficient
* Simple averages: Ignore per-example variance and may mask consistent but small differences across many examples.
* Best-case single-example performance: Extremely sensitive to outliers and not representative of overall behavior.
* Training speed: Relevant for engineering trade-offs but unrelated to held-out evaluation performance on the target task.
Avoid unpaired comparisons or using only aggregate metrics for hypothesis testing. Always pair examples between models, check test assumptions, and guard against data leakage and multiple comparisons.
Links and references
* Paired t-test: [https://en.wikipedia.org/wiki/Paired\_t-test](https://en.wikipedia.org/wiki/Paired_t-test)
* Wilcoxon signed-rank test: [https://en.wikipedia.org/wiki/Wilcoxon\_signed-rank\_test](https://en.wikipedia.org/wiki/Wilcoxon_signed-rank_test)
* McNemar's test: [https://en.wikipedia.org/wiki/McNemar%27s\_test](https://en.wikipedia.org/wiki/McNemar%27s_test)
* Permutation tests and bootstrap methods: [https://en.wikipedia.org/wiki/Permutation\_test](https://en.wikipedia.org/wiki/Permutation_test)
Table of related resources
| Resource | Description |
| --------------- | ----------------------------------------------------------------------------------------------------- |
| `scipy.stats` | Common implementations for `ttest_rel`, `wilcoxon`, `mcnemar` via statsmodels or other packages. |
| Practical guide | Papers and blogs on reporting p-values, effect sizes, and confidence intervals in NLP/ML evaluations. |
Why the other options are insufficient
* Simple averages: Ignore per-example variance and may mask consistent but small differences across many examples.
* Best-case single-example performance: Extremely sensitive to outliers and not representative of overall behavior.
* Training speed: Relevant for engineering trade-offs but unrelated to held-out evaluation performance on the target task.
Avoid unpaired comparisons or using only aggregate metrics for hypothesis testing. Always pair examples between models, check test assumptions, and guard against data leakage and multiple comparisons.
Links and references
* Paired t-test: [https://en.wikipedia.org/wiki/Paired\_t-test](https://en.wikipedia.org/wiki/Paired_t-test)
* Wilcoxon signed-rank test: [https://en.wikipedia.org/wiki/Wilcoxon\_signed-rank\_test](https://en.wikipedia.org/wiki/Wilcoxon_signed-rank_test)
* McNemar's test: [https://en.wikipedia.org/wiki/McNemar%27s\_test](https://en.wikipedia.org/wiki/McNemar%27s_test)
* Permutation tests and bootstrap methods: [https://en.wikipedia.org/wiki/Permutation\_test](https://en.wikipedia.org/wiki/Permutation_test)
Table of related resources
| Resource | Description |
| --------------- | ----------------------------------------------------------------------------------------------------- |
| `scipy.stats` | Common implementations for `ttest_rel`, `wilcoxon`, `mcnemar` via statsmodels or other packages. |
| Practical guide | Papers and blogs on reporting p-values, effect sizes, and confidence intervals in NLP/ML evaluations. |