> ## Documentation Index
> Fetch the complete documentation index at: https://notes.kodekloud.com/llms.txt
> Use this file to discover all available pages before exploring further.
# Monitoring High Throughput LLM Production Performance
> Explains monitoring high-throughput LLM production performance, recommending tokens per second as the primary metric and offering measurement, optimization, and diagnostic tips
Welcome to this section of the [NVIDIA Generative AI LLMs Associate Certification](https://learn.kodekloud.com/user/courses/nvidia-generative-ai-llms-associate-certification) — Software Development.
## Question 1
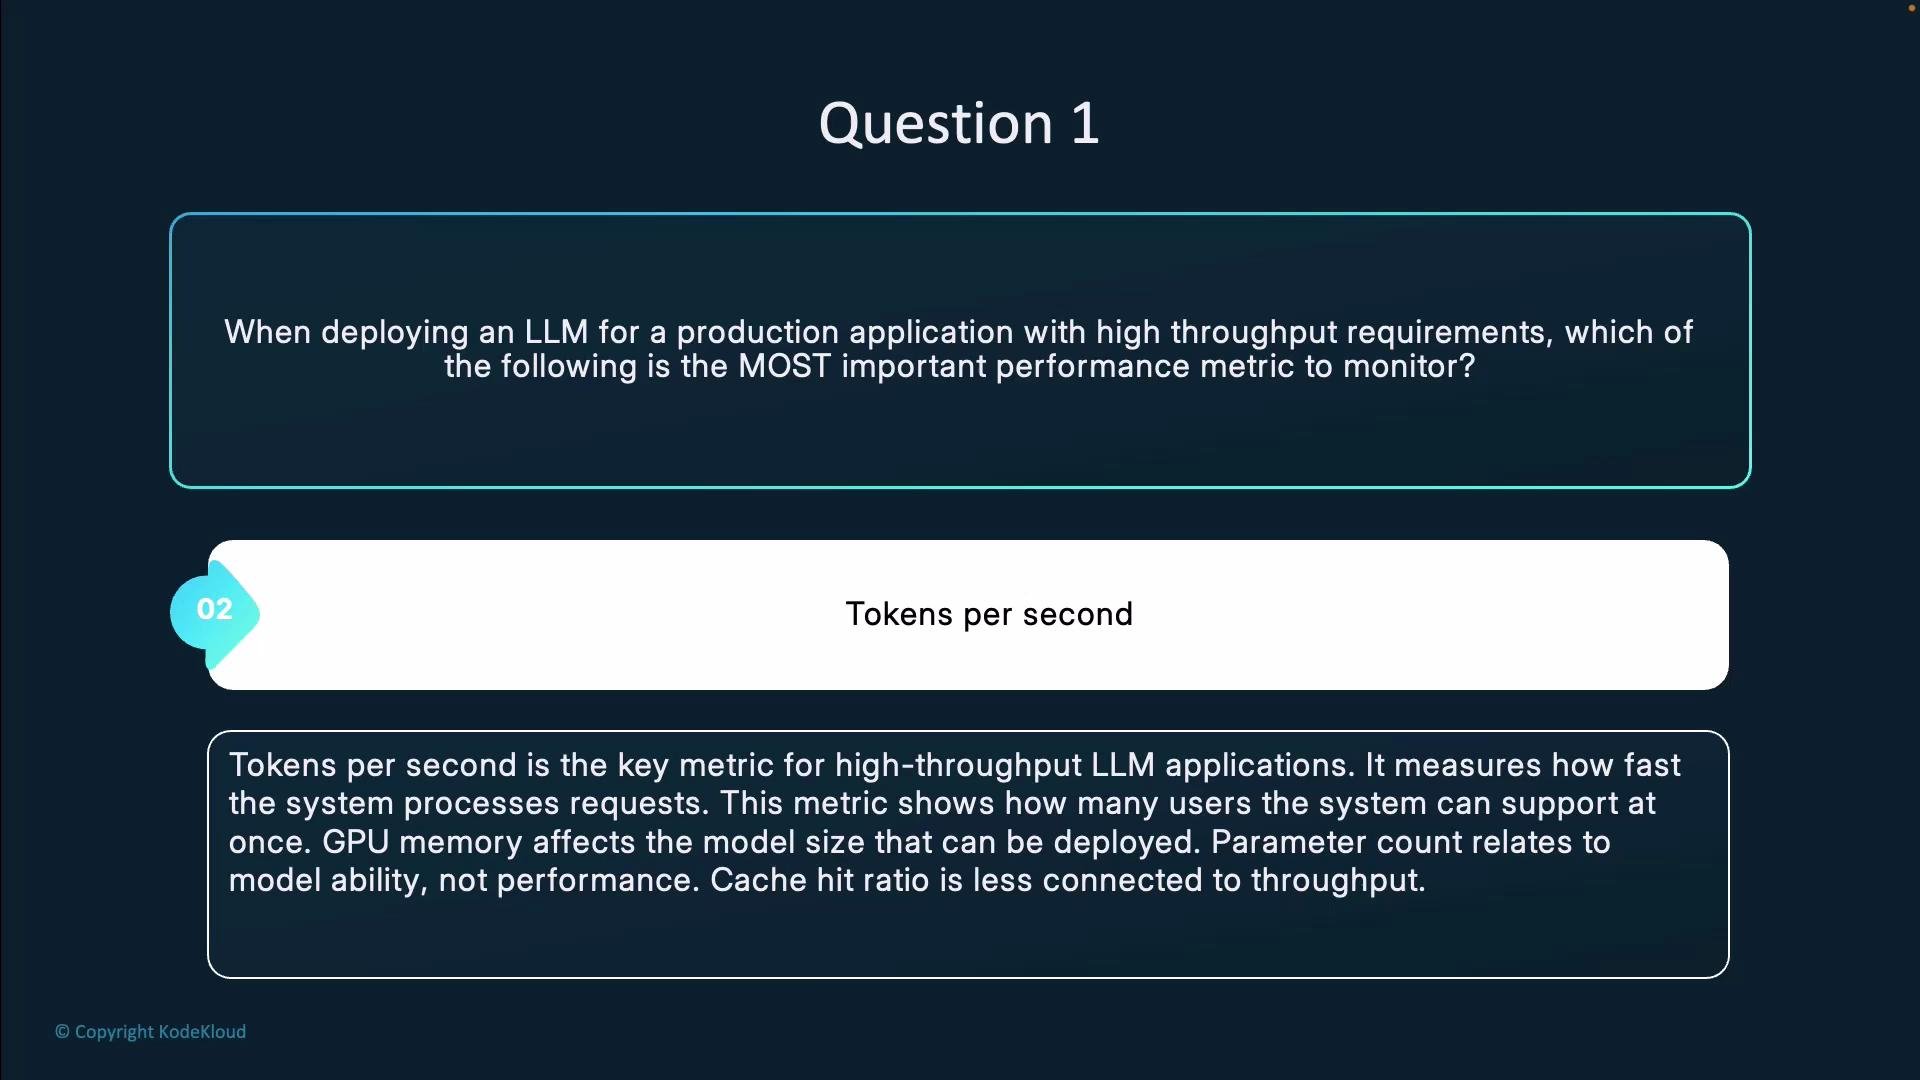
When deploying an LLM for a production application with high-throughput requirements, which of the following is the most important performance metric to monitor?
* GPU memory utilization
* Tokens per second
* Model parameter count
* Cache hit ratio
Answer: Tokens per second
Tokens per second (TPS) is the primary metric for high-throughput LLM applications because it measures the actual serving throughput — how many tokens your system generates or processes per unit time. TPS captures end-to-end behavior (including batching, parallelism, and I/O), and directly maps to capacity planning (concurrent users, requests per second, SLA fulfillment).
Why TPS is the most important metric
* TPS reflects real user-facing throughput and is actionable for scaling and optimization decisions.
* Optimizations that increase TPS (better batching, improved GPU utilization, model parallelism, lower latency per token) directly increase the number of users you can serve.
* TPS captures effects of system-level factors (serializer/deserializer overhead, network latency, and model compute) that individual resource metrics alone do not show.
How to think about the other metrics
* GPU memory utilization: Important for determining fit of model and batch sizes on hardware, preventing OOMs, and guiding quantization or model sharding choices. Indirectly impacts TPS by limiting batch sizes or causing memory thrashing.
* Model parameter count: Describes model capacity and quality, not runtime throughput. Larger models often reduce TPS but may be required for accuracy trade-offs.
* Cache hit ratio: Improves effective throughput for repeated or similar requests by avoiding computation, but it’s workload-dependent. Cache effectiveness should be interpreted together with TPS.
Practical tips to measure and improve TPS
* Measure TPS directly: `TPS = tokens_processed / elapsed_seconds`. Instrument request handlers to emit tokens produced and time taken.
* Use batching: Group multiple requests into a single batch to amortize compute cost per token.
* Optimize model execution: Mixed precision (AMP), model quantization, weight sharding, and inference engines (e.g., NVIDIA Triton) often yield higher TPS.
* Profile end-to-end: Track CPU, GPU, memory, I/O, and network to identify bottlenecks that limit TPS (e.g., small batch sizes, data preprocessing overhead).
* Autoscale based on TPS and latency targets rather than only CPU/GPU utilization.
Comparison table — what to monitor and why
| Metric | Why it matters | How to monitor / optimize |
| ---------------------- | ------------------------------------------------------------------- | -------------------------------------------------------------------------------------------------------- |
| Tokens per second | Direct measure of serving capacity and throughput | Instrument requests, emit `tokens_processed` and elapsed time; autoscale or tune batching by TPS targets |
| GPU memory utilization | Determines max model size and feasible batch size | NVIDIA DCGM, `nvidia-smi`; use quantization, model sharding, or larger instance types to fit models |
| Model parameter count | Indicates capacity/quality of model (not runtime throughput) | Choose model size based on accuracy/throughput trade-offs; consider distillation or smaller variants |
| Cache hit ratio | Reduces compute for repeatable queries and lowers effective latency | Measure hits/misses; tune cache TTL and cache keys; combine cache metrics with TPS to judge benefit |
Monitor tokens per second as your primary throughput metric, and use GPU memory utilization, cache hit ratio, and latency metrics to diagnose and optimize bottlenecks. Instrument your inference pipeline to emit TPS so autoscaling and optimization are driven by the user-facing capacity metric.
 References and further reading
* NVIDIA Triton Inference Server: [https://developer.nvidia.com/nvidia-triton-inference-server](https://developer.nvidia.com/nvidia-triton-inference-server)
* NVIDIA Data Center GPU Manager (DCGM): [https://developer.nvidia.com/dcgm](https://developer.nvidia.com/dcgm)
* Best practices for serving LLMs and throughput optimization: see vendor docs (Triton, Hugging Face Inference, NVIDIA guides) and profiling tools (nsight, DCGM, Prometheus)
References and further reading
* NVIDIA Triton Inference Server: [https://developer.nvidia.com/nvidia-triton-inference-server](https://developer.nvidia.com/nvidia-triton-inference-server)
* NVIDIA Data Center GPU Manager (DCGM): [https://developer.nvidia.com/dcgm](https://developer.nvidia.com/dcgm)
* Best practices for serving LLMs and throughput optimization: see vendor docs (Triton, Hugging Face Inference, NVIDIA guides) and profiling tools (nsight, DCGM, Prometheus)