> ## Documentation Index
> Fetch the complete documentation index at: https://notes.kodekloud.com/llms.txt
> Use this file to discover all available pages before exploring further.
# Demo Monitoring
> Guide to installing the Datadog Agent on Ubuntu EC2 and enabling NGINX stub status integration to collect system and NGINX metrics, view dashboards and create alerts
In this lesson you'll install the Datadog Agent on an Ubuntu EC2 instance and enable Datadog's NGINX integration so the agent can collect system metrics (CPU, memory, disk I/O, network) and NGINX `stub_status` metrics (active connections, requests, reading/writing/waiting). You will need a Datadog account and an API key to follow along.
Sign up for a [Datadog trial account](https://www.datadoghq.com/) if you don't have one. During onboarding, copy the one-line agent install command and your API key — you'll use them on your EC2 host.
## Prerequisites
* Ubuntu/Debian EC2 instance with sudo access.
* NGINX installed and running on the instance.
* Datadog account and API key.
* Basic familiarity with editing NGINX configuration files and reloading the service.
## 1. Install the Datadog Agent
From the Datadog web UI choose the correct OS (Ubuntu/Debian) and copy the one-line install command. Replace `` with your Datadog API key and set `DD_SITE` to the appropriate Datadog site (for example, `datadoghq.eu` for the EU region). Example command:
```bash theme={null}
DD_API_KEY="" DD_SITE="datadoghq.eu" bash -c "$(curl -L https://install.datadoghq.com/scripts/install_script_agent7.sh)"
```
Run that command on your EC2 instance. The installer will:
* Add the Datadog apt repository and import signing keys.
* Install the `datadog-agent` package.
* Start the Datadog Agent service.
Example excerpt from a successful install:
```bash theme={null}
gpg: key E6266D4AC0962C7D: "Datadog, Inc. APT key (2023-04-20) (APT key) " not changed
Get:2 https://apt.datadoghq.com stable Release [26.0 kB]
Get:5 https://apt.datadoghq.com stable/7 amd64 Packages [92.1 kB]
Fetched 252 MB in 3s (95.5 MB/s)
Selecting previously unselected package datadog-agent.
Preparing to unpack .../datadog-agent_1%3a7.62.3-1_amd64.deb ...
Unpacking datadog-agent (1:7.62.3-1) ...
Setting up datadog-agent (1:7.62.3-1) ...
datadog-agent start/running, process 1234
```
The install can take a few minutes. After completion, Datadog will begin reporting the host to the Datadog web app. Visit Datadog → Dashboards → Hosts to see your host and system metrics.
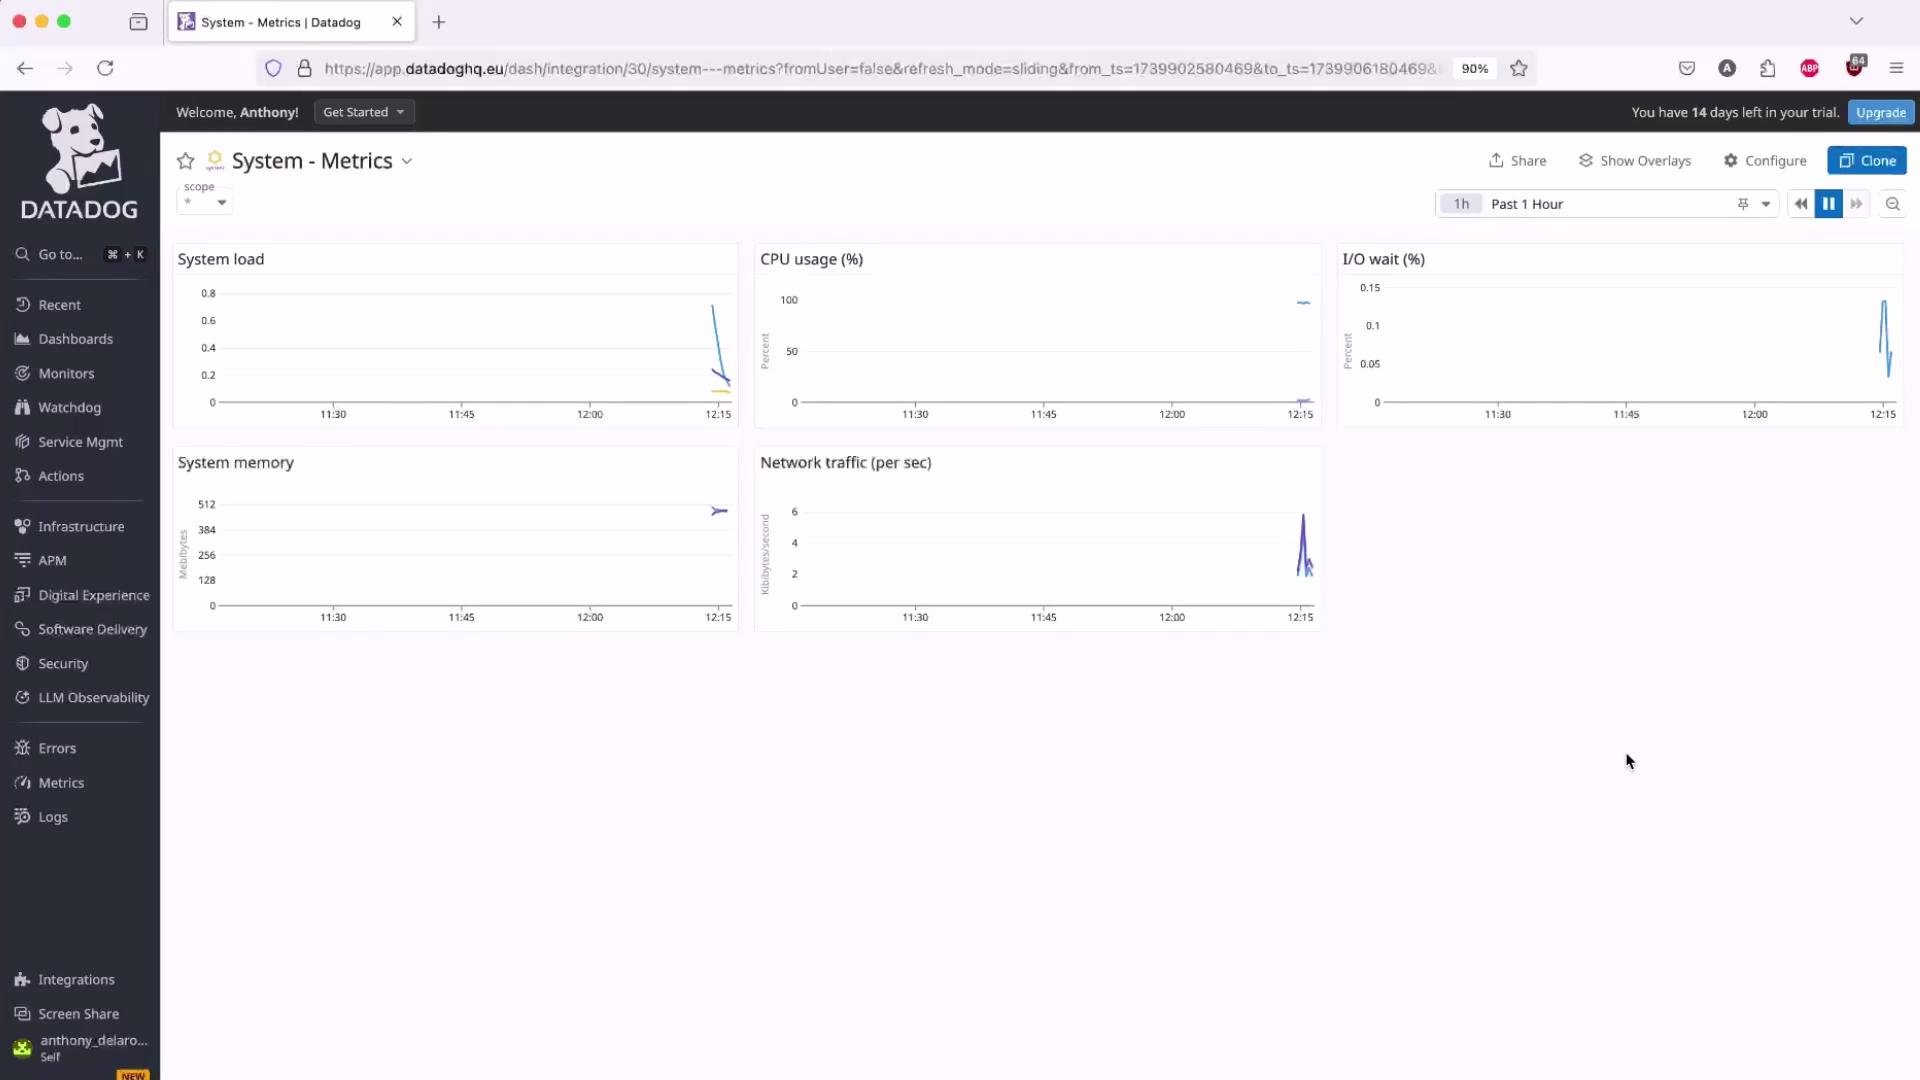
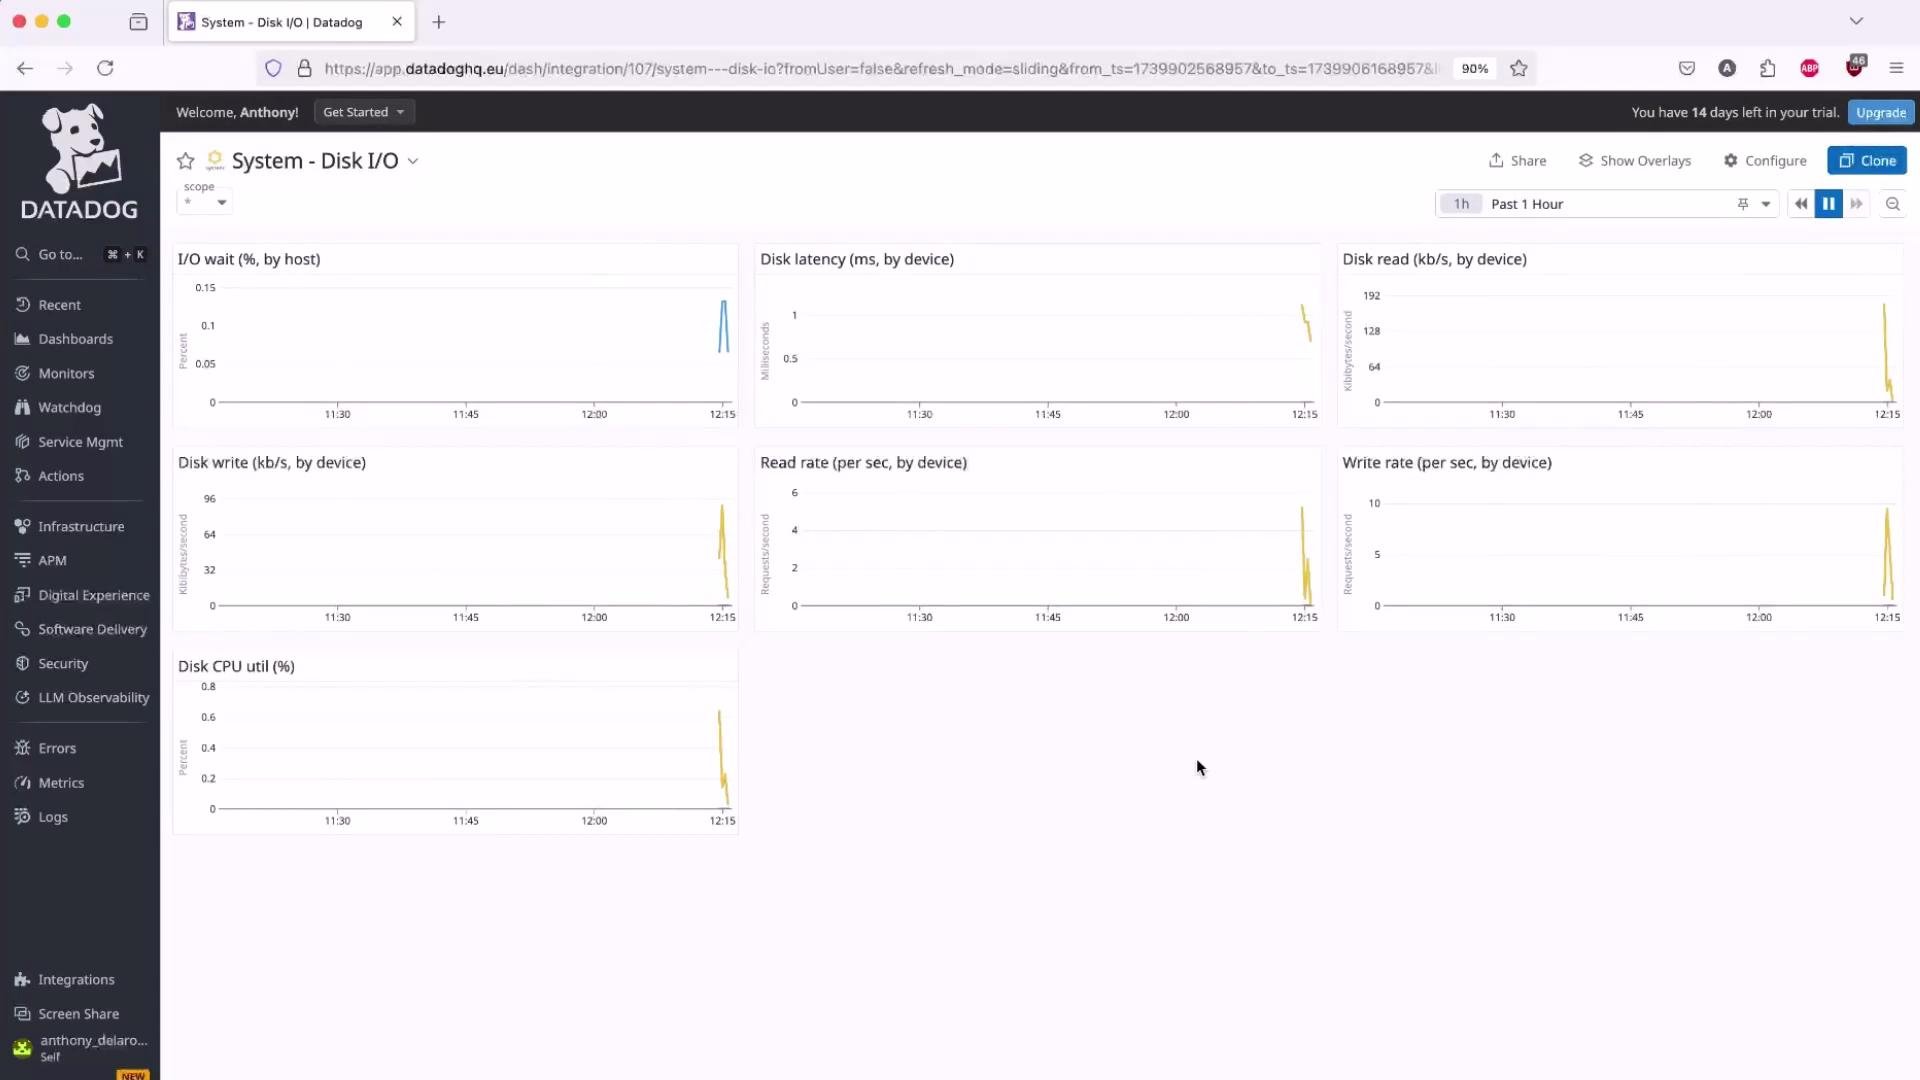 You should begin to see system metrics (CPU, memory, disk I/O, network, etc.) appear in Datadog.
 ## 2. Enable the NGINX integration (stub\_status)
Datadog needs a locally reachable NGINX `stub_status` endpoint to collect NGINX metrics. The safest approach is to expose this endpoint only to `localhost`, so the agent (running on the same host) can scrape it while external access remains blocked.
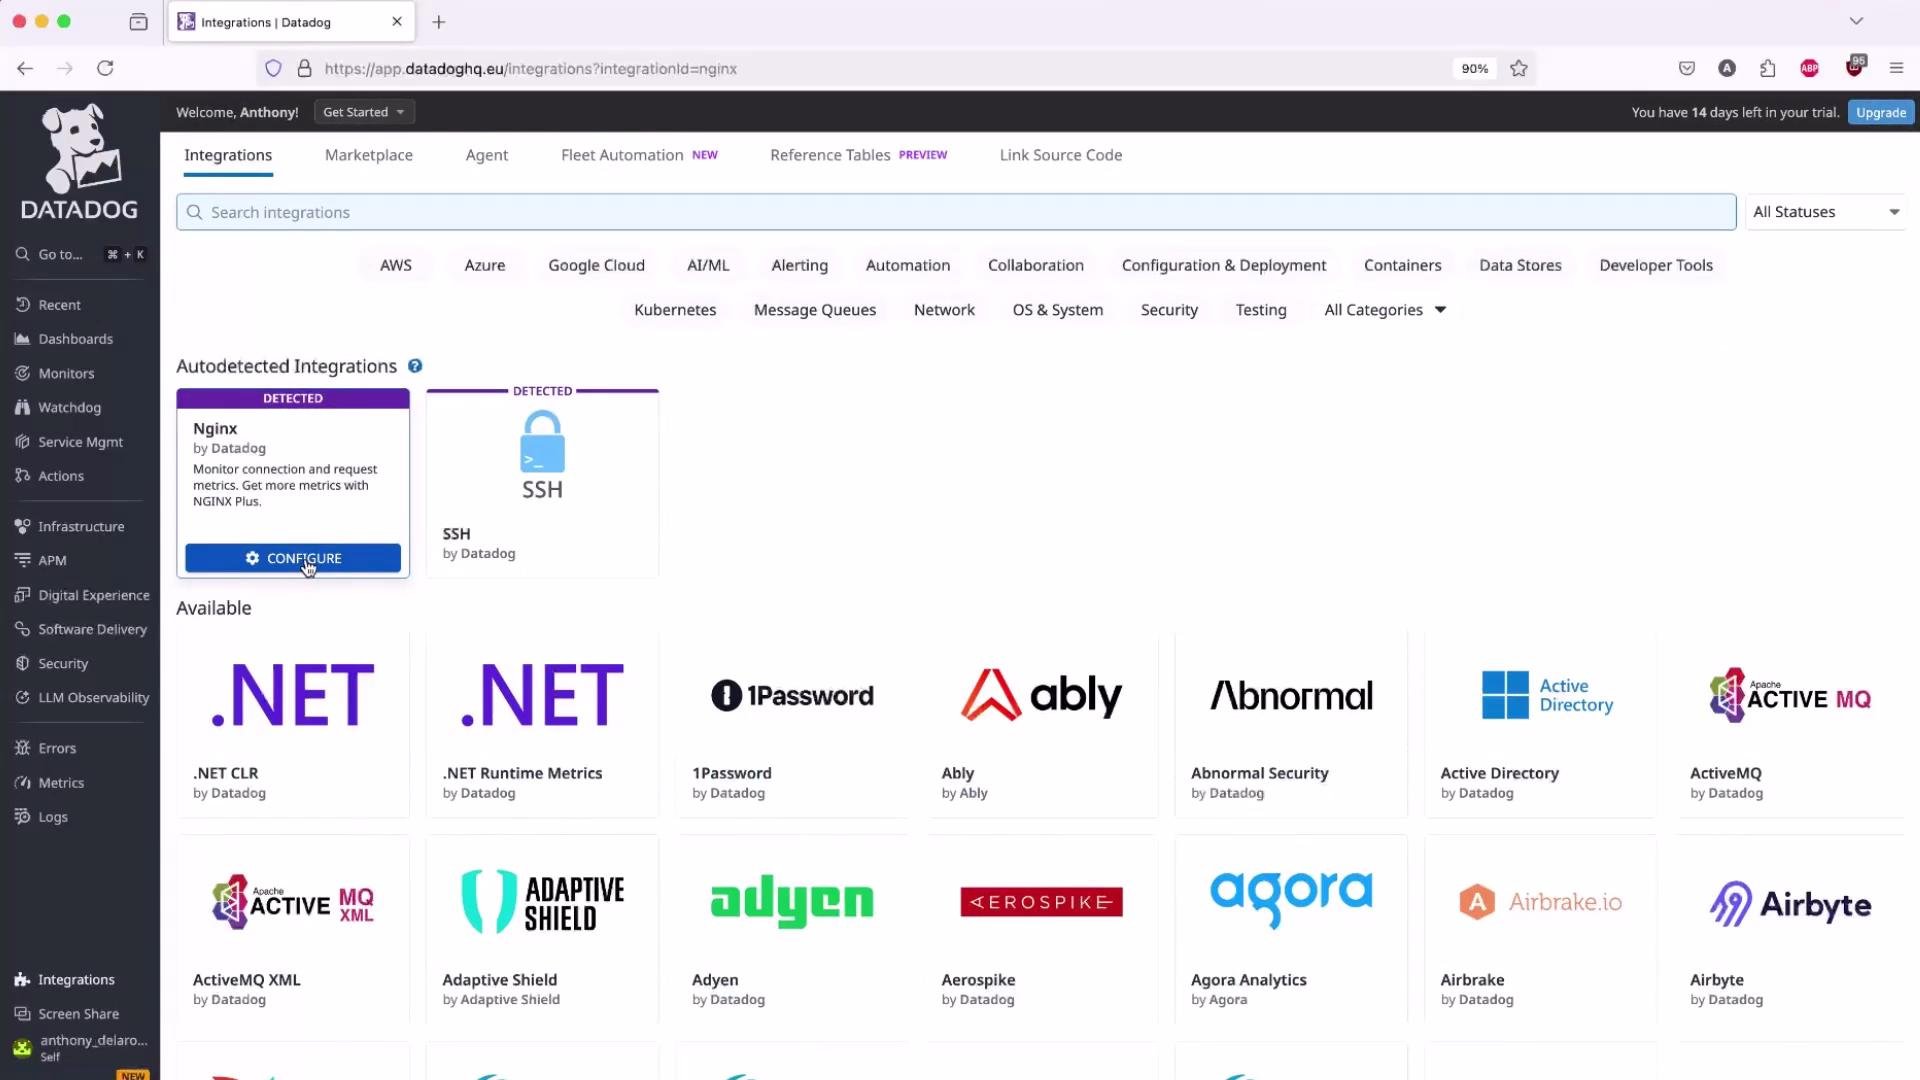
Go to Datadog → Integrations → Integrations and search for "NGINX". Datadog may autodetect NGINX on your host.
## 2. Enable the NGINX integration (stub\_status)
Datadog needs a locally reachable NGINX `stub_status` endpoint to collect NGINX metrics. The safest approach is to expose this endpoint only to `localhost`, so the agent (running on the same host) can scrape it while external access remains blocked.
Go to Datadog → Integrations → Integrations and search for "NGINX". Datadog may autodetect NGINX on your host.
 Follow these steps to enable and configure the integration:
1. Verify your NGINX has the `stub_status` module:
```bash theme={null}
nginx -V 2>&1 | grep -o http_stub_status_module || true
```
If the output includes `http_stub_status_module`, the module is present.
2. Configure NGINX to expose `stub_status` on `localhost`. A common pattern is to listen on `127.0.0.1:81` and restrict access to the loopback interface. Add a server block (for example in `/etc/nginx/sites-available/example-https` or another site file):
```nginx theme={null}
server {
listen 127.0.0.1:81;
server_name localhost;
access_log off;
allow 127.0.0.1;
deny all;
location /nginx_status {
# Open source NGINX stub status
stub_status;
# For older open source NGINX (<1.7.5) the syntax may be:
# stub_status on;
# NGINX Plus users may use:
# status;
# ensure version info is available
server_tokens on;
}
}
```
This configuration:
* Listens on `127.0.0.1:81` so only the local host can connect.
* Turns off access logging for the endpoint to prevent log growth from frequent scraping.
* Allows only `127.0.0.1` and denies all other addresses.
3. Test and reload NGINX:
```bash theme={null}
sudo nginx -t
sudo nginx -s reload
```
4. Verify the endpoint from the host itself (run on the server):
```bash theme={null}
curl http://127.0.0.1:81/nginx_status
```
Example expected output:
```text theme={null}
Active connections: 1
server accepts handled requests
9 9 13
Reading: 0 Writing: 1 Waiting: 0
```
Notes:
* If you fetch the endpoint from a remote machine you should either receive a `403 Forbidden` (if bound to 0.0.0.0 but access denied) or a connection error like `connection refused` (if bound to loopback only). Both outcomes are normal depending on your binding configuration.
* In Datadog’s NGINX integration settings, use `localhost` and the port you configured (for example, `81`) if it requests a host/port.
If you prefer to place the `stub_status` location inside an existing HTTPS server block, ensure you include `allow 127.0.0.1; deny all;` and `access_log off;` inside that `location /nginx_status` so only the local agent can access it:
```nginx theme={null}
location /nginx_status {
stub_status;
access_log off;
allow 127.0.0.1;
deny all;
}
```
After reloading NGINX, Datadog's agent should be able to scrape the `stub_status` endpoint and start reporting NGINX metrics.
## 3. Datadog dashboards and host view
Once the integration is configured and the agent collects `stub_status`, Datadog will populate or create NGINX dashboards. Navigate to Dashboards → All Dashboards to find NGINX-related dashboards.
Follow these steps to enable and configure the integration:
1. Verify your NGINX has the `stub_status` module:
```bash theme={null}
nginx -V 2>&1 | grep -o http_stub_status_module || true
```
If the output includes `http_stub_status_module`, the module is present.
2. Configure NGINX to expose `stub_status` on `localhost`. A common pattern is to listen on `127.0.0.1:81` and restrict access to the loopback interface. Add a server block (for example in `/etc/nginx/sites-available/example-https` or another site file):
```nginx theme={null}
server {
listen 127.0.0.1:81;
server_name localhost;
access_log off;
allow 127.0.0.1;
deny all;
location /nginx_status {
# Open source NGINX stub status
stub_status;
# For older open source NGINX (<1.7.5) the syntax may be:
# stub_status on;
# NGINX Plus users may use:
# status;
# ensure version info is available
server_tokens on;
}
}
```
This configuration:
* Listens on `127.0.0.1:81` so only the local host can connect.
* Turns off access logging for the endpoint to prevent log growth from frequent scraping.
* Allows only `127.0.0.1` and denies all other addresses.
3. Test and reload NGINX:
```bash theme={null}
sudo nginx -t
sudo nginx -s reload
```
4. Verify the endpoint from the host itself (run on the server):
```bash theme={null}
curl http://127.0.0.1:81/nginx_status
```
Example expected output:
```text theme={null}
Active connections: 1
server accepts handled requests
9 9 13
Reading: 0 Writing: 1 Waiting: 0
```
Notes:
* If you fetch the endpoint from a remote machine you should either receive a `403 Forbidden` (if bound to 0.0.0.0 but access denied) or a connection error like `connection refused` (if bound to loopback only). Both outcomes are normal depending on your binding configuration.
* In Datadog’s NGINX integration settings, use `localhost` and the port you configured (for example, `81`) if it requests a host/port.
If you prefer to place the `stub_status` location inside an existing HTTPS server block, ensure you include `allow 127.0.0.1; deny all;` and `access_log off;` inside that `location /nginx_status` so only the local agent can access it:
```nginx theme={null}
location /nginx_status {
stub_status;
access_log off;
allow 127.0.0.1;
deny all;
}
```
After reloading NGINX, Datadog's agent should be able to scrape the `stub_status` endpoint and start reporting NGINX metrics.
## 3. Datadog dashboards and host view
Once the integration is configured and the agent collects `stub_status`, Datadog will populate or create NGINX dashboards. Navigate to Dashboards → All Dashboards to find NGINX-related dashboards.
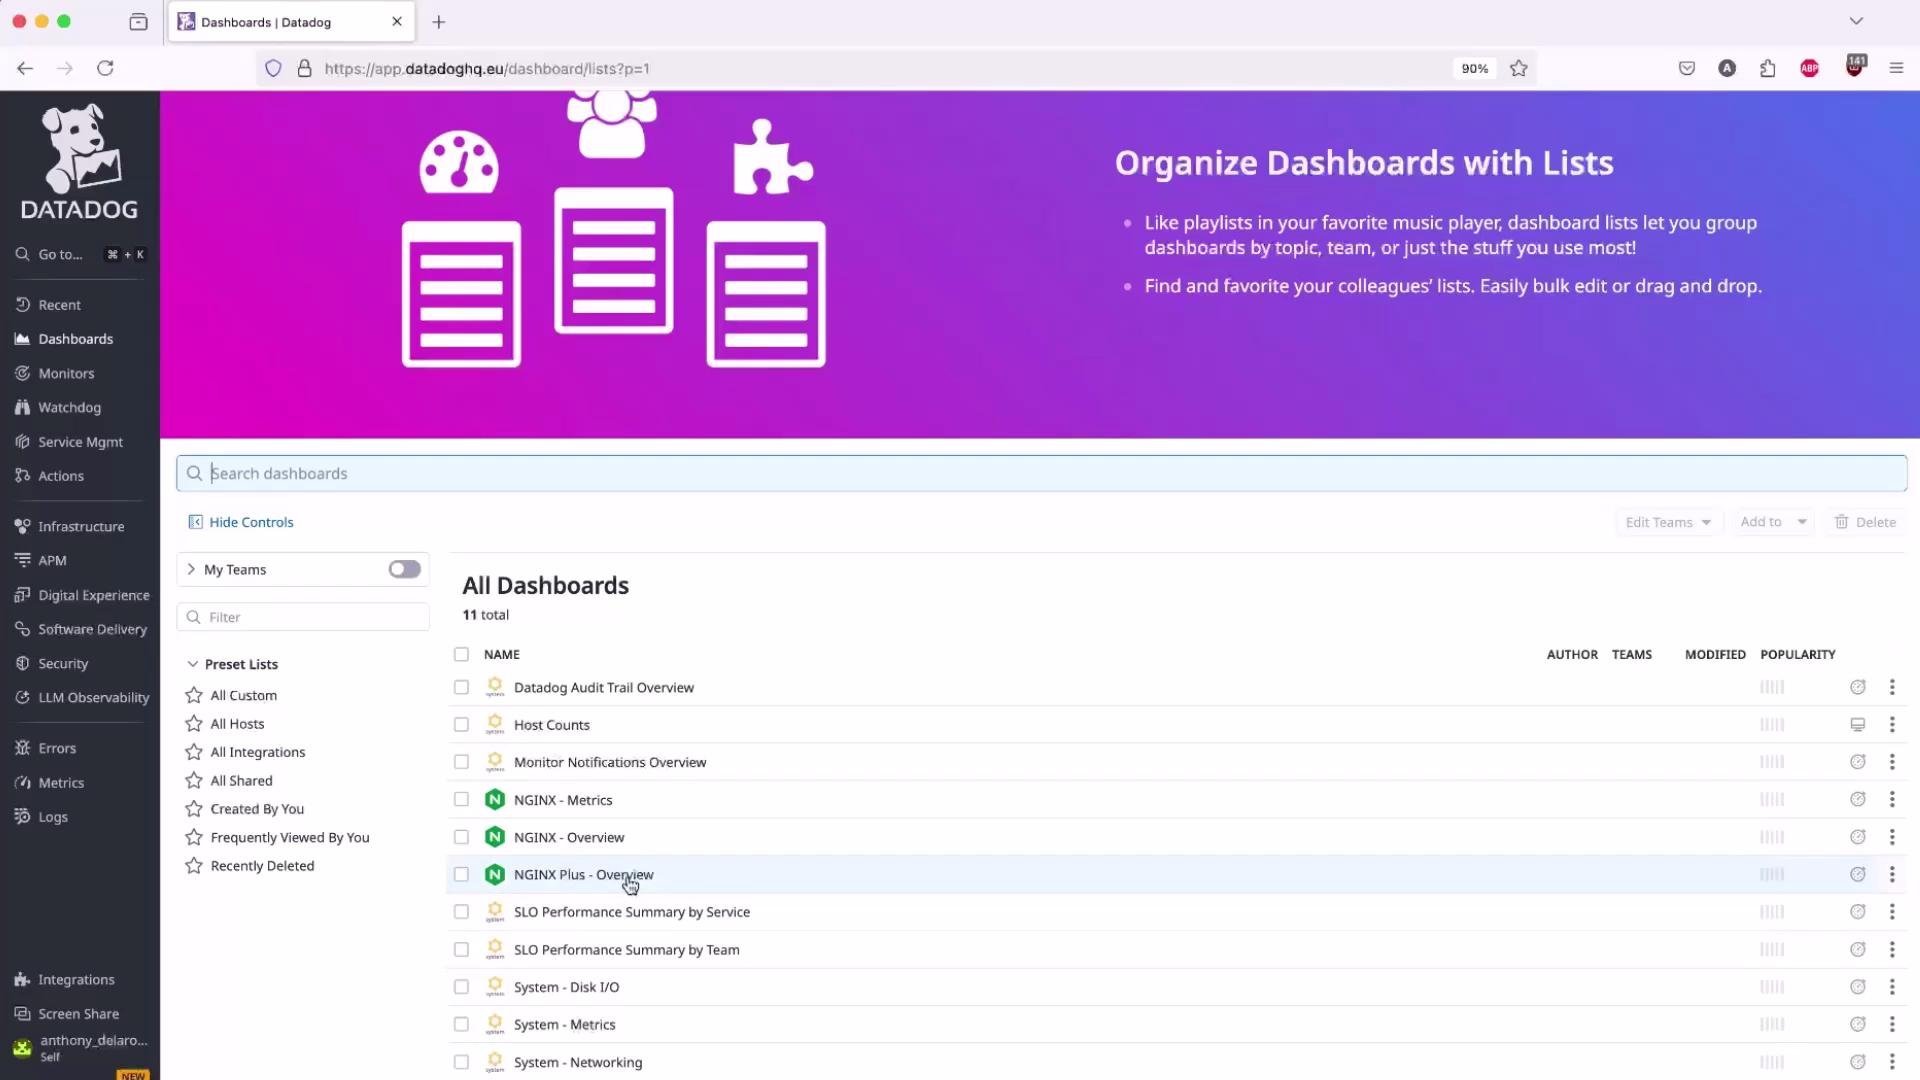 Open the "NGINX - Overview" dashboard (it may take a few minutes for metrics to appear). Adjust the time range (for example, last 15 minutes) to see recent activity.
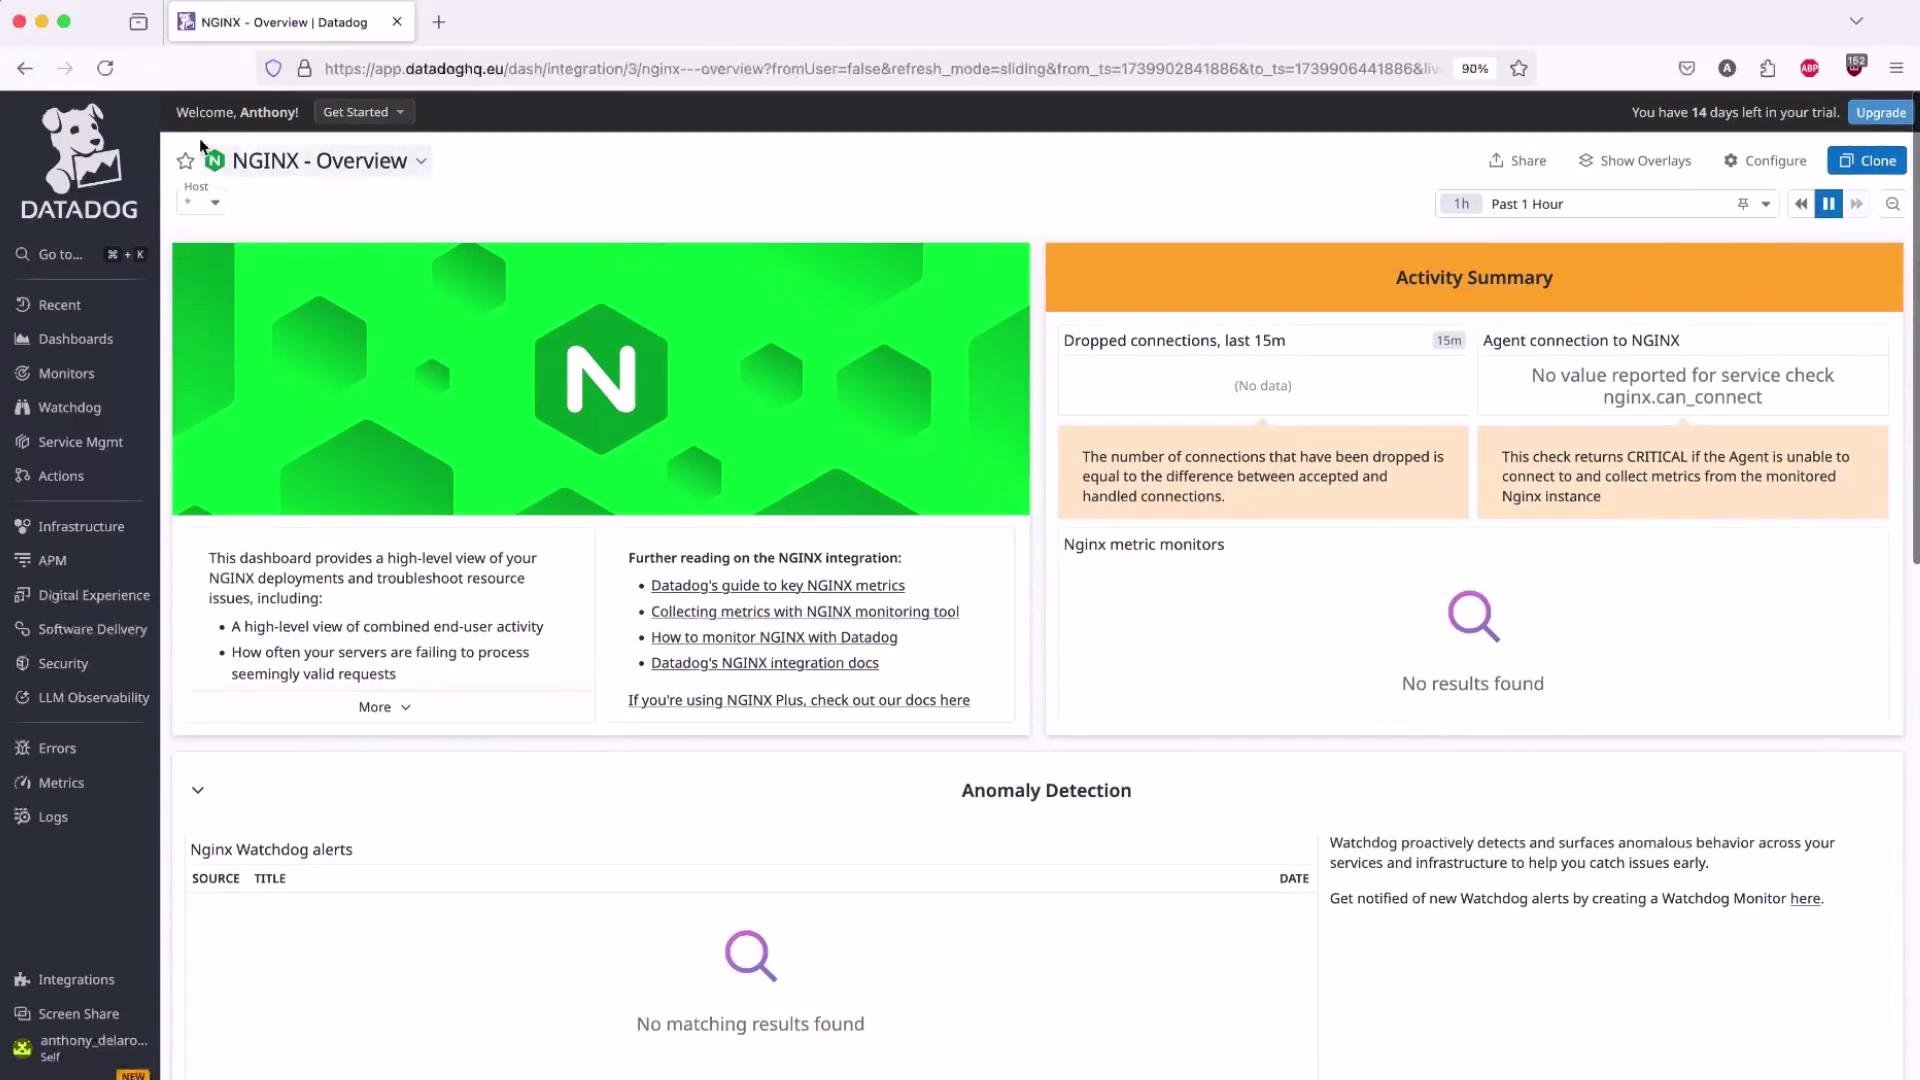 If you still see “no data”, verify the agent and integration settings. You can view the specific host under Datadog’s Hosts or via the Integrations host list to check system metrics and the host map.
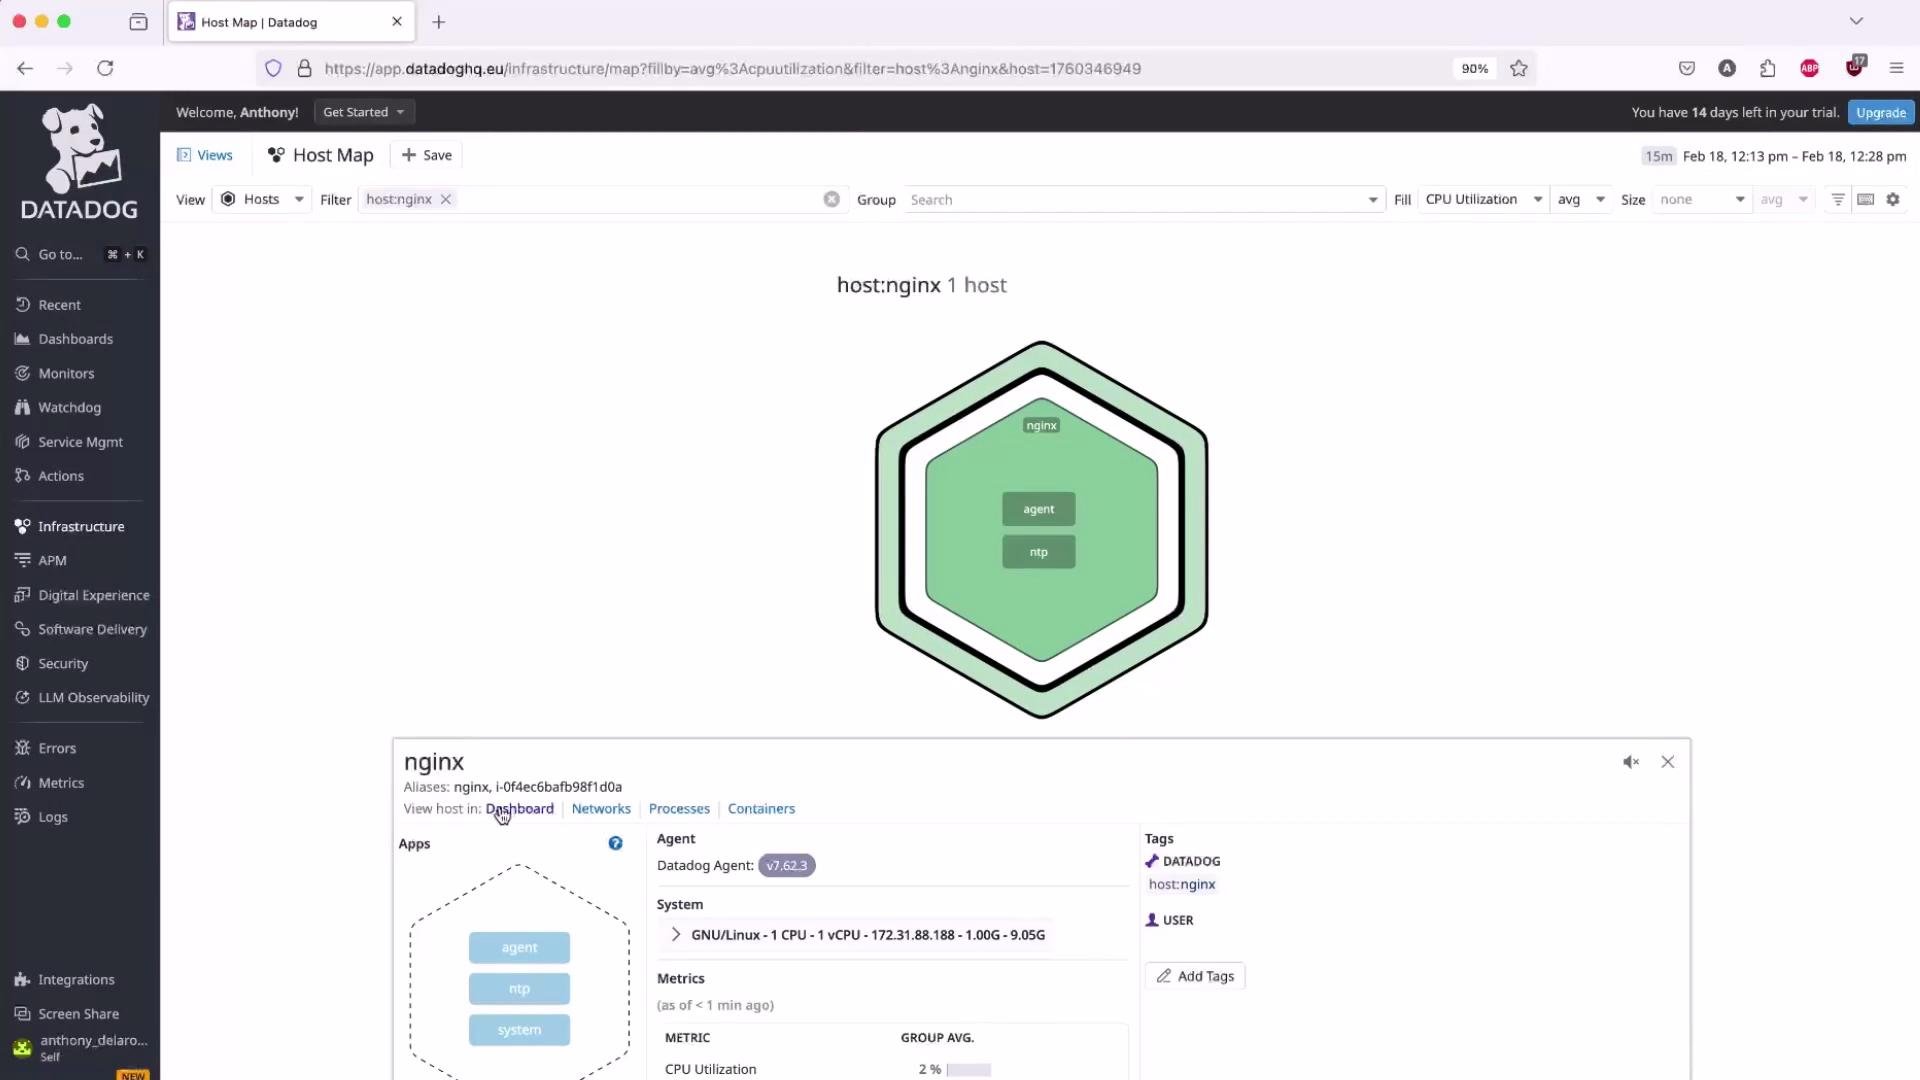 From the host and dashboard views you can:
* Bookmark dashboards you use often.
* Create monitors/alerts for CPU, memory, disk I/O, or NGINX-specific metrics (active connections, request rates).
* Run load tests (for example `ab`, `wrk`) to generate traffic and observe behavior.
## Quick reference — useful commands & checks
| Task | Command / Action | | | |
| ------------------------------------- | --------------------------------------- | ---------------------------------- | - | ------ |
| Check Datadog Agent status | `sudo systemctl status datadog-agent` | | | |
| Test NGINX config | `sudo nginx -t` | | | |
| Reload NGINX | `sudo nginx -s reload` | | | |
| Verify `stub_status` locally | `curl http://127.0.0.1:81/nginx_status` | | | |
| Confirm NGINX has stub\_status module | \`nginx -V 2>&1 | grep -o http\_stub\_status\_module | | true\` |
## Troubleshooting checklist
* Ensure the Datadog Agent is running: `sudo systemctl status datadog-agent`.
* Confirm the `nginx_status` endpoint is reachable from the host: `curl http://127.0.0.1:81/nginx_status`.
* If Datadog reports no NGINX metrics:
* Verify the NGINX integration is enabled in Datadog and the host/port configured in the integration matches your setup (e.g., `localhost:81`).
* Check the agent logs for errors: `sudo journalctl -u datadog-agent -f` (or review `/var/log/datadog/`).
* Keep the `stub_status` endpoint bound to `localhost` or explicitly deny external access to avoid exposing internal server state.
That completes the Datadog Agent install and NGINX integration setup. In future lessons we'll cover advanced performance troubleshooting for NGINX and configuring Datadog monitors/alerts.
## Links and references
* [Datadog Agent installation documentation](https://docs.datadoghq.com/agent/)
* [Datadog NGINX integration docs](https://docs.datadoghq.com/integrations/nginx/)
* [NGINX stub\_status module documentation](https://nginx.org/en/docs/http/ngx_http_stub_status_module.html)
From the host and dashboard views you can:
* Bookmark dashboards you use often.
* Create monitors/alerts for CPU, memory, disk I/O, or NGINX-specific metrics (active connections, request rates).
* Run load tests (for example `ab`, `wrk`) to generate traffic and observe behavior.
## Quick reference — useful commands & checks
| Task | Command / Action | | | |
| ------------------------------------- | --------------------------------------- | ---------------------------------- | - | ------ |
| Check Datadog Agent status | `sudo systemctl status datadog-agent` | | | |
| Test NGINX config | `sudo nginx -t` | | | |
| Reload NGINX | `sudo nginx -s reload` | | | |
| Verify `stub_status` locally | `curl http://127.0.0.1:81/nginx_status` | | | |
| Confirm NGINX has stub\_status module | \`nginx -V 2>&1 | grep -o http\_stub\_status\_module | | true\` |
## Troubleshooting checklist
* Ensure the Datadog Agent is running: `sudo systemctl status datadog-agent`.
* Confirm the `nginx_status` endpoint is reachable from the host: `curl http://127.0.0.1:81/nginx_status`.
* If Datadog reports no NGINX metrics:
* Verify the NGINX integration is enabled in Datadog and the host/port configured in the integration matches your setup (e.g., `localhost:81`).
* Check the agent logs for errors: `sudo journalctl -u datadog-agent -f` (or review `/var/log/datadog/`).
* Keep the `stub_status` endpoint bound to `localhost` or explicitly deny external access to avoid exposing internal server state.
That completes the Datadog Agent install and NGINX integration setup. In future lessons we'll cover advanced performance troubleshooting for NGINX and configuring Datadog monitors/alerts.
## Links and references
* [Datadog Agent installation documentation](https://docs.datadoghq.com/agent/)
* [Datadog NGINX integration docs](https://docs.datadoghq.com/integrations/nginx/)
* [NGINX stub\_status module documentation](https://nginx.org/en/docs/http/ngx_http_stub_status_module.html)