> ## Documentation Index
> Fetch the complete documentation index at: https://notes.kodekloud.com/llms.txt
> Use this file to discover all available pages before exploring further.
# Monitoring Troubleshooting
> Guide for monitoring and troubleshooting NGINX covering access and error logs, stub_status metrics, monitoring integrations, runtime checks, configuration validation, reloads, and production best practices
This guide explains practical ways to monitor and troubleshoot NGINX. It covers access and error logs, the built-in `stub_status` endpoint, integration options with monitoring platforms, and common runtime checks and commands to validate changes safely.
## Logging
NGINX produces two primary log streams:
* Access logs — record every incoming HTTP request (useful for traffic analysis, response codes, request sizes, user agents, and referers).
* Error logs — record server-side errors and configuration/runtime issues.
You can customize the access log format with the `log_format` directive inside the `http` block. See the NGINX log module docs for full details: [https://nginx.org/en/docs/http/ngx\_http\_log\_module.html](https://nginx.org/en/docs/http/ngx_http_log_module.html)
Example custom log format:
```nginx theme={null}
http {
log_format custom '$remote_addr - $remote_user [$time_local] "$request" '
'$status $body_bytes_sent "$http_referer" '
'"$http_user_agent" "$http_x_forwarded_for"';
}
```
Choose the variables that match your analysis and monitoring requirements (for example, add `$host` to capture the requested host header).
Common log variables
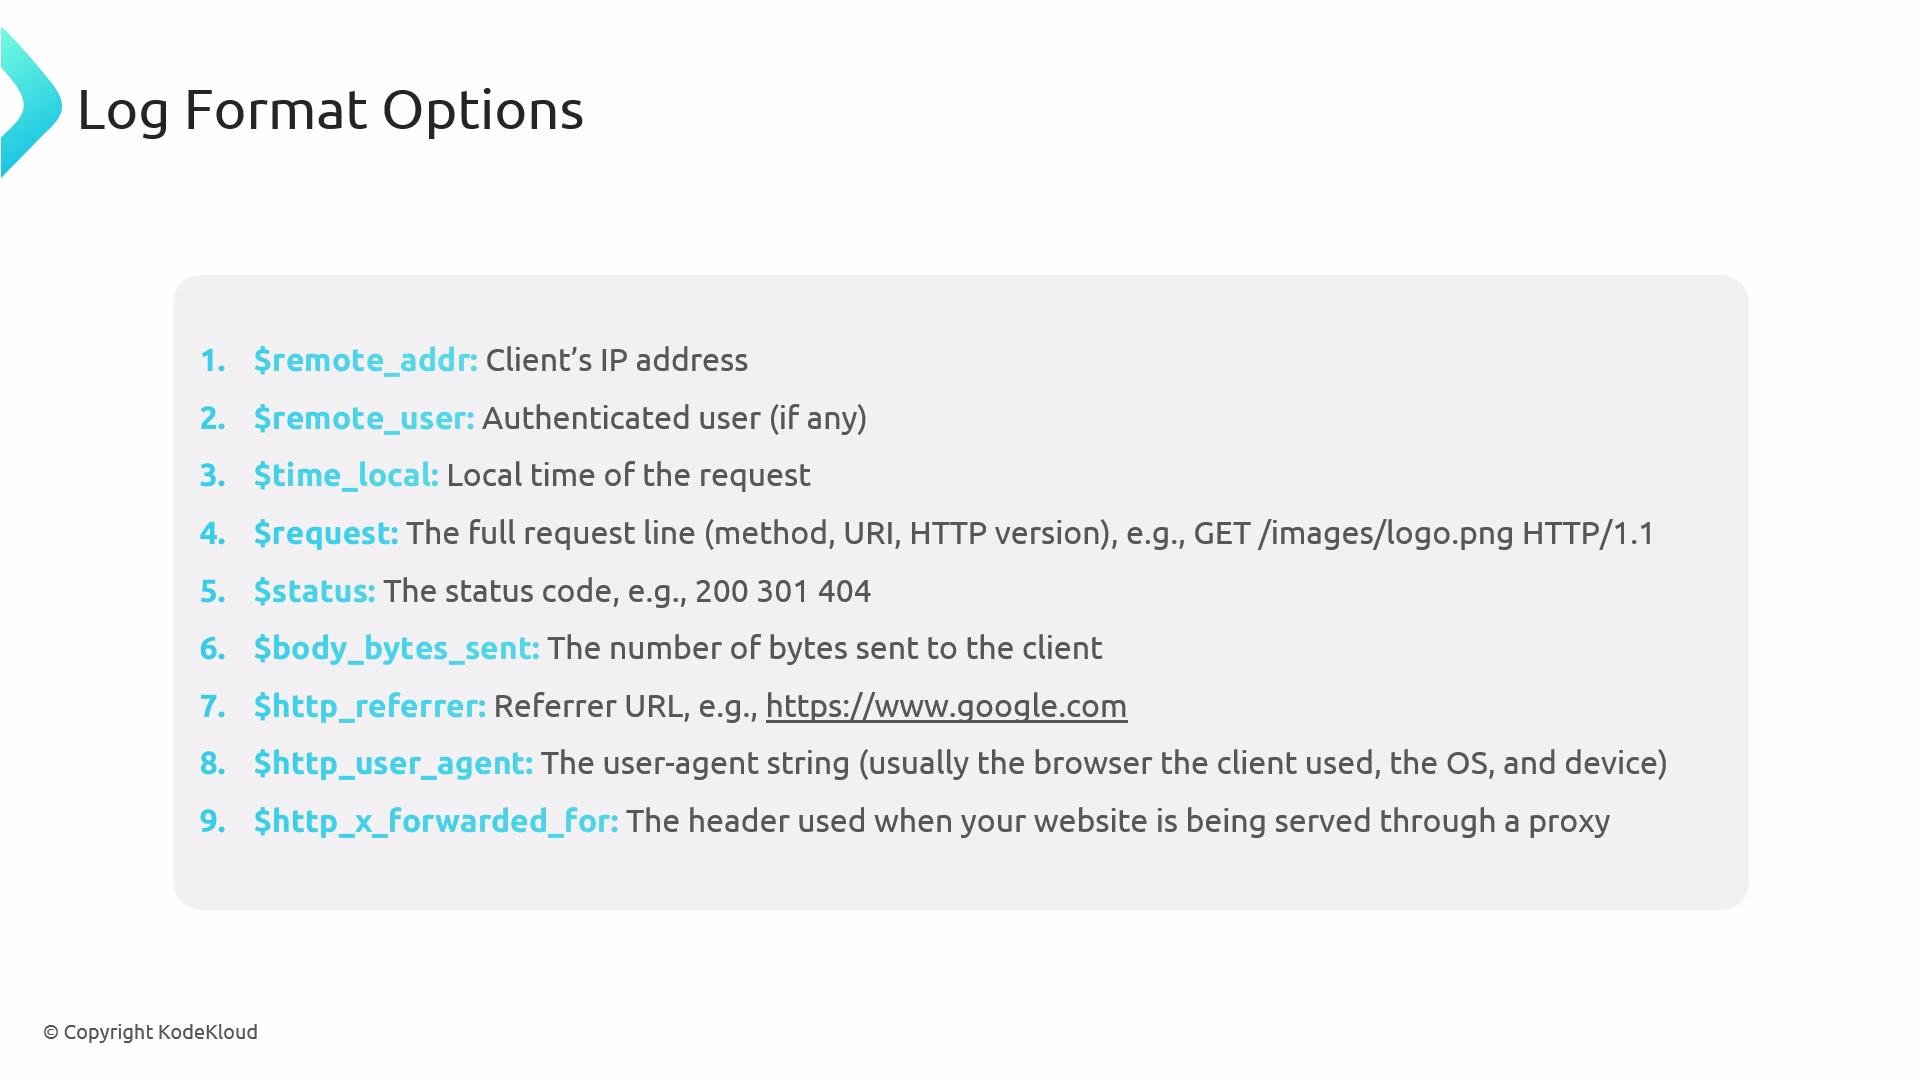 | Variable | Meaning |
| ----------------------- | ---------------------------------------------- |
| `$remote_addr` | Client IP address. |
| `$remote_user` | Authenticated user (empty if not used). |
| `$time_local` | Local timestamp. |
| `$request` | Full request line (method, URI, HTTP version). |
| `$status` | Response status code (200, 301, 404, etc.). |
| `$body_bytes_sent` | Bytes sent in the response body. |
| `$http_referer` | Referral URL (if present). |
| `$http_user_agent` | Browser or client user-agent string. |
| `$http_x_forwarded_for` | Proxy forwarded IPs (when behind a proxy). |
Enable access logs inside a `server` block (default log files are usually under `/var/log/nginx`):
```nginx theme={null}
server {
listen 80;
server_name example.com www.example.com;
root /var/www/example.com/html;
index index.html;
access_log /var/log/nginx/access.log;
location / {
try_files $uri $uri/ =404;
}
}
```
Tail access logs to watch incoming requests in real time:
```bash theme={null}
cd /var/log/nginx/
tail -f access.log
```
Example access log entry (trimmed):
```text theme={null}
192.168.1.1 - - [26/Jan/2025:14:23:35 +0000] "GET /images/logo.png HTTP/1.1" 200 512 "-" "Mozilla/5.0 (Macintosh; Intel Mac OS X 10_15_7) AppleWebKit/537.36 (KHTML, like Gecko) Chrome/91.0.4472.124 Safari/537.36"
```
Troubleshooting with access logs:
* Ask a remote user to make a request while you `tail -f` the access log. If there’s no entry, the request didn’t reach NGINX (DNS, client, proxy, or firewall issue).
* Ensure `access_log` is set in the appropriate `http`, `server`, or `location` block. Custom logs won’t be enabled unless explicitly configured.
## Error logs
Error logs capture server-side and runtime issues. They should be quiet during normal operation; frequent errors indicate misconfiguration or application problems. Configure location and verbosity with `error_log`:
```nginx theme={null}
error_log /var/log/nginx/error.log warn;
```
Check `error_log` for stack traces, file-not-found errors, permission problems, or upstream failures.
## NGINX metrics: stub\_status
NGINX provides a lightweight status endpoint through the `stub_status` module (see [https://nginx.org/en/docs/http/ngx\_http\_stub\_status\_module.html](https://nginx.org/en/docs/http/ngx_http_stub_status_module.html)). It exposes runtime counters for connections and requests.
Example server block to enable a local-only `/nginx_status` endpoint:
```nginx theme={null}
server {
listen 81;
server_name example.com;
location /nginx_status {
stub_status;
access_log off;
allow 127.0.0.1;
deny all;
}
}
```
Notes:
* `access_log off;` prevents scrape requests from cluttering logs.
* Restricting access (localhost or your monitoring hosts) and using a nonstandard port reduce exposure.
Query locally:
```bash theme={null}
curl localhost:81/nginx_status
```
Sample output:
```text theme={null}
Active connections: 309
server accepts handled requests
16630948 16630948 31070465
Reading: 11 Writing: 218 Waiting: 38
```
Field meanings:
* Active connections — current client connections.
* accepts — total accepted connections.
* handled — accepted and handled connections.
* requests — total number of client requests.
* Reading/Writing/Waiting — connections reading the request, writing the response, and keep-alive idle connections.
## Monitoring platforms and approaches
There are many solutions for metrics and log aggregation. Common choices include Prometheus + Grafana, Datadog, Dynatrace, and New Relic.
| Variable | Meaning |
| ----------------------- | ---------------------------------------------- |
| `$remote_addr` | Client IP address. |
| `$remote_user` | Authenticated user (empty if not used). |
| `$time_local` | Local timestamp. |
| `$request` | Full request line (method, URI, HTTP version). |
| `$status` | Response status code (200, 301, 404, etc.). |
| `$body_bytes_sent` | Bytes sent in the response body. |
| `$http_referer` | Referral URL (if present). |
| `$http_user_agent` | Browser or client user-agent string. |
| `$http_x_forwarded_for` | Proxy forwarded IPs (when behind a proxy). |
Enable access logs inside a `server` block (default log files are usually under `/var/log/nginx`):
```nginx theme={null}
server {
listen 80;
server_name example.com www.example.com;
root /var/www/example.com/html;
index index.html;
access_log /var/log/nginx/access.log;
location / {
try_files $uri $uri/ =404;
}
}
```
Tail access logs to watch incoming requests in real time:
```bash theme={null}
cd /var/log/nginx/
tail -f access.log
```
Example access log entry (trimmed):
```text theme={null}
192.168.1.1 - - [26/Jan/2025:14:23:35 +0000] "GET /images/logo.png HTTP/1.1" 200 512 "-" "Mozilla/5.0 (Macintosh; Intel Mac OS X 10_15_7) AppleWebKit/537.36 (KHTML, like Gecko) Chrome/91.0.4472.124 Safari/537.36"
```
Troubleshooting with access logs:
* Ask a remote user to make a request while you `tail -f` the access log. If there’s no entry, the request didn’t reach NGINX (DNS, client, proxy, or firewall issue).
* Ensure `access_log` is set in the appropriate `http`, `server`, or `location` block. Custom logs won’t be enabled unless explicitly configured.
## Error logs
Error logs capture server-side and runtime issues. They should be quiet during normal operation; frequent errors indicate misconfiguration or application problems. Configure location and verbosity with `error_log`:
```nginx theme={null}
error_log /var/log/nginx/error.log warn;
```
Check `error_log` for stack traces, file-not-found errors, permission problems, or upstream failures.
## NGINX metrics: stub\_status
NGINX provides a lightweight status endpoint through the `stub_status` module (see [https://nginx.org/en/docs/http/ngx\_http\_stub\_status\_module.html](https://nginx.org/en/docs/http/ngx_http_stub_status_module.html)). It exposes runtime counters for connections and requests.
Example server block to enable a local-only `/nginx_status` endpoint:
```nginx theme={null}
server {
listen 81;
server_name example.com;
location /nginx_status {
stub_status;
access_log off;
allow 127.0.0.1;
deny all;
}
}
```
Notes:
* `access_log off;` prevents scrape requests from cluttering logs.
* Restricting access (localhost or your monitoring hosts) and using a nonstandard port reduce exposure.
Query locally:
```bash theme={null}
curl localhost:81/nginx_status
```
Sample output:
```text theme={null}
Active connections: 309
server accepts handled requests
16630948 16630948 31070465
Reading: 11 Writing: 218 Waiting: 38
```
Field meanings:
* Active connections — current client connections.
* accepts — total accepted connections.
* handled — accepted and handled connections.
* requests — total number of client requests.
* Reading/Writing/Waiting — connections reading the request, writing the response, and keep-alive idle connections.
## Monitoring platforms and approaches
There are many solutions for metrics and log aggregation. Common choices include Prometheus + Grafana, Datadog, Dynatrace, and New Relic.
 | Tool | Type | Typical use |
| ---------------------------------------------------------------------- | -------------------------------- | ---------------------------------------------------------------------------- |
| [Prometheus](https://prometheus.io/) + [Grafana](https://grafana.com/) | Open-source metrics + dashboards | Scrape `stub_status` via an exporter, create dashboards and alerts. |
| [Datadog](https://www.datadoghq.com/) | SaaS monitoring | Agent collects system and NGINX metrics, ingest logs, dashboards and alerts. |
| [Dynatrace](https://www.dynatrace.com/) | SaaS APM | Full-stack tracing and infrastructure monitoring. |
| [New Relic](https://newrelic.com/) | SaaS APM | Application and infrastructure monitoring with log ingestion. |
Common approach:
* Install an agent on the host (Datadog Agent, Prometheus node\_exporter).
* Collect system metrics (CPU, memory, disk, network) and NGINX metrics (via `stub_status` or an NGINX exporter).
* Centralize logs and metrics, then build dashboards and alerts (error rate, response codes, connection saturation).
## Datadog example
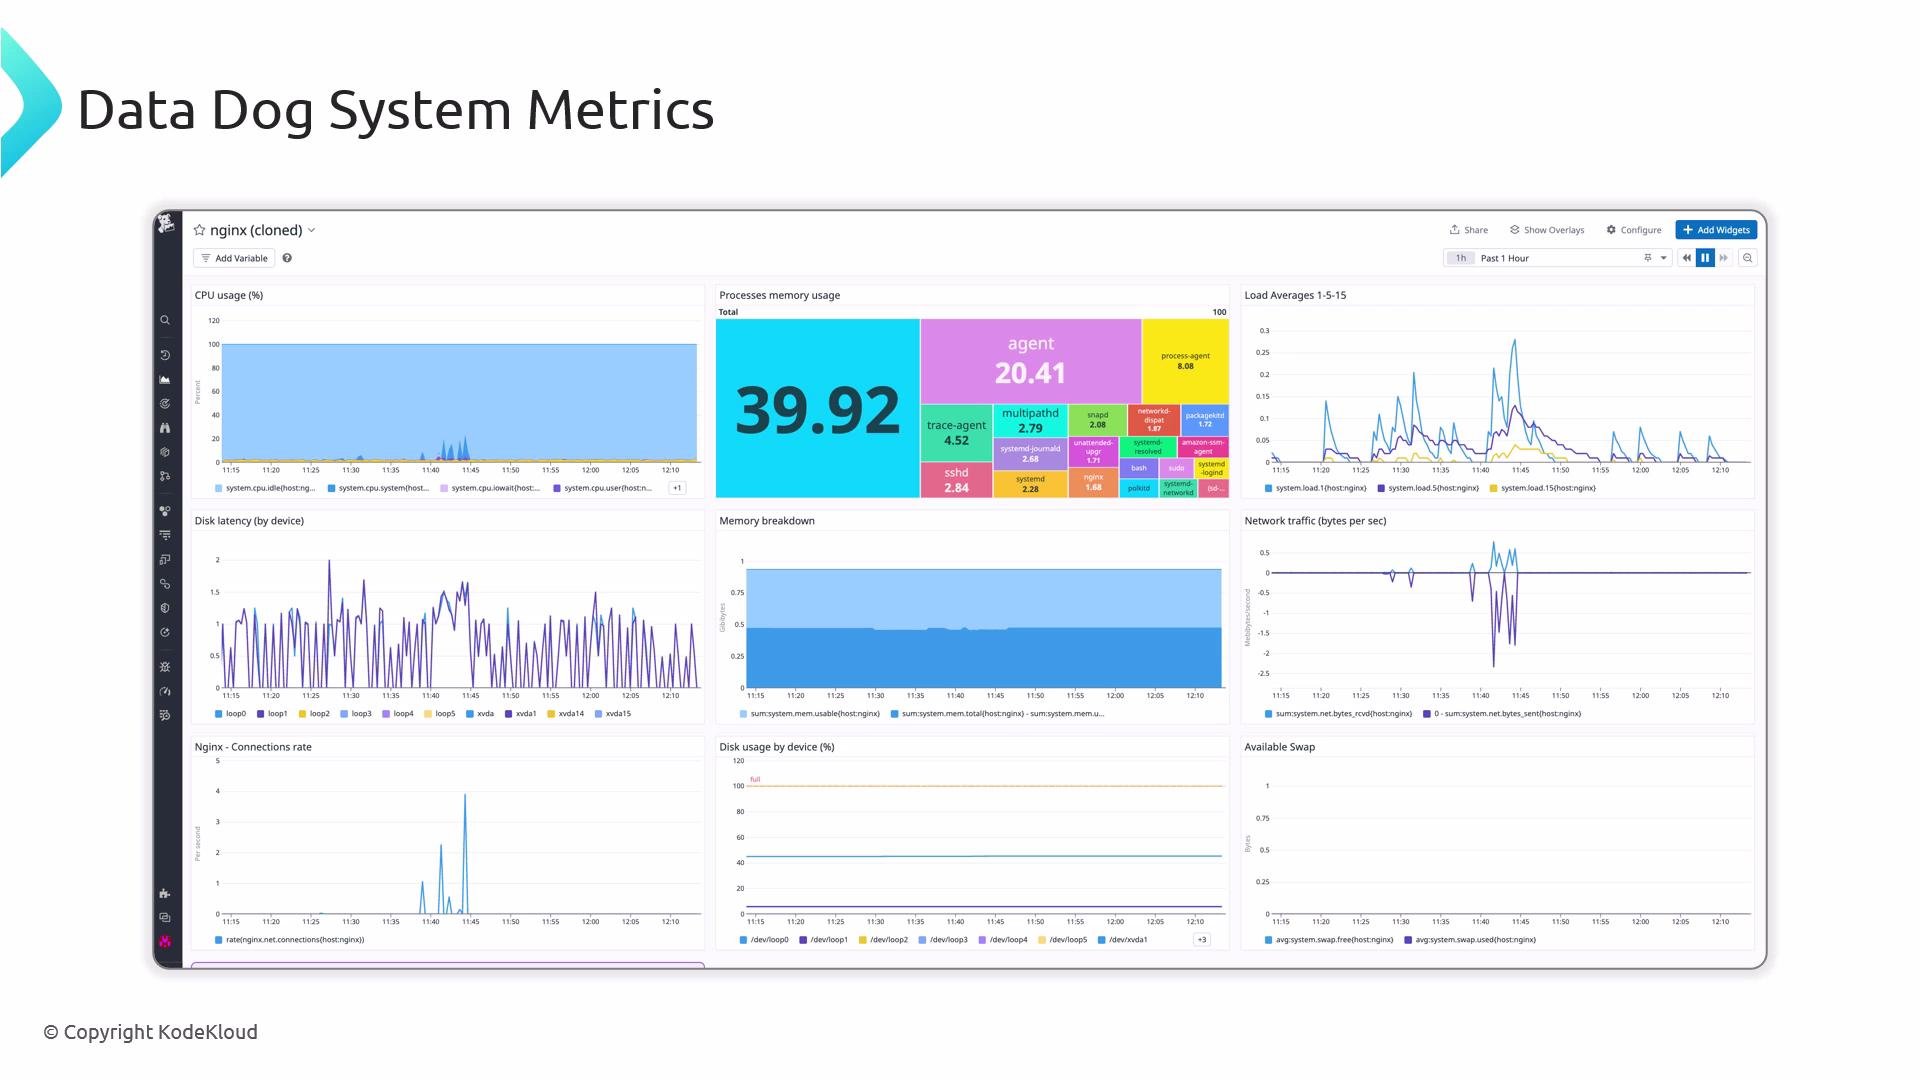
Datadog can ingest both logs and metrics and scrape `stub_status` for basic NGINX metrics. A typical system dashboard includes CPU, memory, load, disk, network, and NGINX charts.
| Tool | Type | Typical use |
| ---------------------------------------------------------------------- | -------------------------------- | ---------------------------------------------------------------------------- |
| [Prometheus](https://prometheus.io/) + [Grafana](https://grafana.com/) | Open-source metrics + dashboards | Scrape `stub_status` via an exporter, create dashboards and alerts. |
| [Datadog](https://www.datadoghq.com/) | SaaS monitoring | Agent collects system and NGINX metrics, ingest logs, dashboards and alerts. |
| [Dynatrace](https://www.dynatrace.com/) | SaaS APM | Full-stack tracing and infrastructure monitoring. |
| [New Relic](https://newrelic.com/) | SaaS APM | Application and infrastructure monitoring with log ingestion. |
Common approach:
* Install an agent on the host (Datadog Agent, Prometheus node\_exporter).
* Collect system metrics (CPU, memory, disk, network) and NGINX metrics (via `stub_status` or an NGINX exporter).
* Centralize logs and metrics, then build dashboards and alerts (error rate, response codes, connection saturation).
## Datadog example
Datadog can ingest both logs and metrics and scrape `stub_status` for basic NGINX metrics. A typical system dashboard includes CPU, memory, load, disk, network, and NGINX charts.
 Note: NGINX Plus (commercial) exposes additional metrics such as detailed status codes, upstream health, and cache statistics. Open-source NGINX combined with exporters and monitoring tools still provides strong observability for most environments.
## Example log excerpts
Error and request lines can reveal missing files, bad routes, or failing backends:
```text theme={null}
2018/05/16 22:02:02 [error] 1244#1244: *203 open() "/var/www/html/order/2480" failed (2: No such file or directory), client: 127.0.0.1, server: _, request: "GET /order/2480 HTTP/1.1"
2018/05/16 22:02:02 [error] 1244#1244: *202 open() "/var/www/html/send/notice" failed (2: No such file or directory), client: 127.0.0.1, server: _, request: "GET /send/notice HTTP/1.1"
GET /order/2480 HTTP/1.1
GET /send/notice HTTP/1.1
GET /pass/beanserver/refund/2480 HTTP/1.1
GET /pass/beanserver/payment/ HTTP/1.1
GET /pass/beanserver/payment/7794 HTTP/1.1
GET /pass/beanserver/order/8048 HTTP/1.1
GET /pass/beanserver/order/4943 HTTP/1.1
2018/05/16 22:02:01 [error] 1244#1244: *186 open() "/var/www/html/bad" failed (2: No such file or directory), client: 127.0.0.1, server: _, request: "GET /bad HTTP/1.1"
GET /pass/welcome HTTP/1.1
```
## Configuration testing and reloading
Always test configuration changes before applying them to avoid service disruption.
Test configuration syntax:
```bash theme={null}
nginx -t
```
Successful test example:
```text theme={null}
nginx: the configuration file /etc/nginx/nginx.conf syntax is ok
nginx: configuration file /etc/nginx/nginx.conf test is successful
```
Sample failure output for misplaced directives or typos:
```text theme={null}
nginx: [emerg] unknown directive "worker_connections" in /etc/nginx/nginx.conf:7
nginx: configuration file /etc/nginx/nginx.conf test failed
2025/01/29 23:46:03 [emerg] 71439#71439: "server" directive is not allowed here in /etc/nginx/sites-enabled/default:39
```
Reload without dropping connections after a successful test:
```bash theme={null}
nginx -s reload
```
Check service status with `systemctl`:
```bash theme={null}
systemctl status nginx
```
Example active service output (trimmed):
```text theme={null}
● nginx.service - A high performance web server and a reverse proxy server
Loaded: loaded (/lib/systemd/system/nginx.service; enabled; vendor preset: enabled)
Active: active (running) since Tue 2025-01-28 00:18:10 UTC; 1 day 23h ago
Docs: man:nginx(8)
Main PID: 2164 (nginx)
Tasks: 2 (limit: 1130)
Memory: 24.7M
CPU: 16.367s
```
If inactive, start and inspect recent logs:
```bash theme={null}
systemctl start nginx
journalctl -u nginx --since "10 minutes ago"
```
Do not run two services bound to the same port (for example, Apache and NGINX both listening on port 80). Port conflicts will prevent the web server from starting.
## Quick runtime checks
If `systemctl` reports NGINX as active but users still have problems, test the local HTTP response:
```bash theme={null}
curl --head localhost
```
Example response:
```text theme={null}
HTTP/1.1 200 OK
Server: nginx/1.18.0 (Ubuntu)
Date: Thu, 30 Jan 2025 00:10:05 GMT
Content-Type: text/html
Content-Length: 612
Connection: keep-alive
ETag: "67982241-264"
Accept-Ranges: bytes
```
A `200` status shows NGINX is responding locally; next check the application, firewall, DNS, or network path.
## Firewalls and connectivity
Ensure cloud-provider security groups and host firewalls allow ports 80 and 443.
UFW (Ubuntu) example:
```bash theme={null}
sudo ufw allow 80/tcp
sudo ufw allow 443/tcp
sudo ufw reload
```
firewalld (RHEL/CentOS) example:
```bash theme={null}
sudo firewall-cmd --permanent --add-port=80/tcp
sudo firewall-cmd --permanent --add-port=443/tcp
sudo firewall-cmd --reload
```
## Production monitoring best practices
* Rotate logs to avoid disk exhaustion (logrotate or your platform’s logging agent).
* Centralize metrics and logs (Prometheus, Datadog, ELK/Opensearch) and set alerts for high error rates, CPU spikes, or connection limits.
* Limit exposure of sensitive endpoints (for example, restrict `/nginx_status` to localhost or specific monitoring hosts).
* Consider NGINX Plus for advanced metrics and commercial support if you need upstream health, cache analytics, and built-in dashboarding.
## Final recommendations
Always validate configuration changes with `nginx -t` before reloading, restrict sensitive endpoints (e.g., `/nginx_status`) to trusted hosts, and centralize logs and metrics to simplify troubleshooting and alerting.
This concludes the monitoring and troubleshooting guide for NGINX. For further reading, see:
* NGINX documentation: [https://nginx.org/en/docs/](https://nginx.org/en/docs/)
* Prometheus: [https://prometheus.io/](https://prometheus.io/)
* Grafana: [https://grafana.com/](https://grafana.com/)
* Datadog: [https://www.datadoghq.com/](https://www.datadoghq.com/)
Note: NGINX Plus (commercial) exposes additional metrics such as detailed status codes, upstream health, and cache statistics. Open-source NGINX combined with exporters and monitoring tools still provides strong observability for most environments.
## Example log excerpts
Error and request lines can reveal missing files, bad routes, or failing backends:
```text theme={null}
2018/05/16 22:02:02 [error] 1244#1244: *203 open() "/var/www/html/order/2480" failed (2: No such file or directory), client: 127.0.0.1, server: _, request: "GET /order/2480 HTTP/1.1"
2018/05/16 22:02:02 [error] 1244#1244: *202 open() "/var/www/html/send/notice" failed (2: No such file or directory), client: 127.0.0.1, server: _, request: "GET /send/notice HTTP/1.1"
GET /order/2480 HTTP/1.1
GET /send/notice HTTP/1.1
GET /pass/beanserver/refund/2480 HTTP/1.1
GET /pass/beanserver/payment/ HTTP/1.1
GET /pass/beanserver/payment/7794 HTTP/1.1
GET /pass/beanserver/order/8048 HTTP/1.1
GET /pass/beanserver/order/4943 HTTP/1.1
2018/05/16 22:02:01 [error] 1244#1244: *186 open() "/var/www/html/bad" failed (2: No such file or directory), client: 127.0.0.1, server: _, request: "GET /bad HTTP/1.1"
GET /pass/welcome HTTP/1.1
```
## Configuration testing and reloading
Always test configuration changes before applying them to avoid service disruption.
Test configuration syntax:
```bash theme={null}
nginx -t
```
Successful test example:
```text theme={null}
nginx: the configuration file /etc/nginx/nginx.conf syntax is ok
nginx: configuration file /etc/nginx/nginx.conf test is successful
```
Sample failure output for misplaced directives or typos:
```text theme={null}
nginx: [emerg] unknown directive "worker_connections" in /etc/nginx/nginx.conf:7
nginx: configuration file /etc/nginx/nginx.conf test failed
2025/01/29 23:46:03 [emerg] 71439#71439: "server" directive is not allowed here in /etc/nginx/sites-enabled/default:39
```
Reload without dropping connections after a successful test:
```bash theme={null}
nginx -s reload
```
Check service status with `systemctl`:
```bash theme={null}
systemctl status nginx
```
Example active service output (trimmed):
```text theme={null}
● nginx.service - A high performance web server and a reverse proxy server
Loaded: loaded (/lib/systemd/system/nginx.service; enabled; vendor preset: enabled)
Active: active (running) since Tue 2025-01-28 00:18:10 UTC; 1 day 23h ago
Docs: man:nginx(8)
Main PID: 2164 (nginx)
Tasks: 2 (limit: 1130)
Memory: 24.7M
CPU: 16.367s
```
If inactive, start and inspect recent logs:
```bash theme={null}
systemctl start nginx
journalctl -u nginx --since "10 minutes ago"
```
Do not run two services bound to the same port (for example, Apache and NGINX both listening on port 80). Port conflicts will prevent the web server from starting.
## Quick runtime checks
If `systemctl` reports NGINX as active but users still have problems, test the local HTTP response:
```bash theme={null}
curl --head localhost
```
Example response:
```text theme={null}
HTTP/1.1 200 OK
Server: nginx/1.18.0 (Ubuntu)
Date: Thu, 30 Jan 2025 00:10:05 GMT
Content-Type: text/html
Content-Length: 612
Connection: keep-alive
ETag: "67982241-264"
Accept-Ranges: bytes
```
A `200` status shows NGINX is responding locally; next check the application, firewall, DNS, or network path.
## Firewalls and connectivity
Ensure cloud-provider security groups and host firewalls allow ports 80 and 443.
UFW (Ubuntu) example:
```bash theme={null}
sudo ufw allow 80/tcp
sudo ufw allow 443/tcp
sudo ufw reload
```
firewalld (RHEL/CentOS) example:
```bash theme={null}
sudo firewall-cmd --permanent --add-port=80/tcp
sudo firewall-cmd --permanent --add-port=443/tcp
sudo firewall-cmd --reload
```
## Production monitoring best practices
* Rotate logs to avoid disk exhaustion (logrotate or your platform’s logging agent).
* Centralize metrics and logs (Prometheus, Datadog, ELK/Opensearch) and set alerts for high error rates, CPU spikes, or connection limits.
* Limit exposure of sensitive endpoints (for example, restrict `/nginx_status` to localhost or specific monitoring hosts).
* Consider NGINX Plus for advanced metrics and commercial support if you need upstream health, cache analytics, and built-in dashboarding.
## Final recommendations
Always validate configuration changes with `nginx -t` before reloading, restrict sensitive endpoints (e.g., `/nginx_status`) to trusted hosts, and centralize logs and metrics to simplify troubleshooting and alerting.
This concludes the monitoring and troubleshooting guide for NGINX. For further reading, see:
* NGINX documentation: [https://nginx.org/en/docs/](https://nginx.org/en/docs/)
* Prometheus: [https://prometheus.io/](https://prometheus.io/)
* Grafana: [https://grafana.com/](https://grafana.com/)
* Datadog: [https://www.datadoghq.com/](https://www.datadoghq.com/)