> ## Documentation Index
> Fetch the complete documentation index at: https://notes.kodekloud.com/llms.txt
> Use this file to discover all available pages before exploring further.
# Demo AnalysisRun Abort
> Demo showing Argo Rollouts aborts and scales down updates when a pre-promotion AnalysisRun fails, preventing unhealthy revisions from being promoted to production.
In this lesson we deploy a faulty version of the application and observe how Argo Rollouts automatically aborts (and scales down) the update when a pre-promotion AnalysisRun fails. This demonstrates how analysis protects production traffic by preventing automatic promotion of unhealthy revisions.
## What you'll see
* Run the faulty image locally to inspect its health endpoint.
* Update the Rollout to use the faulty image and observe a new preview ReplicaSet and preview Service.
* The Rollout runs a pre-promotion AnalysisRun against the preview Service; the analysis records repeated non-2xx responses and fails.
* Argo Rollouts aborts the update, scales down the preview ReplicaSet, and leaves the stable/active revision serving production traffic.
Run these steps in the argo-analysis-lab namespace (or adapt the namespace used by your Rollout). Make sure you have the Argo Rollouts kubectl plugin installed: [https://argoproj.github.io/argo-rollouts/commands/kubectl-argo-rollouts/](https://argoproj.github.io/argo-rollouts/commands/kubectl-argo-rollouts/)
***
## 1) Run the faulty image locally and check its /health endpoint
Start the container locally to inspect its health endpoint:
```bash theme={null}
docker run -p 9898:3000 siddharth67/highway-animation:error
```
Expected container output:
```bash theme={null}
🚦 Highway Animation Server running on http://localhost:3000
📁 Serving files from: /app/public
```
From the host, query the health endpoint:
```bash theme={null}
curl http://localhost:9898/health
```
This faulty build returns a 400 payload:
```json theme={null}
{
"code": 400,
"status": "ERROR",
"message": "Bad Request - Demo error response",
"timestamp": 1761386999728
}
```
***
## 2) Update the Rollout to use the error image and watch the pre-promotion AnalysisRun
When the Rollout is updated to use the faulty image in the argo-analysis-lab namespace, Argo Rollouts creates a new revision (ReplicaSet) and a preview Service, then executes the configured pre-promotion AnalysisRun against that preview Service.
Check cluster resources:
```bash theme={null}
kubectl -n argo-analysis-lab get all
```
Condensed sample output (shows existing stable ReplicaSet and the new preview ReplicaSet in ContainerCreating):
```bash theme={null}
NAME READY STATUS RESTARTS AGE
pod/highway-bluegreen-5fbd95fdb8-5wz27 1/1 Running 0 14h
...
pod/highway-bluegreen-6bb7458c49-6hl8r 0/1 ContainerCreating 0 13s
...
NAME TYPE CLUSTER-IP PORT(S) AGE
service/highway-bluegreen-active NodePort 10.110.85.145 80:32079/TCP 15h
service/highway-bluegreen-preview NodePort 10.108.197.140 80:31058/TCP 15h
...
replicaset.apps/highway-bluegreen-5fbd95fdb8 5 5 5 14h
replicaset.apps/highway-bluegreen-6bb7458c49 5 5 0 15s
```
The preview Service (new revision) returns the same 400 error when probed, while the active/stable Service continues to return 200 OK.
Preview (failing revision):
```json theme={null}
{
"code": 400,
"status": "ERROR",
"message": "Bad Request - Demo error response",
"timestamp": 1761387136201
}
```
Active/stable revision:
```json theme={null}
{
"code": 200,
"status": "OK",
"message": "Highway Animation Server is running",
"timestamp": 1761387072985
}
```
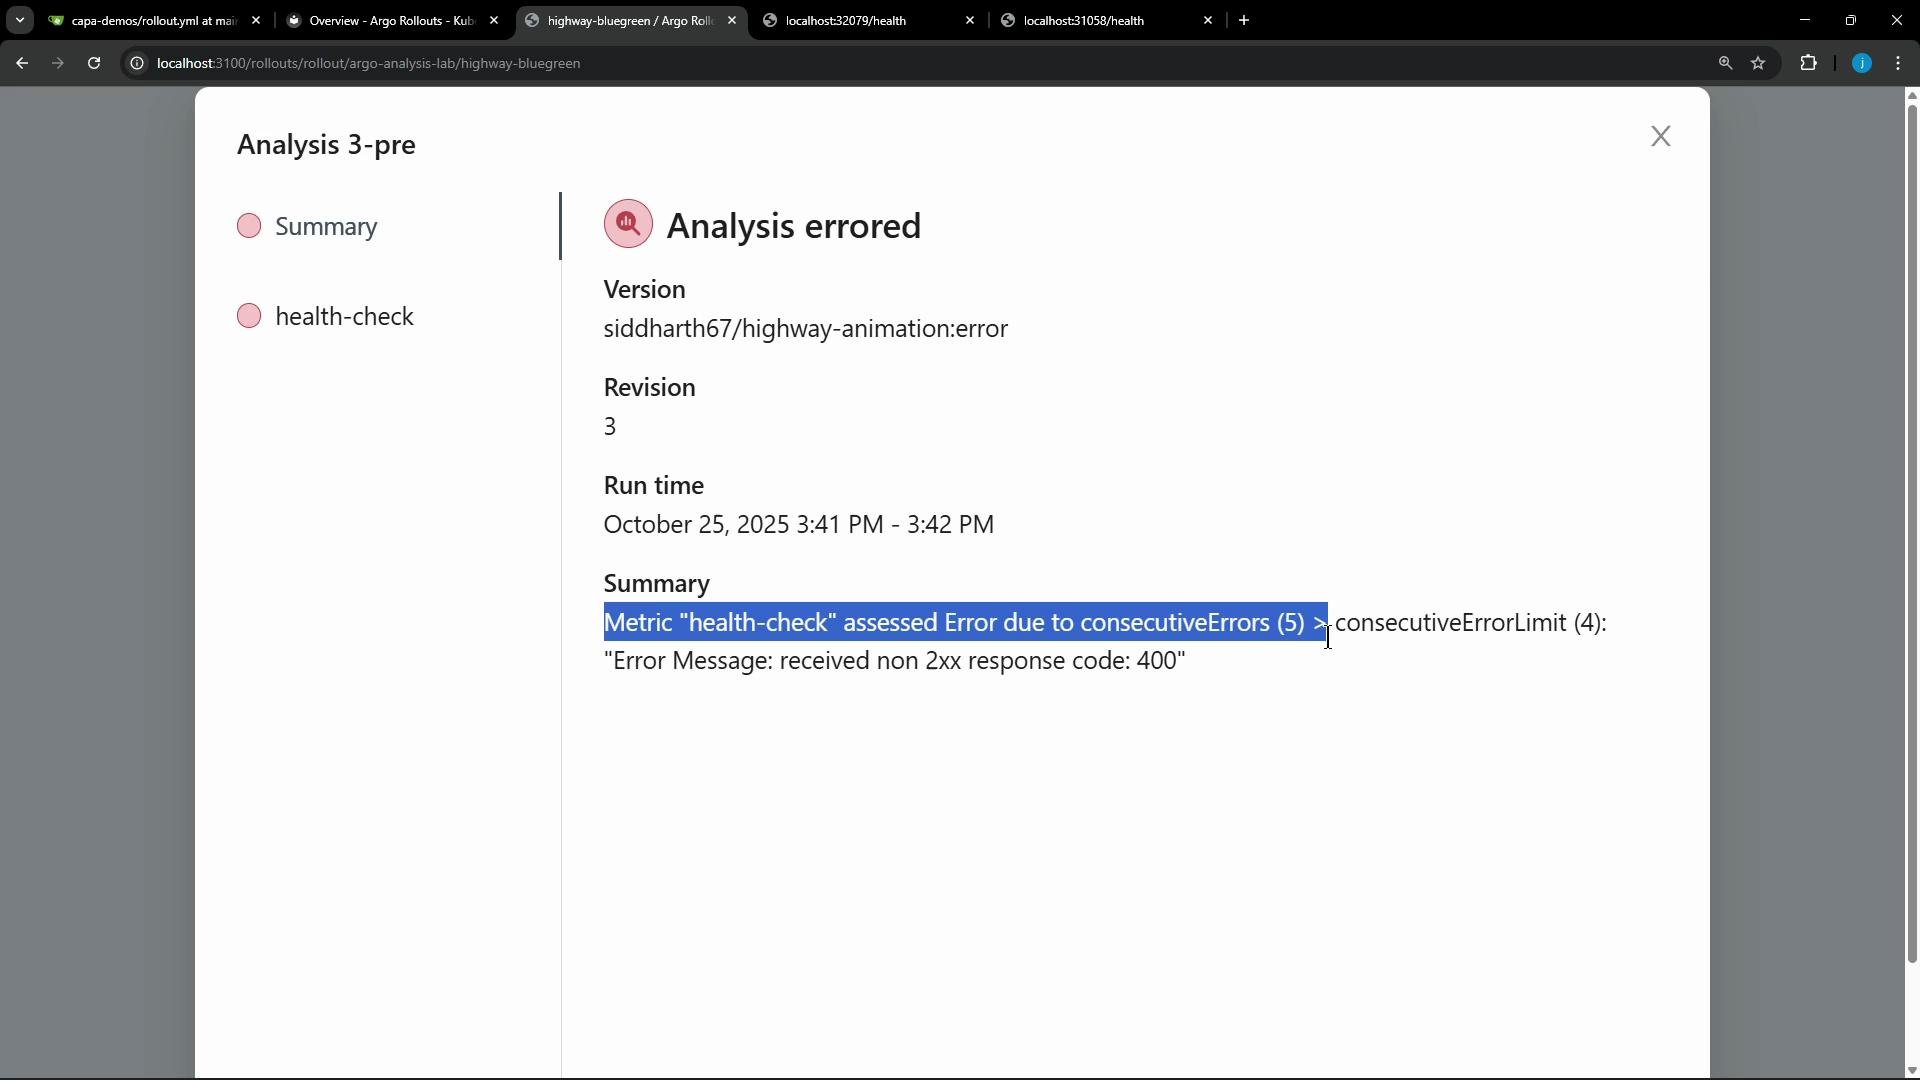
Because the AnalysisRun metric observed non-2xx responses repeatedly, it reached the configured consecutive-error threshold and the analysis aborted. The Rollouts UI and console display the metric failure and the reason:
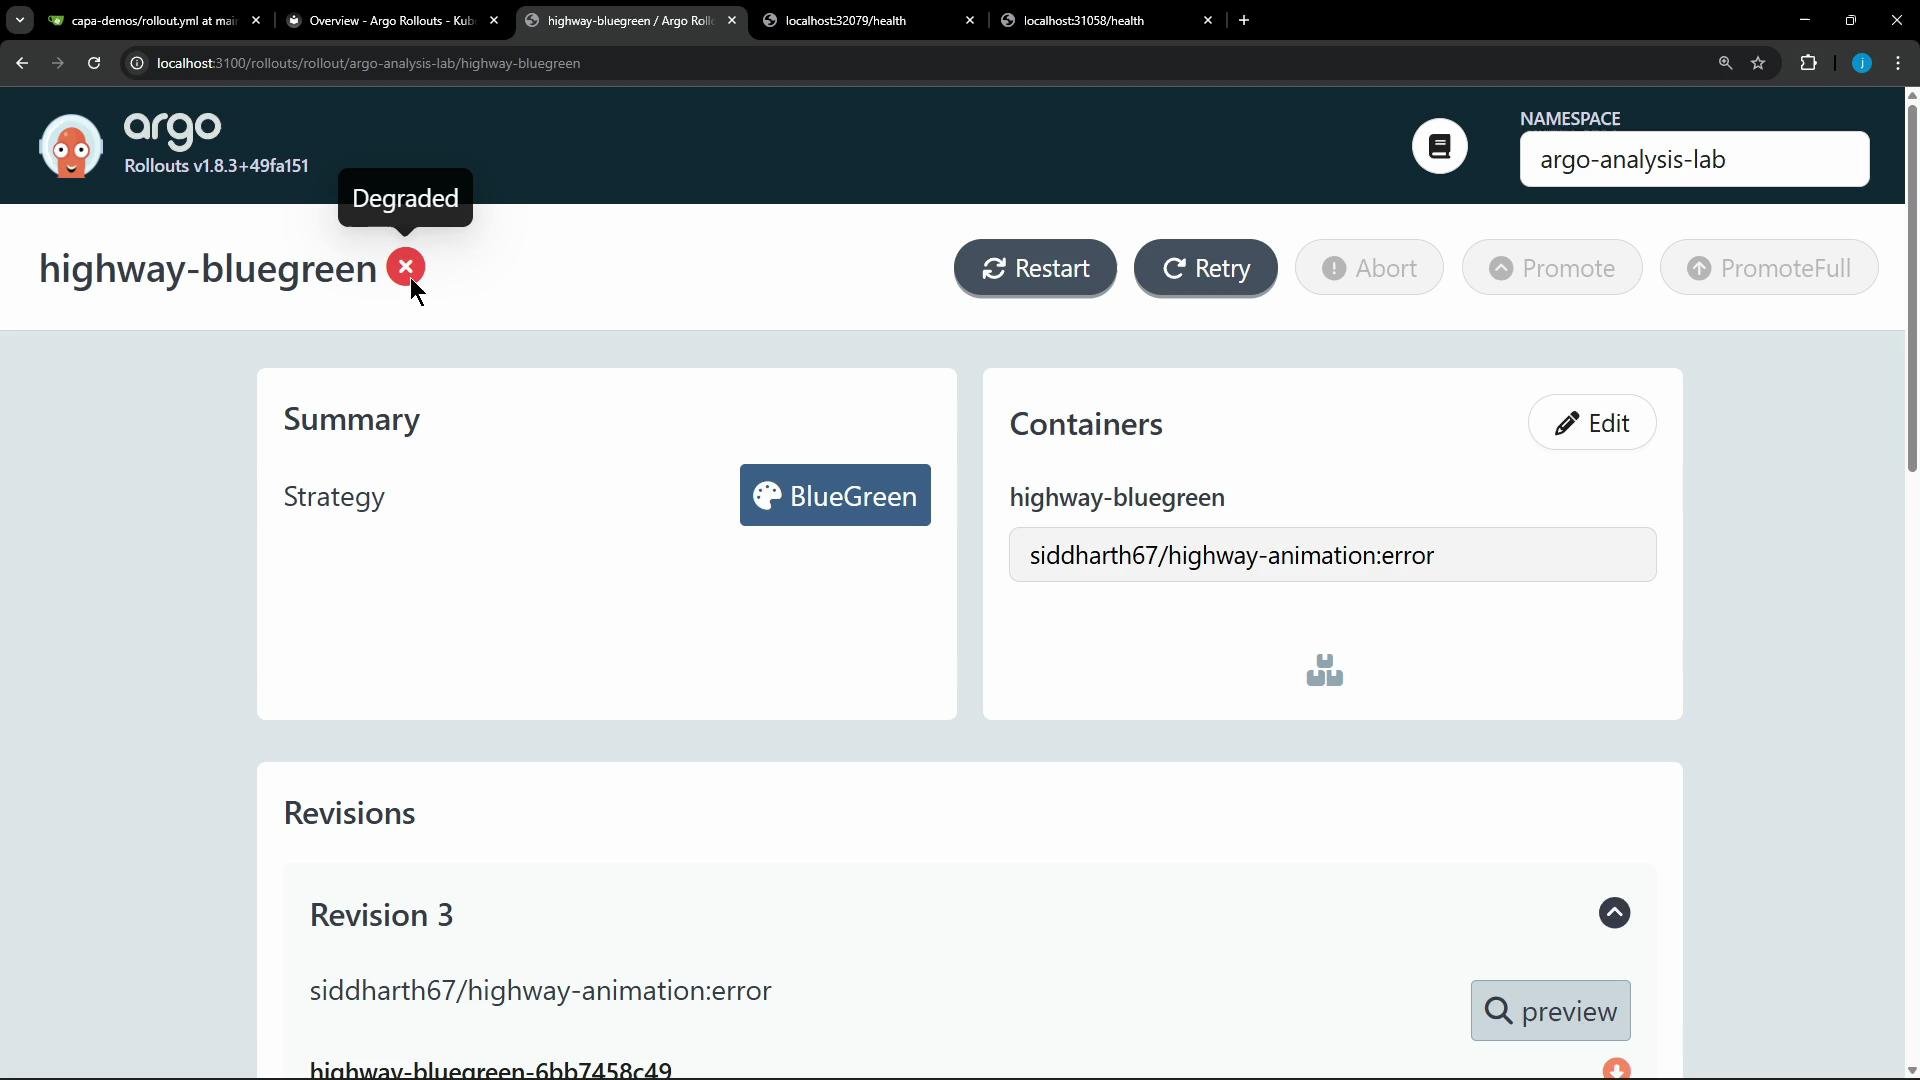
 When the analysis fails, the Rollout controller scales down the preview ReplicaSet and marks the Rollout as degraded/aborted so production traffic is not promoted to the faulty revision:
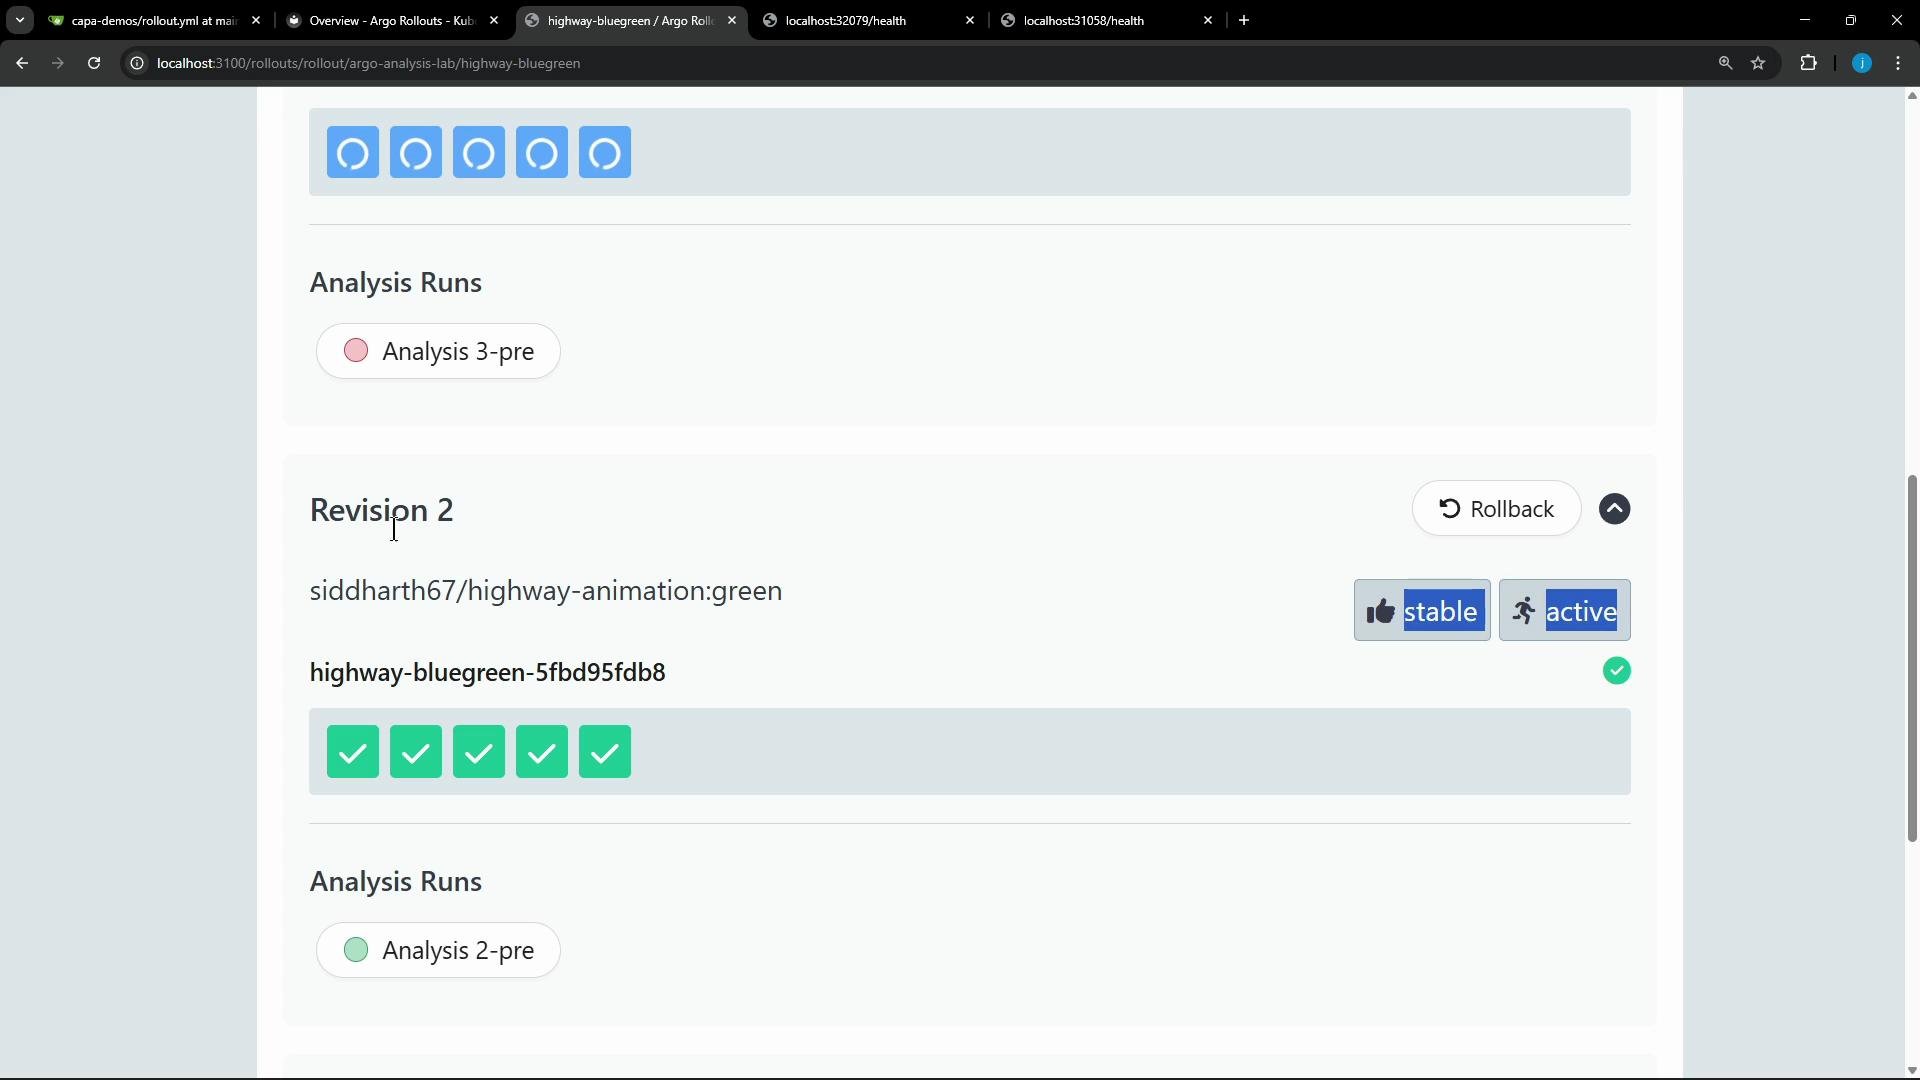
 The production/active revision remains unchanged and continues serving live users:
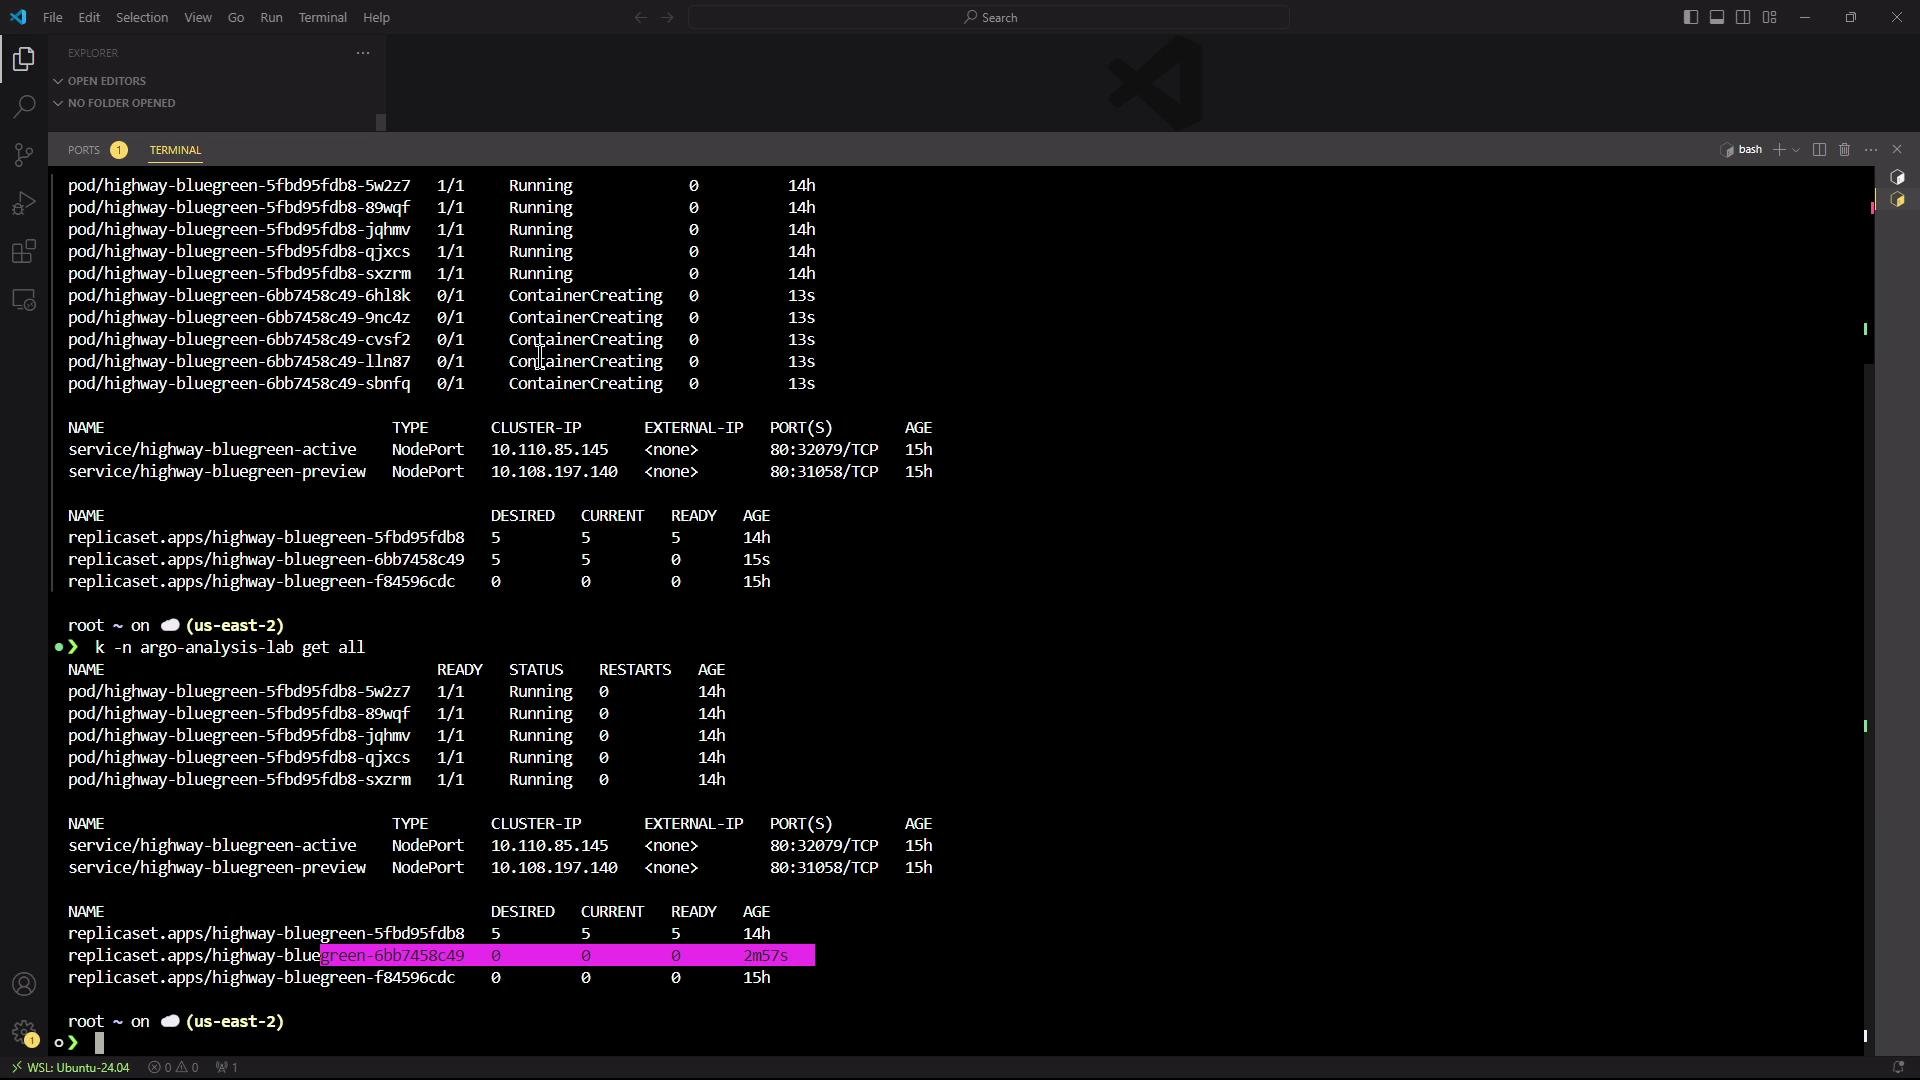
 After the analysis aborted, the preview ReplicaSet was scaled down to zero while the stable ReplicaSet stayed healthy:
 ***
## 3) Inspect Rollout and AnalysisRun status
Use the Argo Rollouts kubectl plugin to view the Rollout status and the abort message:
```bash theme={null}
kubectl argo rollouts get rollout highway-bluegreen -n argo-analysis-lab
```
Condensed sample output showing the aborted update and the message:
```bash theme={null}
Name: highway-bluegreen
Namespace: argo-analysis-lab
Status: ✖ Degraded
Message: RolloutAborted: Rollout aborted update to revision 3: Metric "health-check" assessed Error due to consecutiveErrors (5) > consecutiveErrorLimit (4): "received non 2xx response code: 400"
Strategy: BlueGreen
Images: siddharth67/highway-animation:green (stable, active)
Replicas:
Desired: 5
Current: 5
Updated: 0
Ready: 5
Available: 5
● highway-bluegreen Rollout ✖ Degraded
├─ # revision:3
│ ├─ highway-bluegreen-6bb7458c49 ReplicaSet ● ScaledDown preview,delay:passed
│ └─ ▲ highway-bluegreen-6bb7458c49-3-pre AnalysisRun ▲ Error
└─ # revision:2
└─ highway-bluegreen-5fbd95fdb8 ReplicaSet ✓ Healthy stable,active
```
List AnalysisRuns in the namespace to see which runs succeeded and which failed:
```bash theme={null}
kubectl -n argo-analysis-lab get analysisruns.argoproj.io
```
Example output:
```bash theme={null}
NAME STATUS AGE
highway-bluegreen-5fbd95fdb8-2-pre Successful 14h
highway-bluegreen-6bb7458c49-3-pre Error 4m55s
```
Describe the failing AnalysisRun to see per-measurement results, including the consecutive error count and metric messages:
```bash theme={null}
kubectl -n argo-analysis-lab describe analysisrun highway-bluegreen-6bb7458c49-3-pre
```
Condensed excerpt:
```text theme={null}
Metric Results:
Consecutive Error: 5
Error: 5
Measurements:
Finished At: 2025-10-25T10:11:58Z
Message: received non 2xx response code: 400
Phase: Error
Events:
Warning MetricError rollouts-controller Metric 'health-check' Completed. Result: Error
Warning AnalysisRunError rollouts-controller Analysis Completed. Result: Error
```
***
## 4) Where analysis fits into Rollout strategies
* BlueGreen: analysis can run pre-promotion against the preview Service (as in this demo). The Rollout will only switch active traffic after the pre-promotion analysis succeeds.
* Canary: analysis can be used as a background analysis (runs continuously during the canary rollout) or as an inline step analysis (runs at a specific step/weight).
Example: configure an analysis to start after a specific canary step (start after step that sets weight to 40%):
```yaml theme={null}
apiVersion: argoproj.io/v1alpha1
kind: Rollout
metadata:
name: guestbook
spec:
replicas: 5
strategy:
canary:
analysis:
templates:
- templateName: success-rate
startingStep: 2 # delay starting analysis run until the second step
args:
- name: service-name
value: guestbook-svc.default.svc.cluster.local
steps:
- setWeight: 20
- pause: {duration: 10m}
- setWeight: 40
- pause: {duration: 10m}
```
Example: inline analysis as a canary step (analysis runs as a step):
```yaml theme={null}
apiVersion: argoproj.io/v1alpha1
kind: Rollout
metadata:
name: guestbook
spec:
strategy:
canary:
steps:
- setWeight: 20
- pause: {duration: 5m}
- analysis:
templates:
- templateName: success-rate
args:
- name: service-name
value: guestbook-svc.default.svc.cluster.local
```
***
## 5) AnalysisTemplate example (Prometheus-based metric)
A reusable AnalysisTemplate that queries Prometheus and uses success/failure thresholds:
```yaml theme={null}
apiVersion: argoproj.io/v1alpha1
kind: AnalysisTemplate
metadata:
name: success-rate
spec:
args:
- name: service-name
- name: prometheus-port
metrics:
- name: success-rate
interval: 1m
successCondition: result[0] >= 0.95
failureLimit: 3
provider:
prometheus:
address: http://prometheus.example.com:9090
query: |
sum(rate(istio_requests_total{reporter="source",destination_service=~"{{args.service-name}}",response_code=~"2.."}[1m]))
/
sum(rate(istio_requests_total{reporter="source",destination_service=~"{{args.service-name}}"}[1m]))
```
You can run AnalysisRuns standalone by creating an AnalysisRun object directly (inline metrics or referencing templates). AnalysisTemplates can be defined cluster-wide and referenced with clusterScope: true to reuse them across namespaces.
Example referencing a cluster-scoped template:
```yaml theme={null}
apiVersion: argoproj.io/v1alpha1
kind: Rollout
metadata:
name: guestbook
spec:
strategy:
canary:
steps:
- setWeight: 20
- pause: {duration: 5m}
- analysis:
templates:
- templateName: success-rate
clusterScope: true
args:
- name: service-name
value: guestbook-svc.default.svc.cluster.local
```
***
## Quick reference: useful commands
| Action | Command |
| --------------------------------- | -------------------------------------------------------------------------- |
| Run faulty image locally | `docker run -p 9898:3000 siddharth67/highway-animation:error` |
| Check local health endpoint | `curl http://localhost:9898/health` |
| List resources in namespace | `kubectl -n argo-analysis-lab get all` |
| View Rollout status (argo plugin) | `kubectl argo rollouts get rollout highway-bluegreen -n argo-analysis-lab` |
| List AnalysisRuns | `kubectl -n argo-analysis-lab get analysisruns.argoproj.io` |
| Describe failing AnalysisRun | `kubectl -n argo-analysis-lab describe analysisrun ` |
***
## Summary
* Argo Rollouts runs AnalysisRuns against preview or canary services before promotion.
* If analysis metrics do not meet configured success conditions (for example, repeated non-2xx HTTP responses), the AnalysisRun fails.
* When the AnalysisRun fails, the Rollout aborts the update, scales down the preview ReplicaSet, and prevents production traffic from being promoted to the faulty revision.
* Use AnalysisTemplates (namespace-scoped or cluster-scoped) to standardize health and success checks across Rollouts.
Always verify analysis metrics and thresholds carefully. Incorrect thresholds or misconfigured queries can cause false positives (abort a healthy rollout) or false negatives (allow unhealthy releases).
## Links and references
* [Argo Rollouts documentation — kubectl-argo-rollouts plugin](https://argoproj.github.io/argo-rollouts/commands/kubectl-argo-rollouts/)
* [Argo Rollouts — Analysis overview](https://argoproj.github.io/argo-rollouts/features/analysis/)
* [Prometheus documentation](https://prometheus.io/docs/introduction/overview/)
* [Docker Hub: siddharth67/highway-animation](https://hub.docker.com/)
***
## 3) Inspect Rollout and AnalysisRun status
Use the Argo Rollouts kubectl plugin to view the Rollout status and the abort message:
```bash theme={null}
kubectl argo rollouts get rollout highway-bluegreen -n argo-analysis-lab
```
Condensed sample output showing the aborted update and the message:
```bash theme={null}
Name: highway-bluegreen
Namespace: argo-analysis-lab
Status: ✖ Degraded
Message: RolloutAborted: Rollout aborted update to revision 3: Metric "health-check" assessed Error due to consecutiveErrors (5) > consecutiveErrorLimit (4): "received non 2xx response code: 400"
Strategy: BlueGreen
Images: siddharth67/highway-animation:green (stable, active)
Replicas:
Desired: 5
Current: 5
Updated: 0
Ready: 5
Available: 5
● highway-bluegreen Rollout ✖ Degraded
├─ # revision:3
│ ├─ highway-bluegreen-6bb7458c49 ReplicaSet ● ScaledDown preview,delay:passed
│ └─ ▲ highway-bluegreen-6bb7458c49-3-pre AnalysisRun ▲ Error
└─ # revision:2
└─ highway-bluegreen-5fbd95fdb8 ReplicaSet ✓ Healthy stable,active
```
List AnalysisRuns in the namespace to see which runs succeeded and which failed:
```bash theme={null}
kubectl -n argo-analysis-lab get analysisruns.argoproj.io
```
Example output:
```bash theme={null}
NAME STATUS AGE
highway-bluegreen-5fbd95fdb8-2-pre Successful 14h
highway-bluegreen-6bb7458c49-3-pre Error 4m55s
```
Describe the failing AnalysisRun to see per-measurement results, including the consecutive error count and metric messages:
```bash theme={null}
kubectl -n argo-analysis-lab describe analysisrun highway-bluegreen-6bb7458c49-3-pre
```
Condensed excerpt:
```text theme={null}
Metric Results:
Consecutive Error: 5
Error: 5
Measurements:
Finished At: 2025-10-25T10:11:58Z
Message: received non 2xx response code: 400
Phase: Error
Events:
Warning MetricError rollouts-controller Metric 'health-check' Completed. Result: Error
Warning AnalysisRunError rollouts-controller Analysis Completed. Result: Error
```
***
## 4) Where analysis fits into Rollout strategies
* BlueGreen: analysis can run pre-promotion against the preview Service (as in this demo). The Rollout will only switch active traffic after the pre-promotion analysis succeeds.
* Canary: analysis can be used as a background analysis (runs continuously during the canary rollout) or as an inline step analysis (runs at a specific step/weight).
Example: configure an analysis to start after a specific canary step (start after step that sets weight to 40%):
```yaml theme={null}
apiVersion: argoproj.io/v1alpha1
kind: Rollout
metadata:
name: guestbook
spec:
replicas: 5
strategy:
canary:
analysis:
templates:
- templateName: success-rate
startingStep: 2 # delay starting analysis run until the second step
args:
- name: service-name
value: guestbook-svc.default.svc.cluster.local
steps:
- setWeight: 20
- pause: {duration: 10m}
- setWeight: 40
- pause: {duration: 10m}
```
Example: inline analysis as a canary step (analysis runs as a step):
```yaml theme={null}
apiVersion: argoproj.io/v1alpha1
kind: Rollout
metadata:
name: guestbook
spec:
strategy:
canary:
steps:
- setWeight: 20
- pause: {duration: 5m}
- analysis:
templates:
- templateName: success-rate
args:
- name: service-name
value: guestbook-svc.default.svc.cluster.local
```
***
## 5) AnalysisTemplate example (Prometheus-based metric)
A reusable AnalysisTemplate that queries Prometheus and uses success/failure thresholds:
```yaml theme={null}
apiVersion: argoproj.io/v1alpha1
kind: AnalysisTemplate
metadata:
name: success-rate
spec:
args:
- name: service-name
- name: prometheus-port
metrics:
- name: success-rate
interval: 1m
successCondition: result[0] >= 0.95
failureLimit: 3
provider:
prometheus:
address: http://prometheus.example.com:9090
query: |
sum(rate(istio_requests_total{reporter="source",destination_service=~"{{args.service-name}}",response_code=~"2.."}[1m]))
/
sum(rate(istio_requests_total{reporter="source",destination_service=~"{{args.service-name}}"}[1m]))
```
You can run AnalysisRuns standalone by creating an AnalysisRun object directly (inline metrics or referencing templates). AnalysisTemplates can be defined cluster-wide and referenced with clusterScope: true to reuse them across namespaces.
Example referencing a cluster-scoped template:
```yaml theme={null}
apiVersion: argoproj.io/v1alpha1
kind: Rollout
metadata:
name: guestbook
spec:
strategy:
canary:
steps:
- setWeight: 20
- pause: {duration: 5m}
- analysis:
templates:
- templateName: success-rate
clusterScope: true
args:
- name: service-name
value: guestbook-svc.default.svc.cluster.local
```
***
## Quick reference: useful commands
| Action | Command |
| --------------------------------- | -------------------------------------------------------------------------- |
| Run faulty image locally | `docker run -p 9898:3000 siddharth67/highway-animation:error` |
| Check local health endpoint | `curl http://localhost:9898/health` |
| List resources in namespace | `kubectl -n argo-analysis-lab get all` |
| View Rollout status (argo plugin) | `kubectl argo rollouts get rollout highway-bluegreen -n argo-analysis-lab` |
| List AnalysisRuns | `kubectl -n argo-analysis-lab get analysisruns.argoproj.io` |
| Describe failing AnalysisRun | `kubectl -n argo-analysis-lab describe analysisrun ` |
***
## Summary
* Argo Rollouts runs AnalysisRuns against preview or canary services before promotion.
* If analysis metrics do not meet configured success conditions (for example, repeated non-2xx HTTP responses), the AnalysisRun fails.
* When the AnalysisRun fails, the Rollout aborts the update, scales down the preview ReplicaSet, and prevents production traffic from being promoted to the faulty revision.
* Use AnalysisTemplates (namespace-scoped or cluster-scoped) to standardize health and success checks across Rollouts.
Always verify analysis metrics and thresholds carefully. Incorrect thresholds or misconfigured queries can cause false positives (abort a healthy rollout) or false negatives (allow unhealthy releases).
## Links and references
* [Argo Rollouts documentation — kubectl-argo-rollouts plugin](https://argoproj.github.io/argo-rollouts/commands/kubectl-argo-rollouts/)
* [Argo Rollouts — Analysis overview](https://argoproj.github.io/argo-rollouts/features/analysis/)
* [Prometheus documentation](https://prometheus.io/docs/introduction/overview/)
* [Docker Hub: siddharth67/highway-animation](https://hub.docker.com/)