> ## Documentation Index
> Fetch the complete documentation index at: https://notes.kodekloud.com/llms.txt
> Use this file to discover all available pages before exploring further.
# Demo Metrics Collection with Prometheus
> Guide to validating Prometheus monitoring, understanding its pull scrape model, querying PromQL for gauges and counters, building dashboard aggregates, and troubleshooting missing metrics.
You cannot manage what you cannot measure.
Prometheus is the de facto metrics standard for Kubernetes. Most tools in the ecosystem integrate with Prometheus — Grafana visualizes its metrics, alerting systems trigger from them, and platform operators rely on PromQL to build meaningful dashboards and alerts. This guide walks through verifying a deployed monitoring stack, understanding Prometheus' scrape model, and using common PromQL patterns for dashboards and troubleshooting.
## Verify the monitoring stack
Confirm the monitoring namespace pods are running:
```bash theme={null}
kubectl get pods -n monitoring
NAME READY STATUS RESTARTS AGE
alertmanager-kube-prometheus-stack-alertmanager-0 2/2 Running 0 20m
kube-prometheus-stack-kube-state-metrics-567d49447b-bjq7z 1/1 Running 0 20m
kube-prometheus-stack-operator-5d99b6bd6b-xrg65 1/1 Running 0 20m
kube-prometheus-stack-prometheus-node-exporter-gjr25 1/1 Running 0 20m
prometheus-kube-prometheus-stack-prometheus-0 2/2 Running 0 20m
```
Prometheus uses a pull model: it periodically scrapes configured endpoints rather than relying on agents pushing metrics. This centralizes control over scrape frequency, relabeling, and the exact endpoints collected — applications only need to expose metrics.
Prometheus' pull model gives central control over what and when to scrape. You control scrape intervals, relabeling, and which endpoints are collected — applications only need to expose metrics.
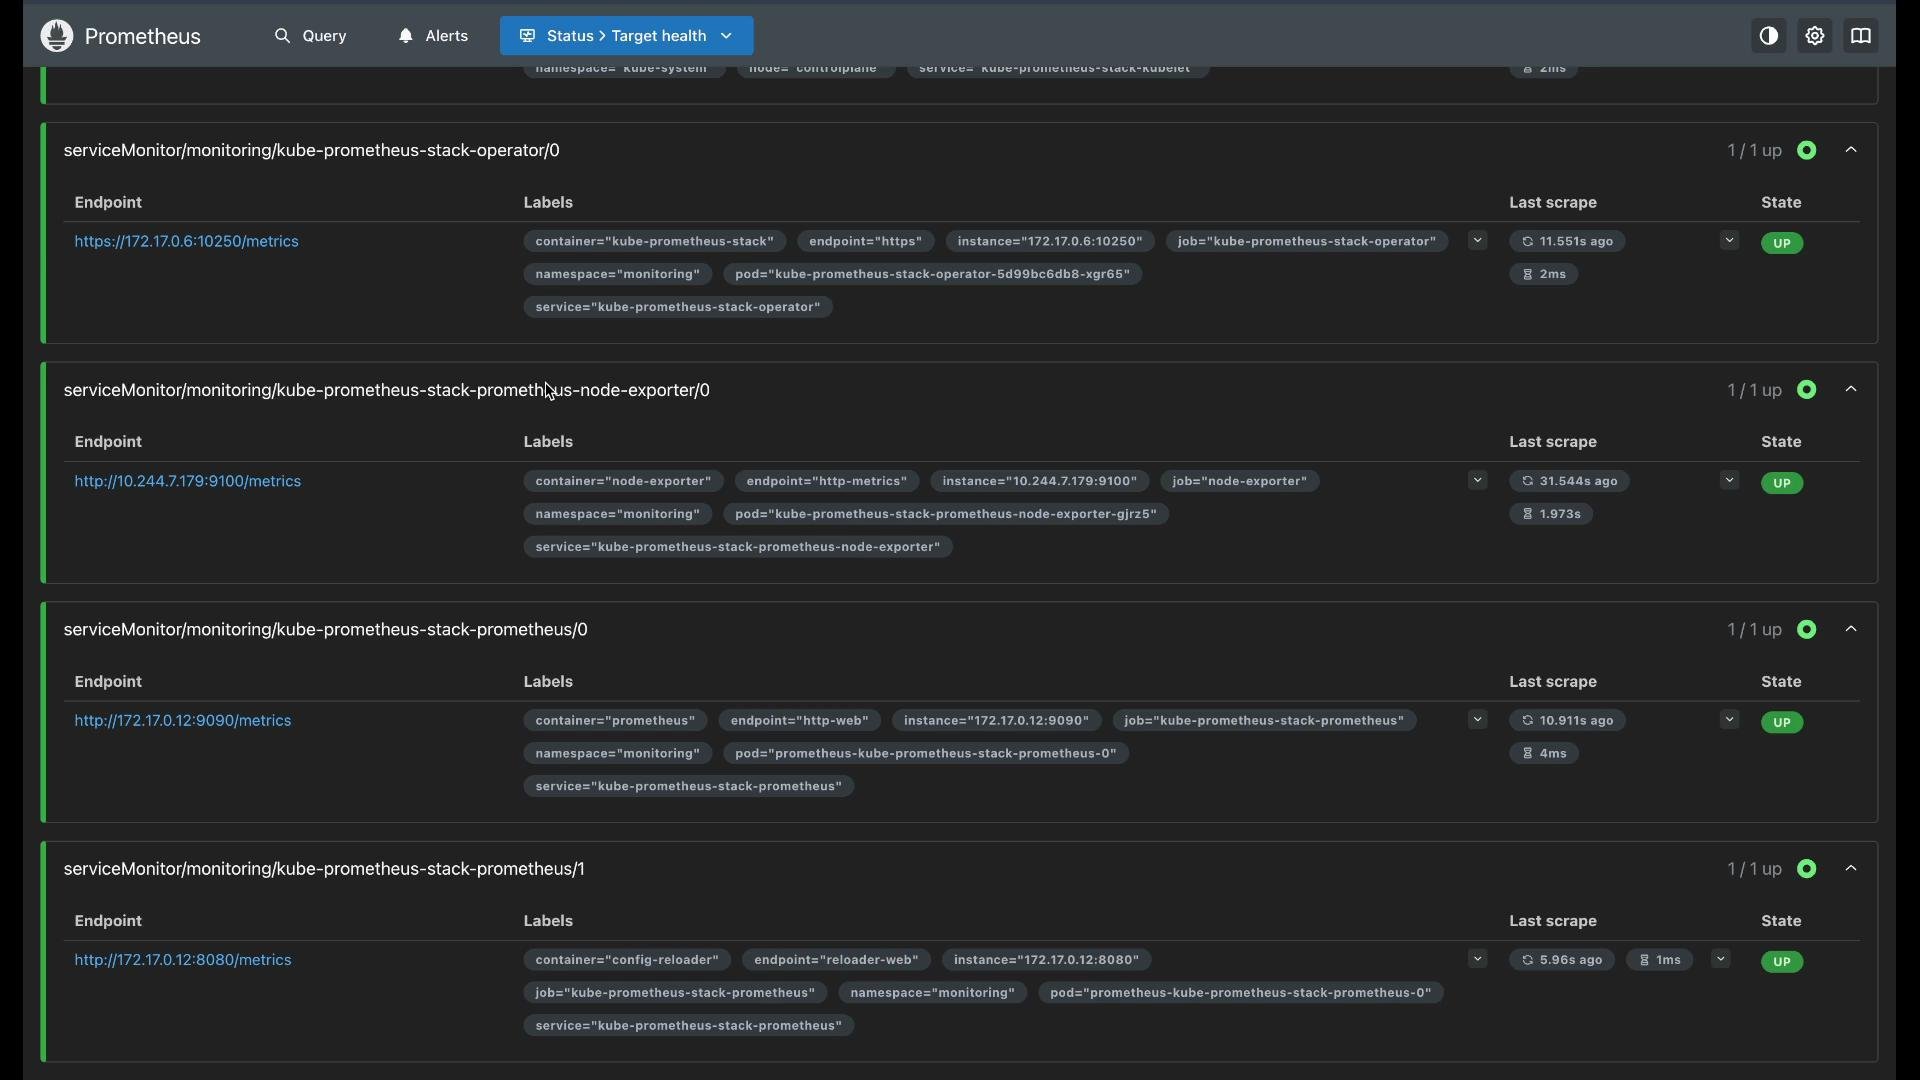
Open the Prometheus UI and navigate to Status → Targets to inspect which endpoints are being scraped and whether they are healthy.
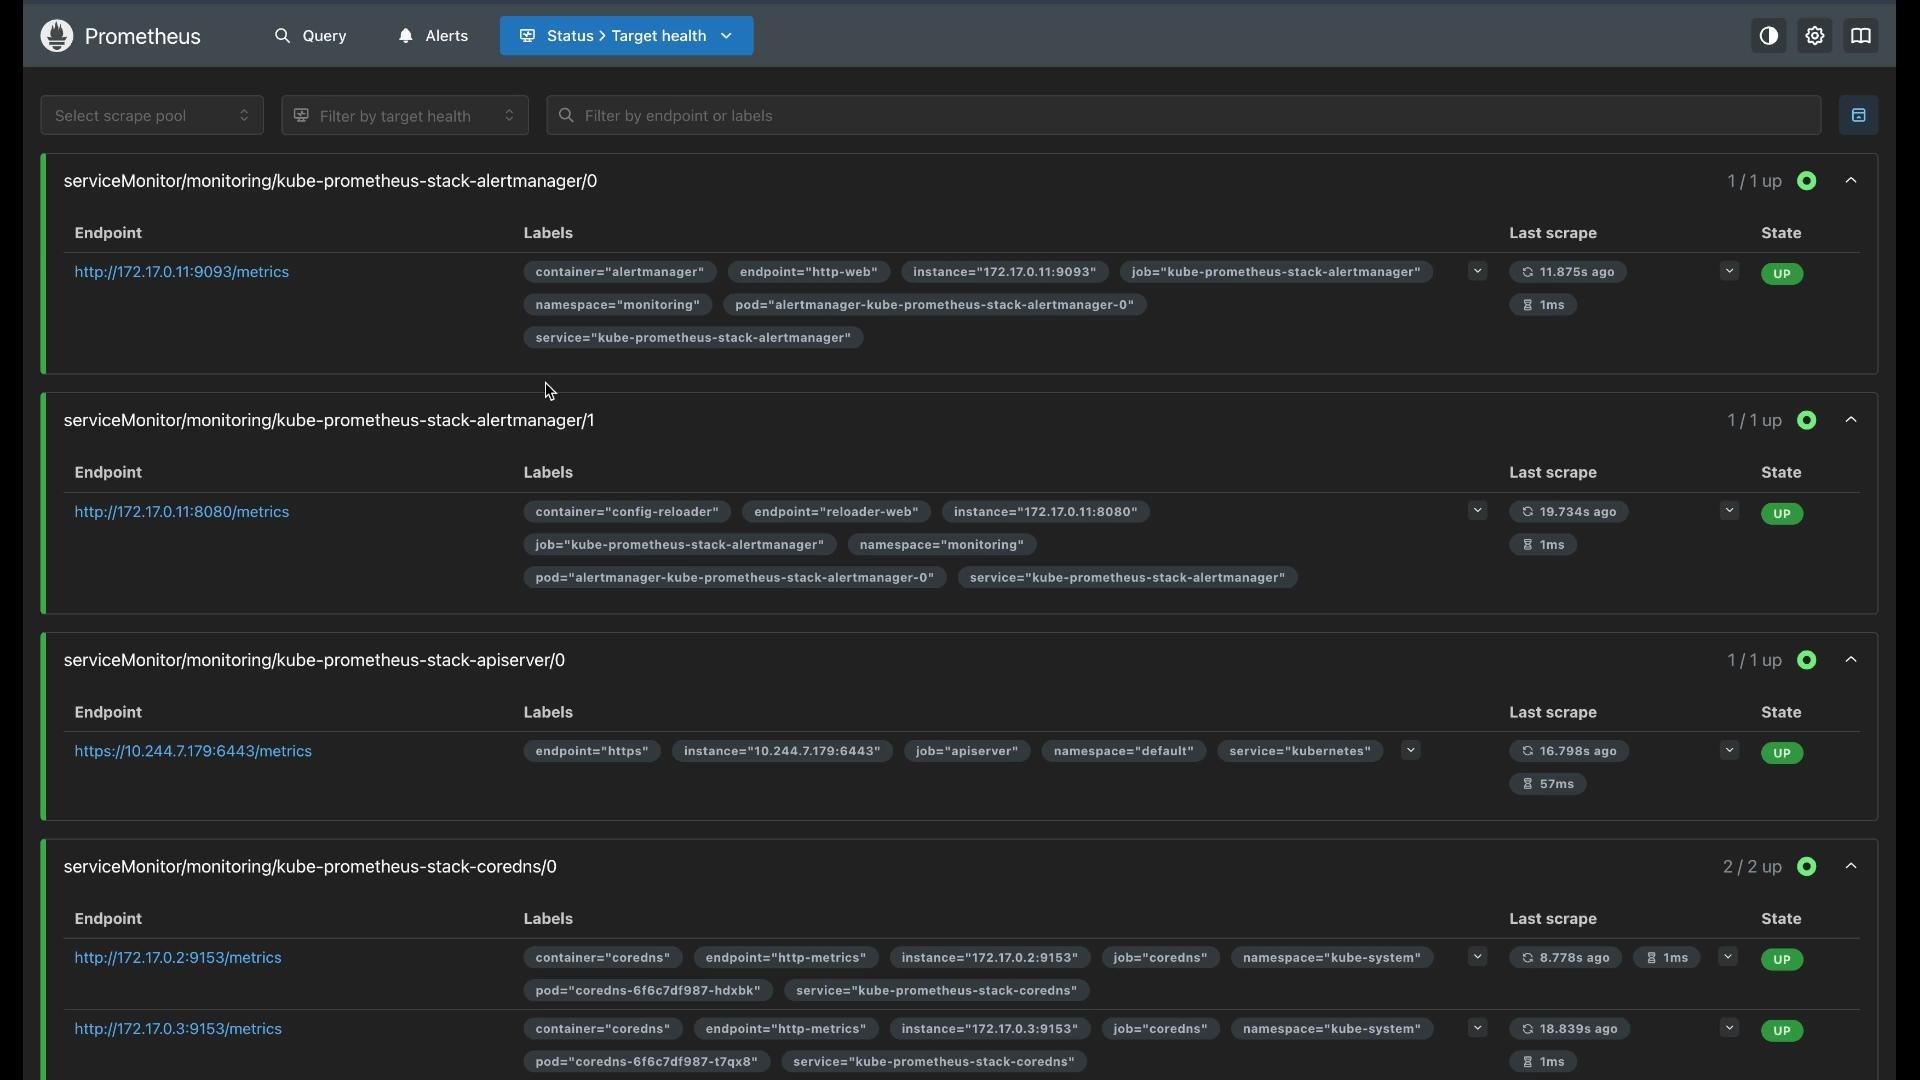 If a target appears as DOWN in the Targets view, Prometheus is not collecting from it — begin troubleshooting from that page (network/DNS, service ports, pod readiness, or relabel rules). When targets are UP, use the Query tab to validate metrics and build expressions.
 ## Querying metrics: Gauges vs Counters
Use the Query tab to inspect raw metrics, test PromQL, and preview series for dashboard panels.
* Gauges represent current states and can go up or down (example: available memory).
* Counters only increase (monotonic) and represent totals over time (example: number of HTTP requests since process start).
### Gauges — example (available memory)
Raw metric:
```promql theme={null}
node_memory_MemAvailable_bytes
```
A sample returned value may look like:
```text theme={null}
node_memory_MemAvailable_bytes{container="node-exporter", endpoint="http-metrics", instance="10.244.7.179:9100", job="node-exporter", namespace="monitoring", pod="kube-prometheus-stack-prometheus-node-exporter"} 52404719616
```
Convert bytes to gibibytes for readability:
```promql theme={null}
node_memory_MemAvailable_bytes / 1024 / 1024 / 1024
```
This returns values like `48.8148`, representing \~48.8 GiB.
### Counters — example (request rates)
Counters accumulate. To measure velocity use `rate()` (or `irate()` for instant rate) over a range vector. For example, requests per second over the last 5 minutes:
```promql theme={null}
rate(apiserver_request_total[5m])
```
Filter by labels (dimensions) to narrow results, e.g., successful GET requests:
```promql theme={null}
rate(apiserver_request_total{verb="GET", code="200"}[5m])
```
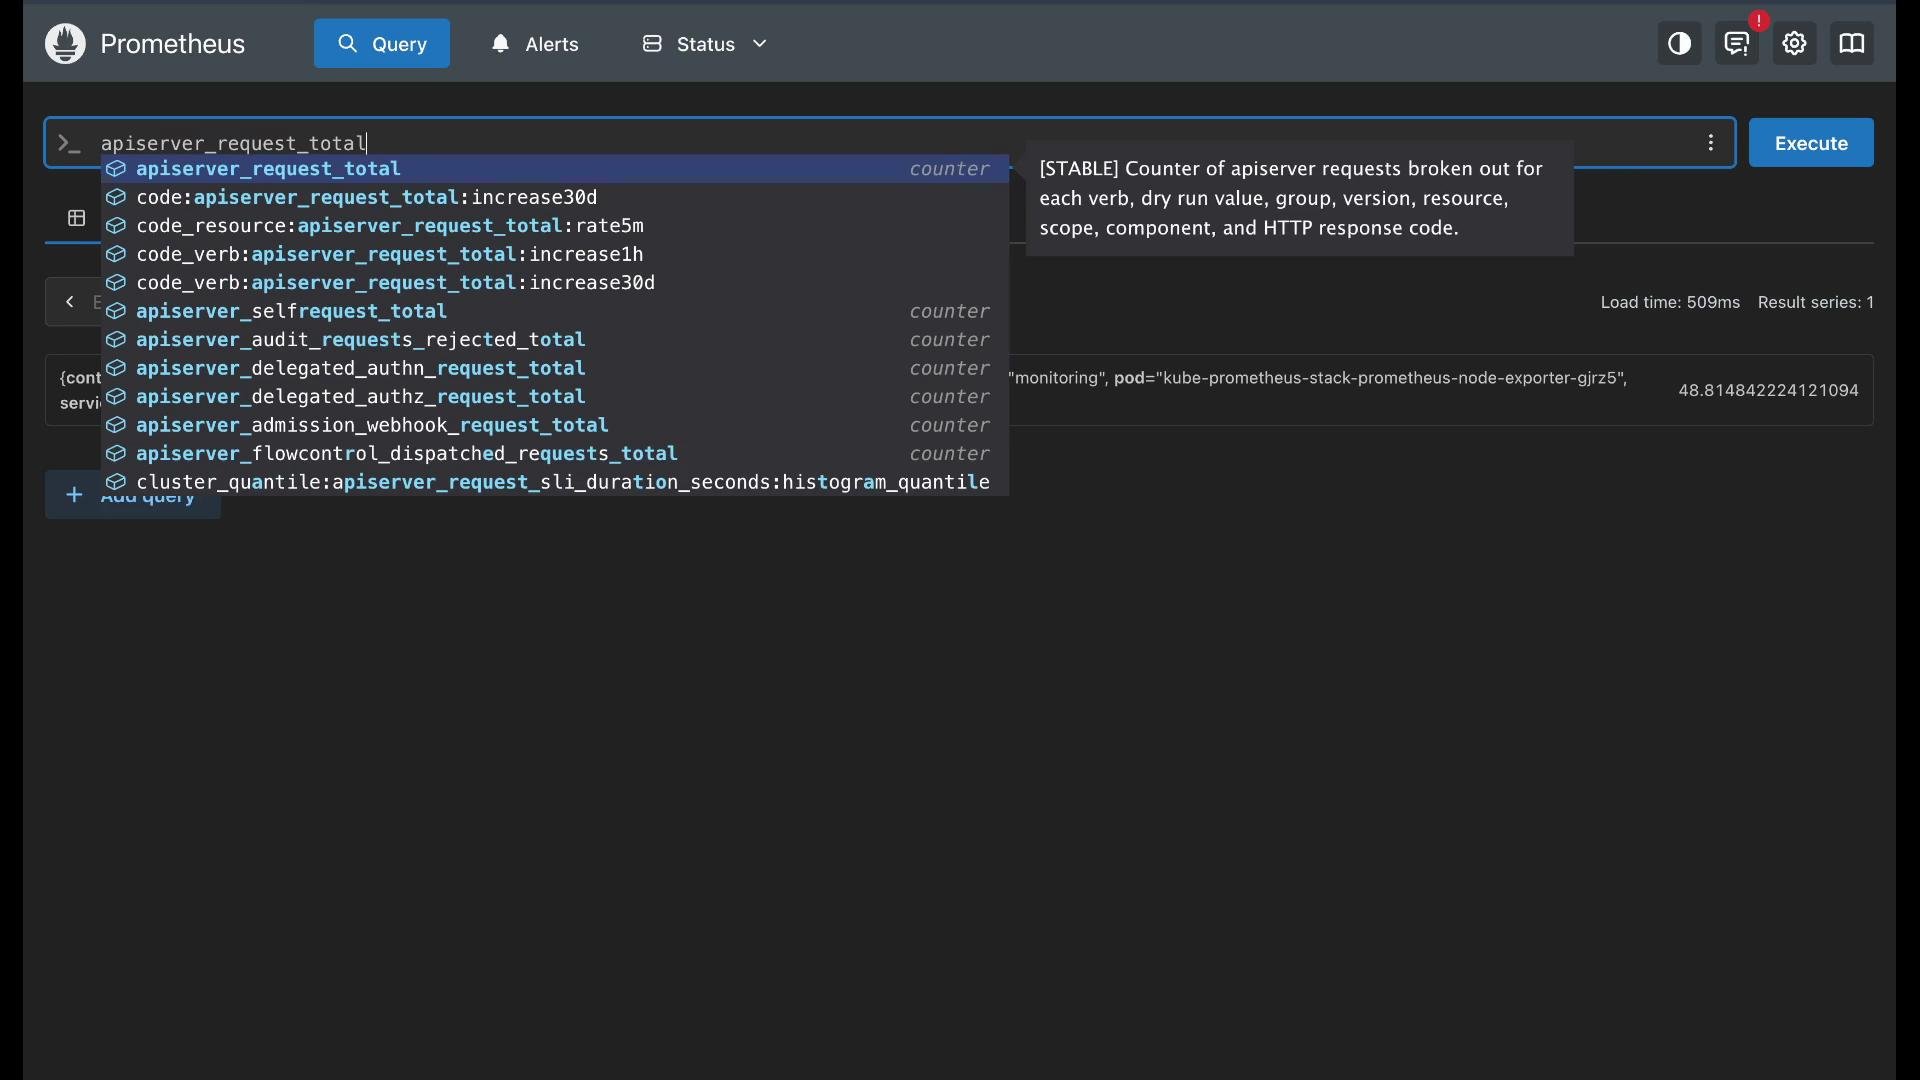
The Prometheus query editor offers metric and label suggestions as you type, aiding discovery.
## Querying metrics: Gauges vs Counters
Use the Query tab to inspect raw metrics, test PromQL, and preview series for dashboard panels.
* Gauges represent current states and can go up or down (example: available memory).
* Counters only increase (monotonic) and represent totals over time (example: number of HTTP requests since process start).
### Gauges — example (available memory)
Raw metric:
```promql theme={null}
node_memory_MemAvailable_bytes
```
A sample returned value may look like:
```text theme={null}
node_memory_MemAvailable_bytes{container="node-exporter", endpoint="http-metrics", instance="10.244.7.179:9100", job="node-exporter", namespace="monitoring", pod="kube-prometheus-stack-prometheus-node-exporter"} 52404719616
```
Convert bytes to gibibytes for readability:
```promql theme={null}
node_memory_MemAvailable_bytes / 1024 / 1024 / 1024
```
This returns values like `48.8148`, representing \~48.8 GiB.
### Counters — example (request rates)
Counters accumulate. To measure velocity use `rate()` (or `irate()` for instant rate) over a range vector. For example, requests per second over the last 5 minutes:
```promql theme={null}
rate(apiserver_request_total[5m])
```
Filter by labels (dimensions) to narrow results, e.g., successful GET requests:
```promql theme={null}
rate(apiserver_request_total{verb="GET", code="200"}[5m])
```
The Prometheus query editor offers metric and label suggestions as you type, aiding discovery.
 ## Aggregation patterns for dashboards
Two common aggregation patterns used in platform dashboards:
1. Distribution (e.g., requests by verb or status code)
2. Error rate percentage (ratio of error requests to total requests)
Useful PromQL functions and examples:
| Function | Purpose | Example |
| --------------------- | ---------------------------------------------------------------------- | --------------------------------------------------- |
| `rate()` | Per-second velocity for counters over a time range | `rate(apiserver_request_total[5m])` |
| `irate()` | Instantaneous per-second rate (useful for very short windows) | `irate(http_requests_total[1m])` |
| `increase()` | Total increment of a counter over a window (use for totals/pie charts) | `increase(http_requests_total[1h])` |
| `sum(...) by (...)` | Aggregate multiple series and group by label(s) | `sum(rate(apiserver_request_total[5m])) by (verb)` |
| `avg(), max(), min()` | Standard aggregations over grouped series | `avg(node_memory_MemAvailable_bytes) by (instance)` |
Note: In table examples, label selectors and brace syntax are shown inline in backticks to avoid MDX parsing issues.
Examples:
* Per-verb request rate aggregated across instances:
```promql theme={null}
sum(rate(apiserver_request_total[5m])) by (verb)
```
* Total requests over the last hour, grouped by HTTP status code (useful for pie charts or totals):
```promql theme={null}
sum(increase(http_requests_total{namespace="workloads"}[1h])) by (code)
```
Use `rate()` (or `irate()` for instant rate) with counters when you want a per-second velocity. Use `increase()` when you want the total increment of a counter over a time window (useful for totals and pie charts).
### Error rate percentage
A common SRE/platform metric is the percentage of requests that resulted in 5xx responses over a short window. Compute it as:
```promql theme={null}
sum(rate(apiserver_request_total{code=~"5.."}[5m]))
/
sum(rate(apiserver_request_total[5m]))
* 100
```
This returns the percentage of requests that had 5xx status codes in the last 5 minutes. Spikes in this metric typically indicate application or infrastructure issues that need investigation.
## Quick troubleshooting checklist
* Check Prometheus → Status → Targets first when metrics are missing.
* Confirm pods and endpoints are Ready and reachable from the Prometheus server.
* Review ServiceMonitor/PodMonitor relabel configs for unintended label drops.
* Use the Query tab to validate that the expected metric names and labels exist.
* Convert raw units (bytes, nanoseconds) into human-friendly units in queries for dashboards.
## Summary
* Prometheus scrapes targets (pull model) — verify targets in Status → Targets if metrics are missing.
* Gauges: read current state; convert units for readability.
* Counters: use `rate()`/`irate()` for velocity and `increase()` for totals.
* Filter using label selectors (e.g., `{verb="GET", code="200"}`) and aggregate with `sum(...) by (...)` for dashboard-friendly series.
## Links and references
* [Prometheus Documentation](https://prometheus.io/docs/)
* [PromQL Reference](https://prometheus.io/docs/prometheus/latest/querying/basics/)
* [Kubernetes Concepts — Monitoring](https://kubernetes.io/docs/concepts/cluster-administration/monitoring/)
* [Grafana — Visualize Prometheus Metrics](https://grafana.com/docs/grafana/latest/datasources/prometheus/)
Now start practicing these Prometheus queries with hands-on exercises to get comfortable building dashboards and alerts.
## Aggregation patterns for dashboards
Two common aggregation patterns used in platform dashboards:
1. Distribution (e.g., requests by verb or status code)
2. Error rate percentage (ratio of error requests to total requests)
Useful PromQL functions and examples:
| Function | Purpose | Example |
| --------------------- | ---------------------------------------------------------------------- | --------------------------------------------------- |
| `rate()` | Per-second velocity for counters over a time range | `rate(apiserver_request_total[5m])` |
| `irate()` | Instantaneous per-second rate (useful for very short windows) | `irate(http_requests_total[1m])` |
| `increase()` | Total increment of a counter over a window (use for totals/pie charts) | `increase(http_requests_total[1h])` |
| `sum(...) by (...)` | Aggregate multiple series and group by label(s) | `sum(rate(apiserver_request_total[5m])) by (verb)` |
| `avg(), max(), min()` | Standard aggregations over grouped series | `avg(node_memory_MemAvailable_bytes) by (instance)` |
Note: In table examples, label selectors and brace syntax are shown inline in backticks to avoid MDX parsing issues.
Examples:
* Per-verb request rate aggregated across instances:
```promql theme={null}
sum(rate(apiserver_request_total[5m])) by (verb)
```
* Total requests over the last hour, grouped by HTTP status code (useful for pie charts or totals):
```promql theme={null}
sum(increase(http_requests_total{namespace="workloads"}[1h])) by (code)
```
Use `rate()` (or `irate()` for instant rate) with counters when you want a per-second velocity. Use `increase()` when you want the total increment of a counter over a time window (useful for totals and pie charts).
### Error rate percentage
A common SRE/platform metric is the percentage of requests that resulted in 5xx responses over a short window. Compute it as:
```promql theme={null}
sum(rate(apiserver_request_total{code=~"5.."}[5m]))
/
sum(rate(apiserver_request_total[5m]))
* 100
```
This returns the percentage of requests that had 5xx status codes in the last 5 minutes. Spikes in this metric typically indicate application or infrastructure issues that need investigation.
## Quick troubleshooting checklist
* Check Prometheus → Status → Targets first when metrics are missing.
* Confirm pods and endpoints are Ready and reachable from the Prometheus server.
* Review ServiceMonitor/PodMonitor relabel configs for unintended label drops.
* Use the Query tab to validate that the expected metric names and labels exist.
* Convert raw units (bytes, nanoseconds) into human-friendly units in queries for dashboards.
## Summary
* Prometheus scrapes targets (pull model) — verify targets in Status → Targets if metrics are missing.
* Gauges: read current state; convert units for readability.
* Counters: use `rate()`/`irate()` for velocity and `increase()` for totals.
* Filter using label selectors (e.g., `{verb="GET", code="200"}`) and aggregate with `sum(...) by (...)` for dashboard-friendly series.
## Links and references
* [Prometheus Documentation](https://prometheus.io/docs/)
* [PromQL Reference](https://prometheus.io/docs/prometheus/latest/querying/basics/)
* [Kubernetes Concepts — Monitoring](https://kubernetes.io/docs/concepts/cluster-administration/monitoring/)
* [Grafana — Visualize Prometheus Metrics](https://grafana.com/docs/grafana/latest/datasources/prometheus/)
Now start practicing these Prometheus queries with hands-on exercises to get comfortable building dashboards and alerts.