> ## Documentation Index
> Fetch the complete documentation index at: https://notes.kodekloud.com/llms.txt
> Use this file to discover all available pages before exploring further.
# Demo Tracing with OpenTelemetry and Jaeger
> Guide to enabling OpenTelemetry tracing for a Kubernetes frontend, exporting traces to Jaeger via OTLP, configuring environment variables, viewing traces, and troubleshooting common issues.
Metrics tell you something is slow. Logs tell you what happened in a single service. But when a request traverses multiple microservices and latency spikes, how do you find the specific service causing the delay? Distributed tracing solves this.
OpenTelemetry (OTel) is the vendor-neutral instrumentation standard that applications use to emit traces. Jaeger is a popular tracing backend that receives, stores, indexes, and visualizes those traces. In short: OpenTelemetry controls how traces are generated and exported; Jaeger handles collection, indexing, and visualization.
In this guide you'll enable tracing for a missing service (the frontend) and inspect traces in the Jaeger UI.
## What to check first: cluster workloads and Jaeger
Confirm Jaeger and your microservices are running:
```bash theme={null}
# Check Jaeger in the observability namespace and application pods in the workloads namespace
kubectl get pods -n observability
kubectl get pods -n workloads
```
Example output (for reference):
```bash theme={null}
controlplane ~ ✗ kubectl get pods -n observability
NAME READY STATUS RESTARTS AGE
jaeger-fd6d64f9-8246c 1/1 Running 0 2m19s
jaeger-operator-648447789c-c4kqx 2/2 Running 0 2m32s
controlplane ~ ✗ kubectl get pods -n workloads
NAME READY STATUS RESTARTS AGE
frontend-svc-69cd76d4fb-ckqlq 1/1 Running 0 2m28s
inventory-svc-84779cd768-jr52m 1/1 Running 0 2m28s
order-svc-54f6b5764d-mb6rs 1/1 Running 0 2m28s
payment-svc-60bd555596-v6267 1/1 Running 0 2m28s
traffic-generator-865f97bfc-kpbkd 1/1 Running 0 2m27s
```
If you open the Jaeger UI you might notice some services (inventory, order, payment) appear in the service dropdown while `frontend-svc` is missing. The frontend pod can be running and receiving traffic but still not appear in Jaeger if it is not configured to emit traces. The application needs OpenTelemetry environment variables to know to produce and export tracing data.
## How tracing is enabled (overview)
You will add OpenTelemetry environment variables to the frontend deployment so the application exports traces to the Jaeger collector using OTLP:
* `OTEL_SERVICE_NAME`: name shown in Jaeger (e.g., `frontend-svc`)
* `OTEL_EXPORTER_OTLP_ENDPOINT`: OTLP endpoint for the Jaeger collector (cluster DNS)
* `OTEL_EXPORTER_OTLP_PROTOCOL`: `grpc` (4317) or `http/protobuf` (4318)
* `OTEL_TRACES_EXPORTER`: typically `otlp`
These variables instruct the OpenTelemetry SDK in your app where and how to send traces.
## Verify the Jaeger collector service and its ports
Before patching the deployment, confirm the collector service and exposed OTLP ports in the `observability` namespace:
```bash theme={null}
kubectl get svc -n observability
```
Example output showing the `jaeger-collector` with OTLP ports:
```bash theme={null}
NAME TYPE CLUSTER-IP PORT(S)
jaeger-agent ClusterIP 172.20.204.3 5775/UDP,5778/TCP,6831/UDP,6832/UDP,14271/TCP
jaeger-collector ClusterIP 172.20.204.3 9411/TCP,14250/TCP,14267/TCP,14268/TCP,14269/TCP,4317/TCP,4318/TCP
jaeger-query ClusterIP 172.20.161.35 16686/TCP
jaeger-ui-nodeport NodePort 172.20.161.35 16686:30086/TCP
```
Quick reference: gRPC uses port `4317`; HTTP/protobuf uses `4318`. Make sure the protocol you set in `OTEL_EXPORTER_OTLP_PROTOCOL` matches the port you target — mismatch is a frequent cause of missing traces.
Ensure the container name you patch matches the container name defined in the deployment. Patching the wrong container leaves the environment variables unapplied and the service will continue not to emit traces.
## Patch the frontend deployment to emit traces
Create or edit a patch that injects the OpenTelemetry environment variables into the frontend container. Example patch snippet (YAML):
```yaml theme={null}
spec:
template:
spec:
containers:
- name: frontend-svc
env:
- name: OTEL_SERVICE_NAME
value: "frontend-svc"
- name: OTEL_EXPORTER_OTLP_ENDPOINT
value: "http://jaeger-collector.observability.svc.cluster.local:4317"
- name: OTEL_EXPORTER_OTLP_PROTOCOL
value: "grpc"
- name: OTEL_TRACES_EXPORTER
value: "otlp"
```
Apply the patch and wait for the rollout:
```bash theme={null}
# Patch the deployment using a local file named frontend-patch.yaml
kubectl patch deployment frontend-svc -n workloads --patch "$(cat frontend-patch.yaml)"
# Wait for the new pod to roll out
kubectl rollout status deployment/frontend-svc -n workloads
```
Notes:
* If your cluster uses the collector in a different namespace, update the endpoint DNS accordingly (for example, `jaeger-collector..svc.cluster.local`).
* Choose `grpc` and port `4317` together, or `http/protobuf` and port `4318` together.
## Recommended environment variables (table)
| Variable | Purpose | Example value |
| ----------------------------- | ---------------------------------------------------- | -------------------------------------------------------------- |
| `OTEL_SERVICE_NAME` | Human-friendly service name in Jaeger | `frontend-svc` |
| `OTEL_EXPORTER_OTLP_ENDPOINT` | OTLP endpoint for the collector (cluster DNS + port) | `http://jaeger-collector.observability.svc.cluster.local:4317` |
| `OTEL_EXPORTER_OTLP_PROTOCOL` | Transport protocol for OTLP | `grpc` or `http/protobuf` |
| `OTEL_TRACES_EXPORTER` | Which exporter to use | `otlp` |
## Confirm traces in Jaeger
After the new pod starts with the environment variables applied:
1. Open the Jaeger UI (see Jaeger docs: [https://www.jaegertracing.io/docs/latest/getting-started/](https://www.jaegertracing.io/docs/latest/getting-started/)).
2. Refresh the service dropdown — `frontend-svc` should now be available.
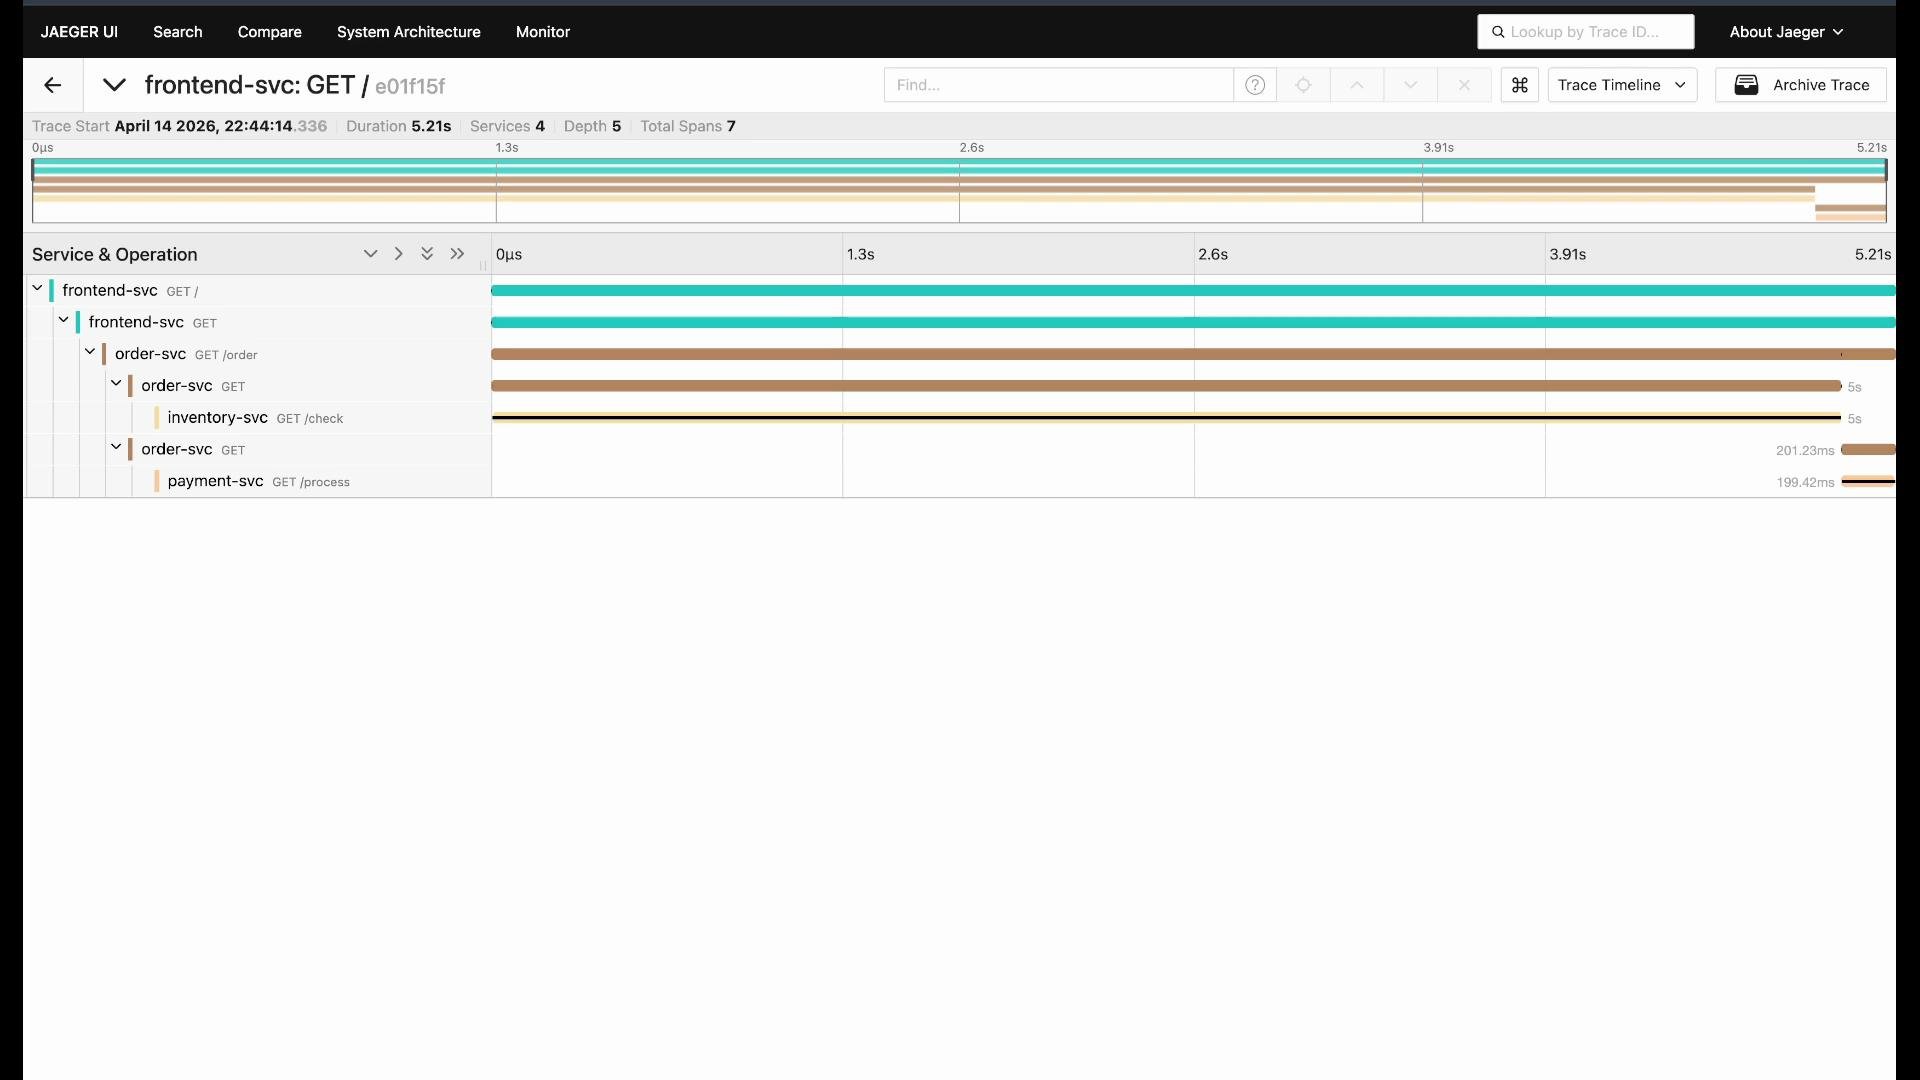
3. Search for traces and inspect any trace to view the waterfall visualization.
 Interpretation tips:
* The top-level span is the overall request (frontend); nested spans are downstream calls.
* The widest span typically indicates where time is being spent — start investigating there (in the example, `inventory-svc` dominates latency).
* In large systems, the waterfall view quickly highlights the slowest component and the sequence of calls.
## Troubleshooting checklist
* Confirm the four OpenTelemetry environment variables are present in the running pod:
* `kubectl describe pod -n workloads` or `kubectl exec -n workloads -- printenv | grep OTEL`
* Verify the OTLP endpoint points to the correct collector service DNS and port.
* Ensure `OTEL_EXPORTER_OTLP_PROTOCOL` matches the endpoint port:
* `grpc` → port `4317`
* `http/protobuf` → port `4318`
* Make sure `OTEL_TRACES_EXPORTER` is set to `otlp`.
* Confirm you patched the correct deployment and container name.
If traces do not appear, the most common issues are: incorrect collector endpoint (DNS or port), protocol/port mismatch, or patching the wrong container name. Double-check those first.
## Wrap-up and next steps
This walkthrough showed how to enable OpenTelemetry instrumentation for a Kubernetes-deployed service and visualize distributed traces in Jaeger. Try these steps in a lab or test cluster, and experiment with different OTLP protocols and collector configurations to understand how instrumented services communicate with Jaeger.
Further reading:
* OpenTelemetry: [https://opentelemetry.io/](https://opentelemetry.io/)
* Jaeger Tracing: [https://www.jaegertracing.io/](https://www.jaegertracing.io/)
Interpretation tips:
* The top-level span is the overall request (frontend); nested spans are downstream calls.
* The widest span typically indicates where time is being spent — start investigating there (in the example, `inventory-svc` dominates latency).
* In large systems, the waterfall view quickly highlights the slowest component and the sequence of calls.
## Troubleshooting checklist
* Confirm the four OpenTelemetry environment variables are present in the running pod:
* `kubectl describe pod -n workloads` or `kubectl exec -n workloads -- printenv | grep OTEL`
* Verify the OTLP endpoint points to the correct collector service DNS and port.
* Ensure `OTEL_EXPORTER_OTLP_PROTOCOL` matches the endpoint port:
* `grpc` → port `4317`
* `http/protobuf` → port `4318`
* Make sure `OTEL_TRACES_EXPORTER` is set to `otlp`.
* Confirm you patched the correct deployment and container name.
If traces do not appear, the most common issues are: incorrect collector endpoint (DNS or port), protocol/port mismatch, or patching the wrong container name. Double-check those first.
## Wrap-up and next steps
This walkthrough showed how to enable OpenTelemetry instrumentation for a Kubernetes-deployed service and visualize distributed traces in Jaeger. Try these steps in a lab or test cluster, and experiment with different OTLP protocols and collector configurations to understand how instrumented services communicate with Jaeger.
Further reading:
* OpenTelemetry: [https://opentelemetry.io/](https://opentelemetry.io/)
* Jaeger Tracing: [https://www.jaegertracing.io/](https://www.jaegertracing.io/)