> ## Documentation Index
> Fetch the complete documentation index at: https://notes.kodekloud.com/llms.txt
> Use this file to discover all available pages before exploring further.
# Distributed Tracing Context Propagation and Trace Analysis
> Explains distributed tracing, trace data model and context propagation, configuring OpenTelemetry to export traces to Jaeger, and using traces to locate performance bottlenecks in microservices.
We've already covered metrics and alerting. This lesson focuses on the third observability pillar: distributed tracing.
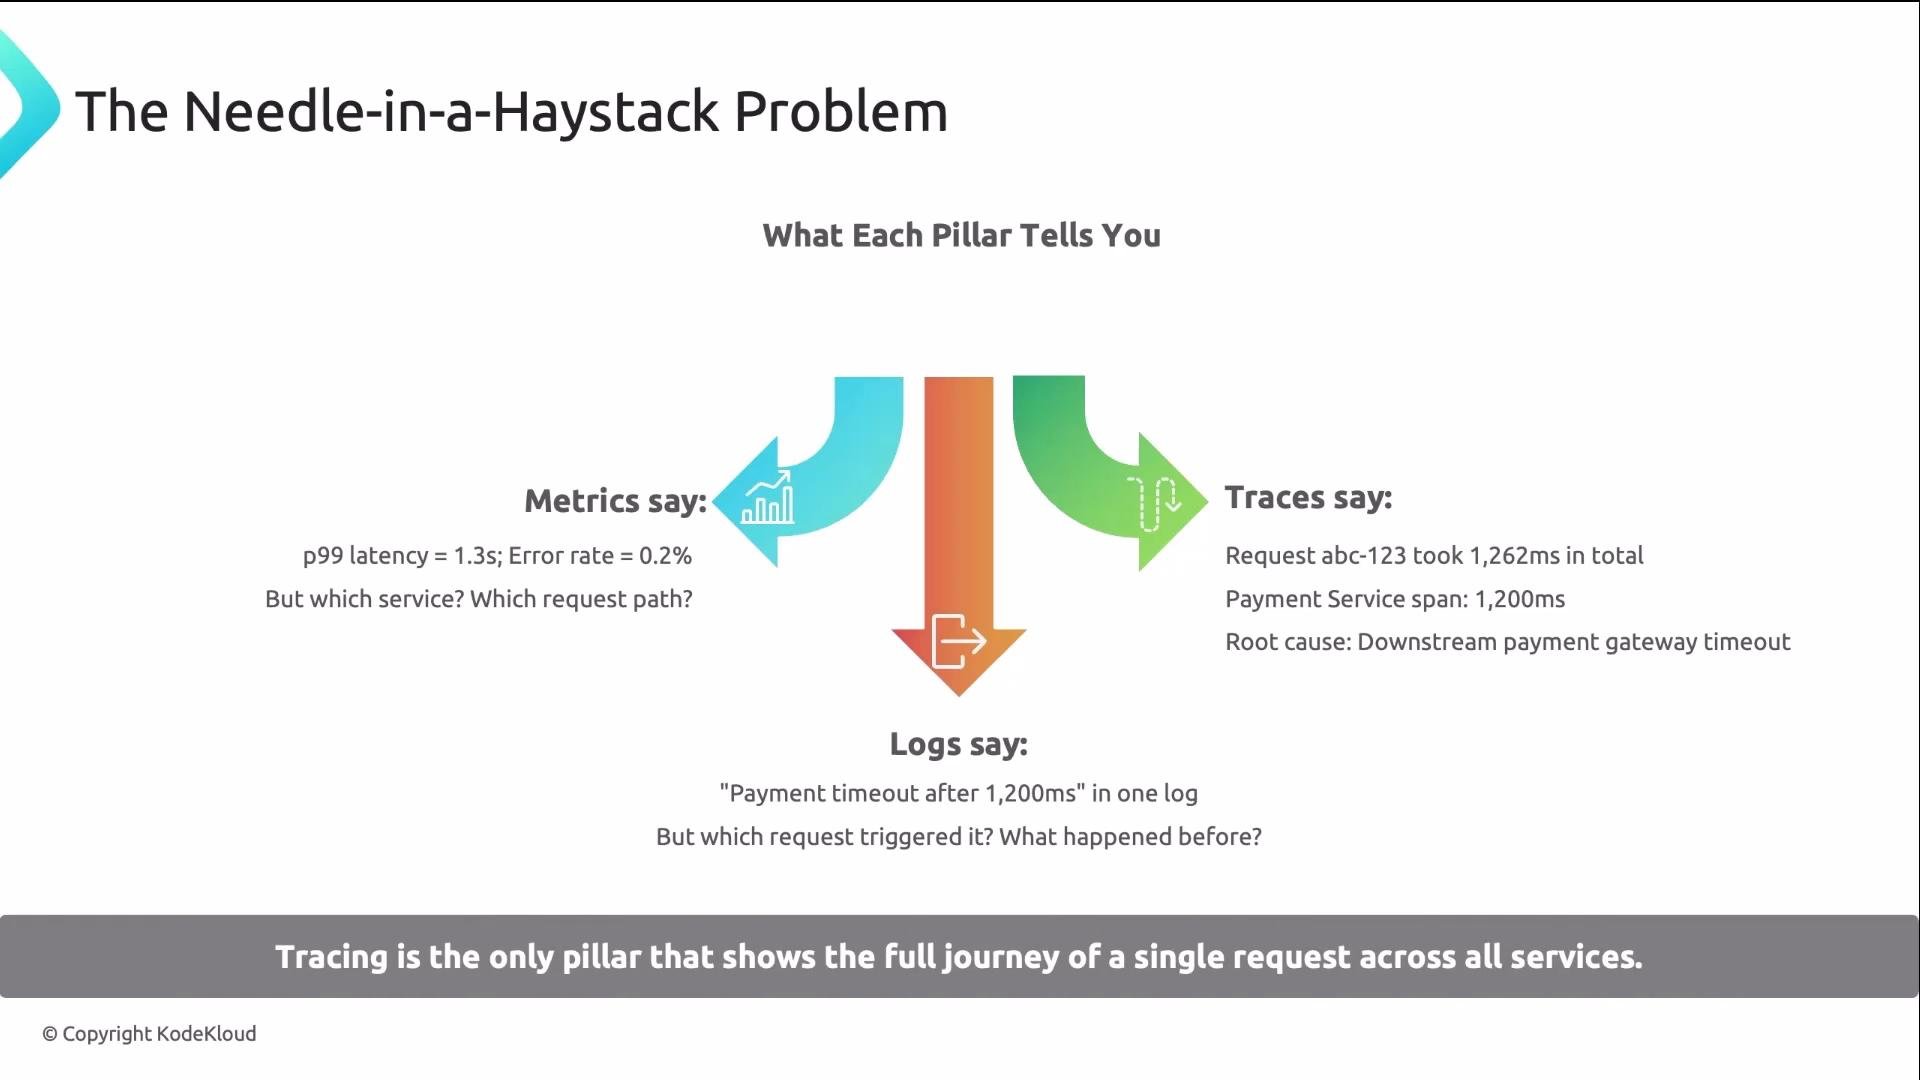
* Metrics tell you *something* is slow (for example, p99 latency = 1.3s).
* Logs provide context for a specific service (for example, a payment timeout at 1,200ms).
* Traces show the full, end-to-end path of a request so you can pinpoint *where* the bottleneck lives.
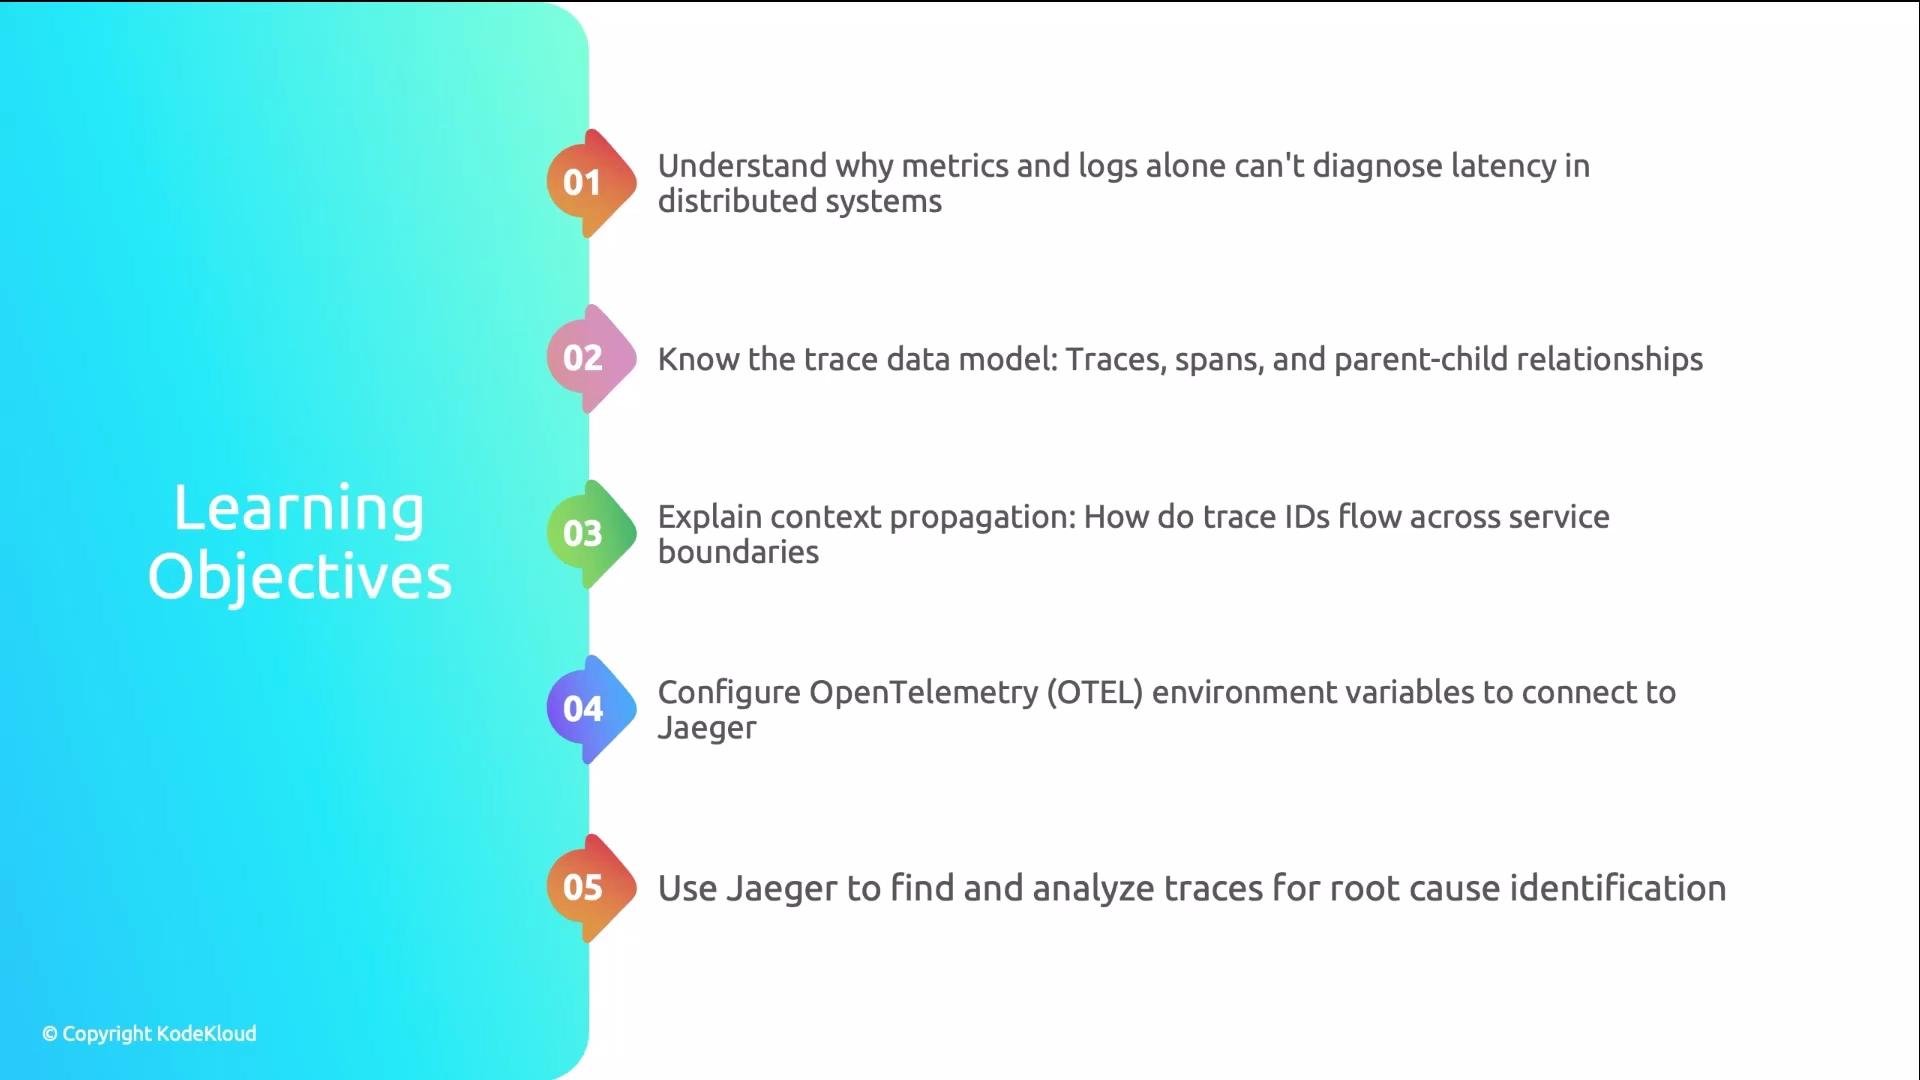
By the end of this lesson you'll understand the trace data model, how context propagation works, how to configure OpenTelemetry (OTEL) to export traces to Jaeger, and how to read a trace to find the performance bottleneck.
 Conceptual overview
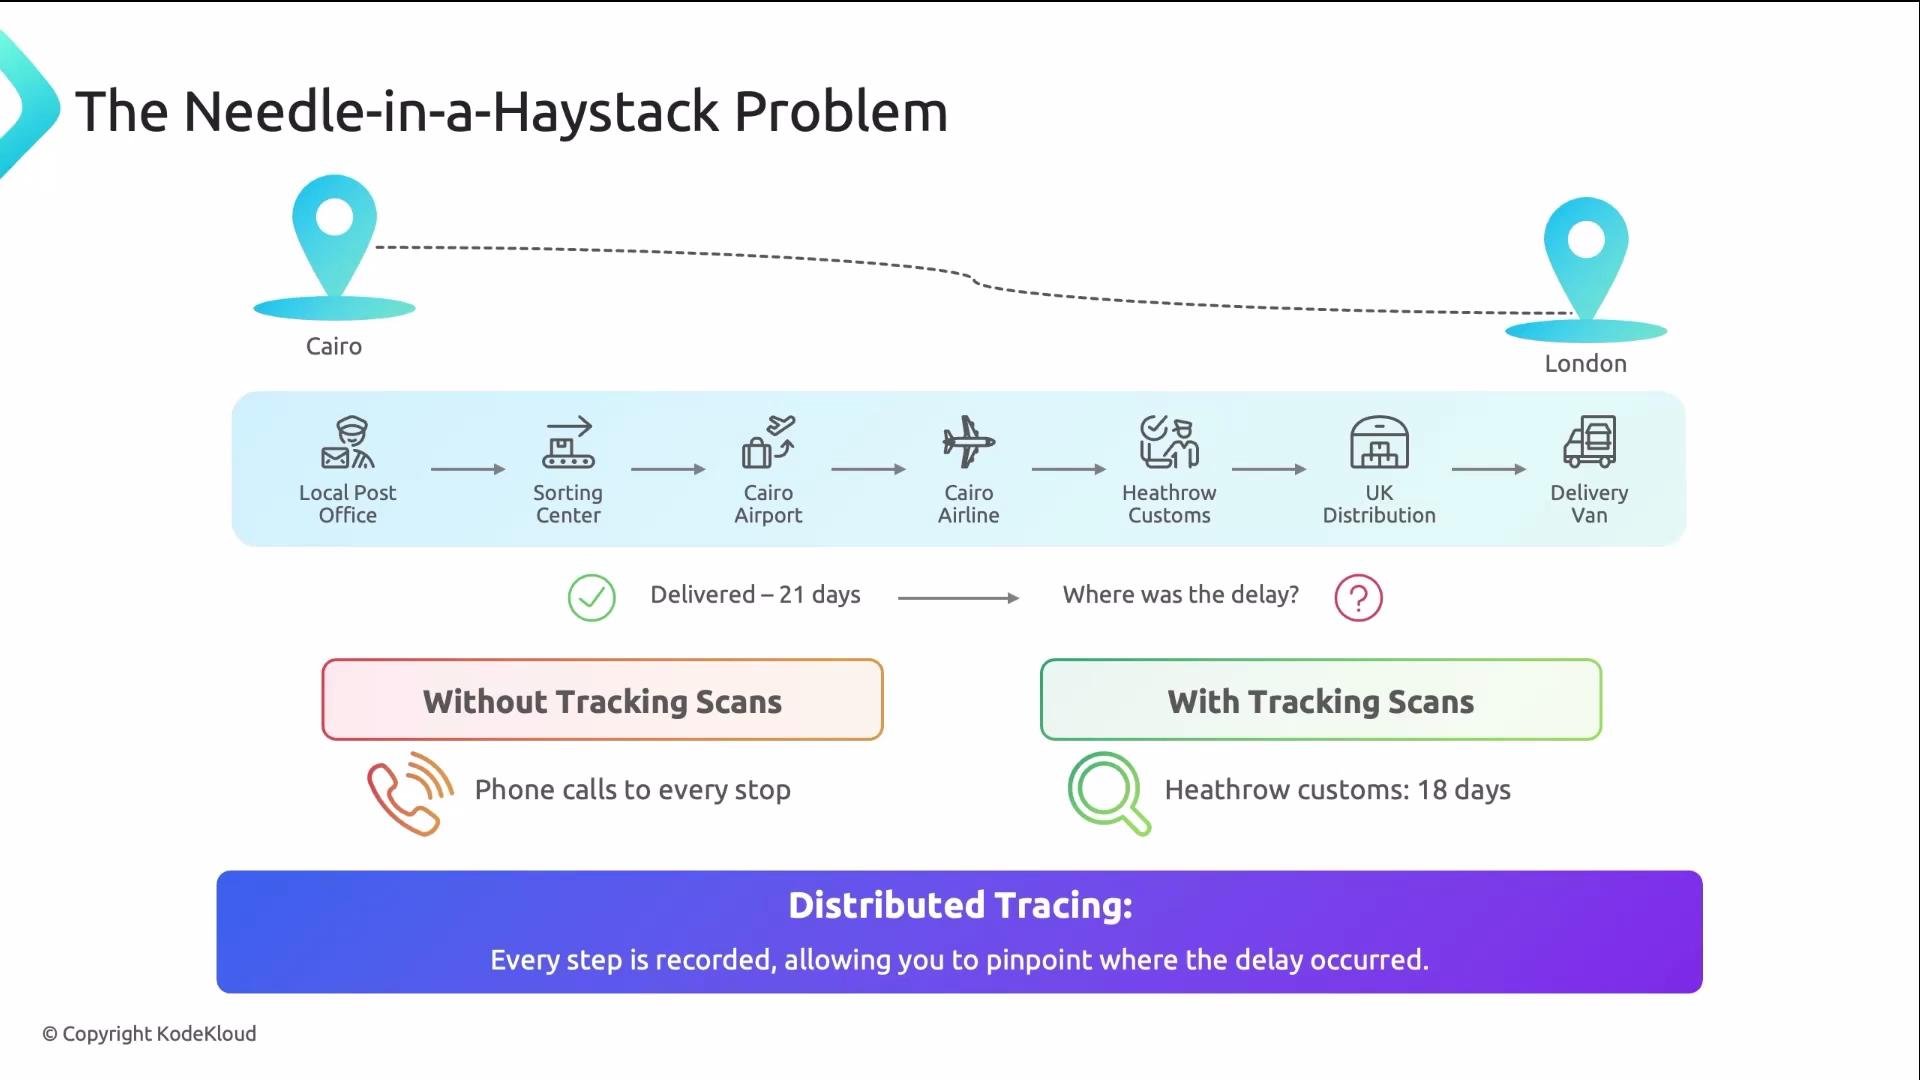
Think of tracing as package tracking from Cairo to London. Each time the package is scanned (local post office, sorting center, airport, customs, final delivery) you get timestamps for when the package was handled. If delivery took 21 days, the scans reveal which hop caused the delay (for example, Heathrow Customs held it for 18 days). In a distributed system, spans are those scans; a trace is the full journey.
Conceptual overview
Think of tracing as package tracking from Cairo to London. Each time the package is scanned (local post office, sorting center, airport, customs, final delivery) you get timestamps for when the package was handled. If delivery took 21 days, the scans reveal which hop caused the delay (for example, Heathrow Customs held it for 18 days). In a distributed system, spans are those scans; a trace is the full journey.
 Why tracing matters
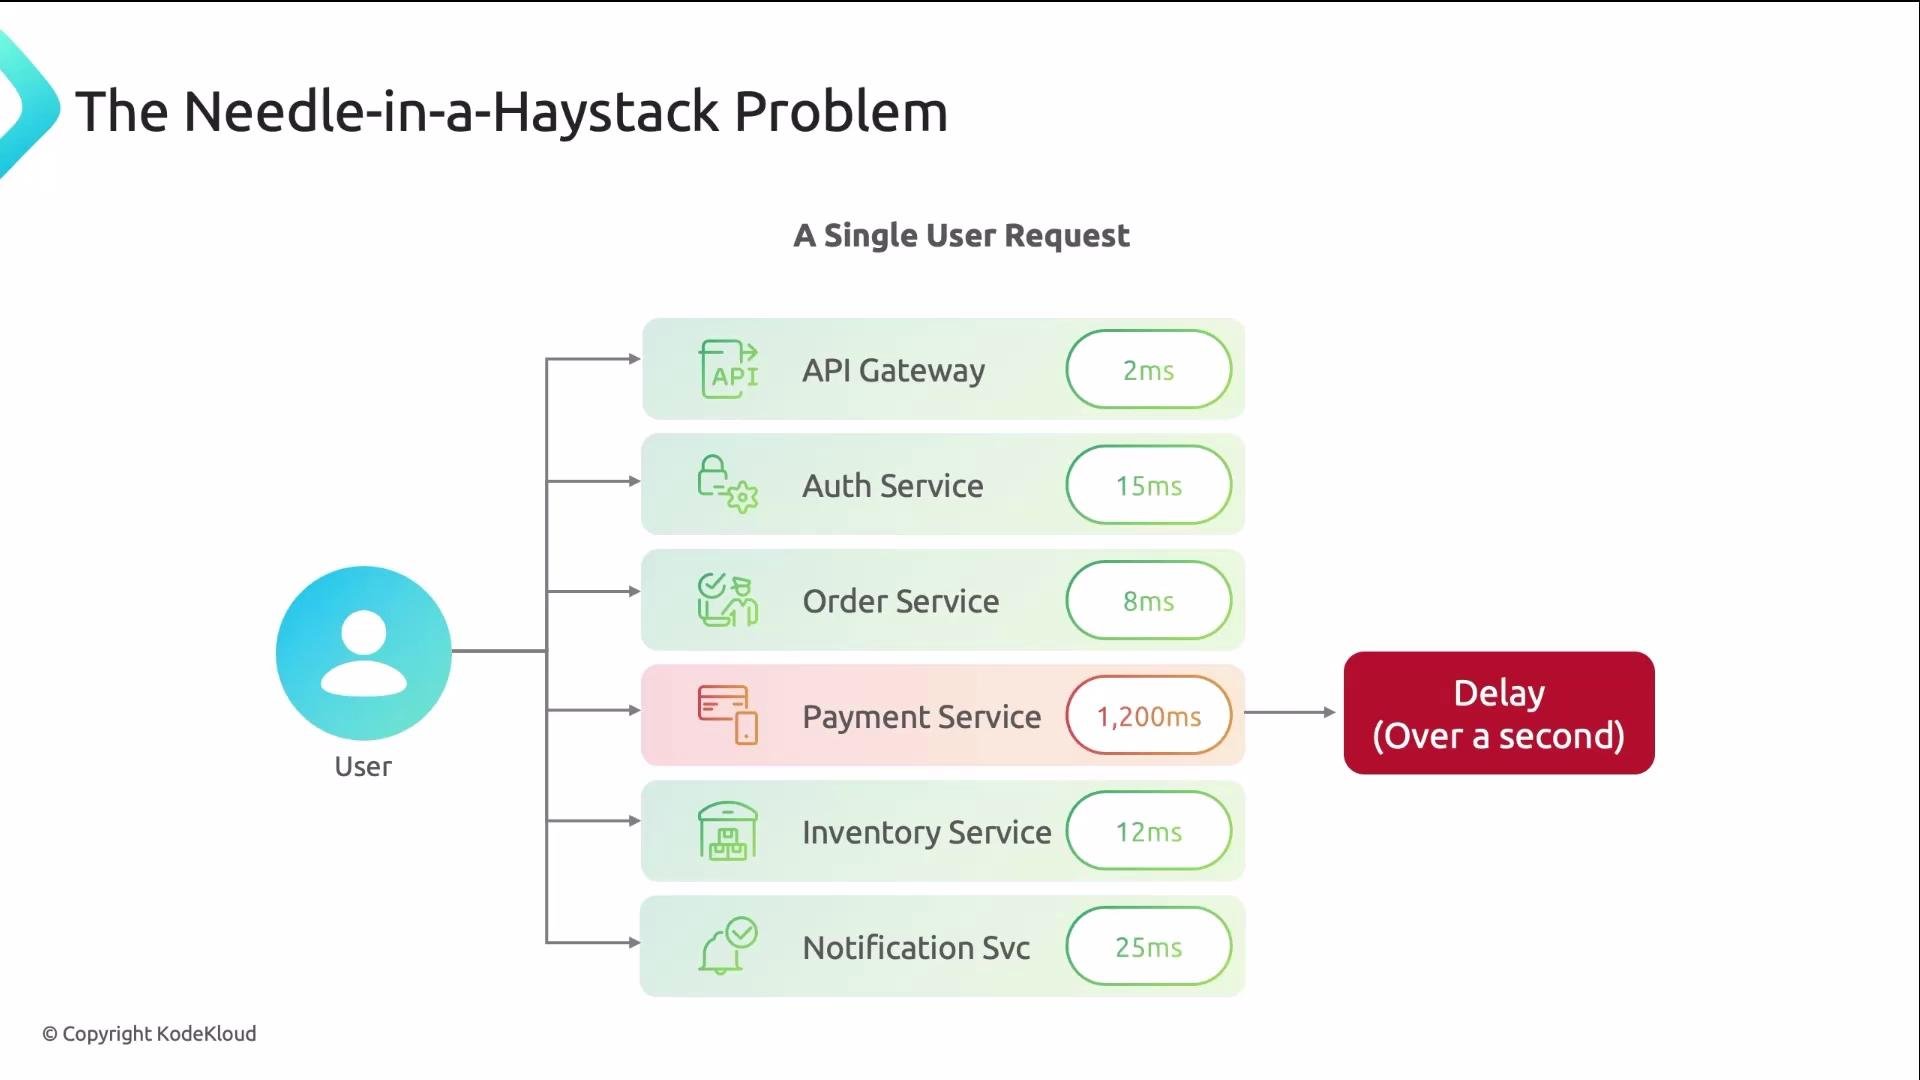
In microservices, a single user request can traverse many services. Imagine six services: five respond in \~25ms each, and one payment service takes 1,200ms. The slow payment service makes the entire request take over a second. Without traces, you would need to query each service to find the culprit. Tracing reveals the slow hop immediately.
Why tracing matters
In microservices, a single user request can traverse many services. Imagine six services: five respond in \~25ms each, and one payment service takes 1,200ms. The slow payment service makes the entire request take over a second. Without traces, you would need to query each service to find the culprit. Tracing reveals the slow hop immediately.
 How the three pillars complement each other
| Pillar | What it answers | Typical use |
| ------- | ---------------------------------------------------- | ------------------------------------------------------ |
| Metrics | "What" — aggregate view (e.g., p99 latency = `1.3s`) | Detect anomalies, set alerts |
| Logs | "Why" — detailed events in a service | Debug specific errors or exceptions |
| Traces | "Where" — end-to-end request flow and timing | Pinpoint which service/span causes latency or failures |
Each pillar narrows the investigation for the next: metrics detect the problem, logs add context, traces show where to focus.
How the three pillars complement each other
| Pillar | What it answers | Typical use |
| ------- | ---------------------------------------------------- | ------------------------------------------------------ |
| Metrics | "What" — aggregate view (e.g., p99 latency = `1.3s`) | Detect anomalies, set alerts |
| Logs | "Why" — detailed events in a service | Debug specific errors or exceptions |
| Traces | "Where" — end-to-end request flow and timing | Pinpoint which service/span causes latency or failures |
Each pillar narrows the investigation for the next: metrics detect the problem, logs add context, traces show where to focus.
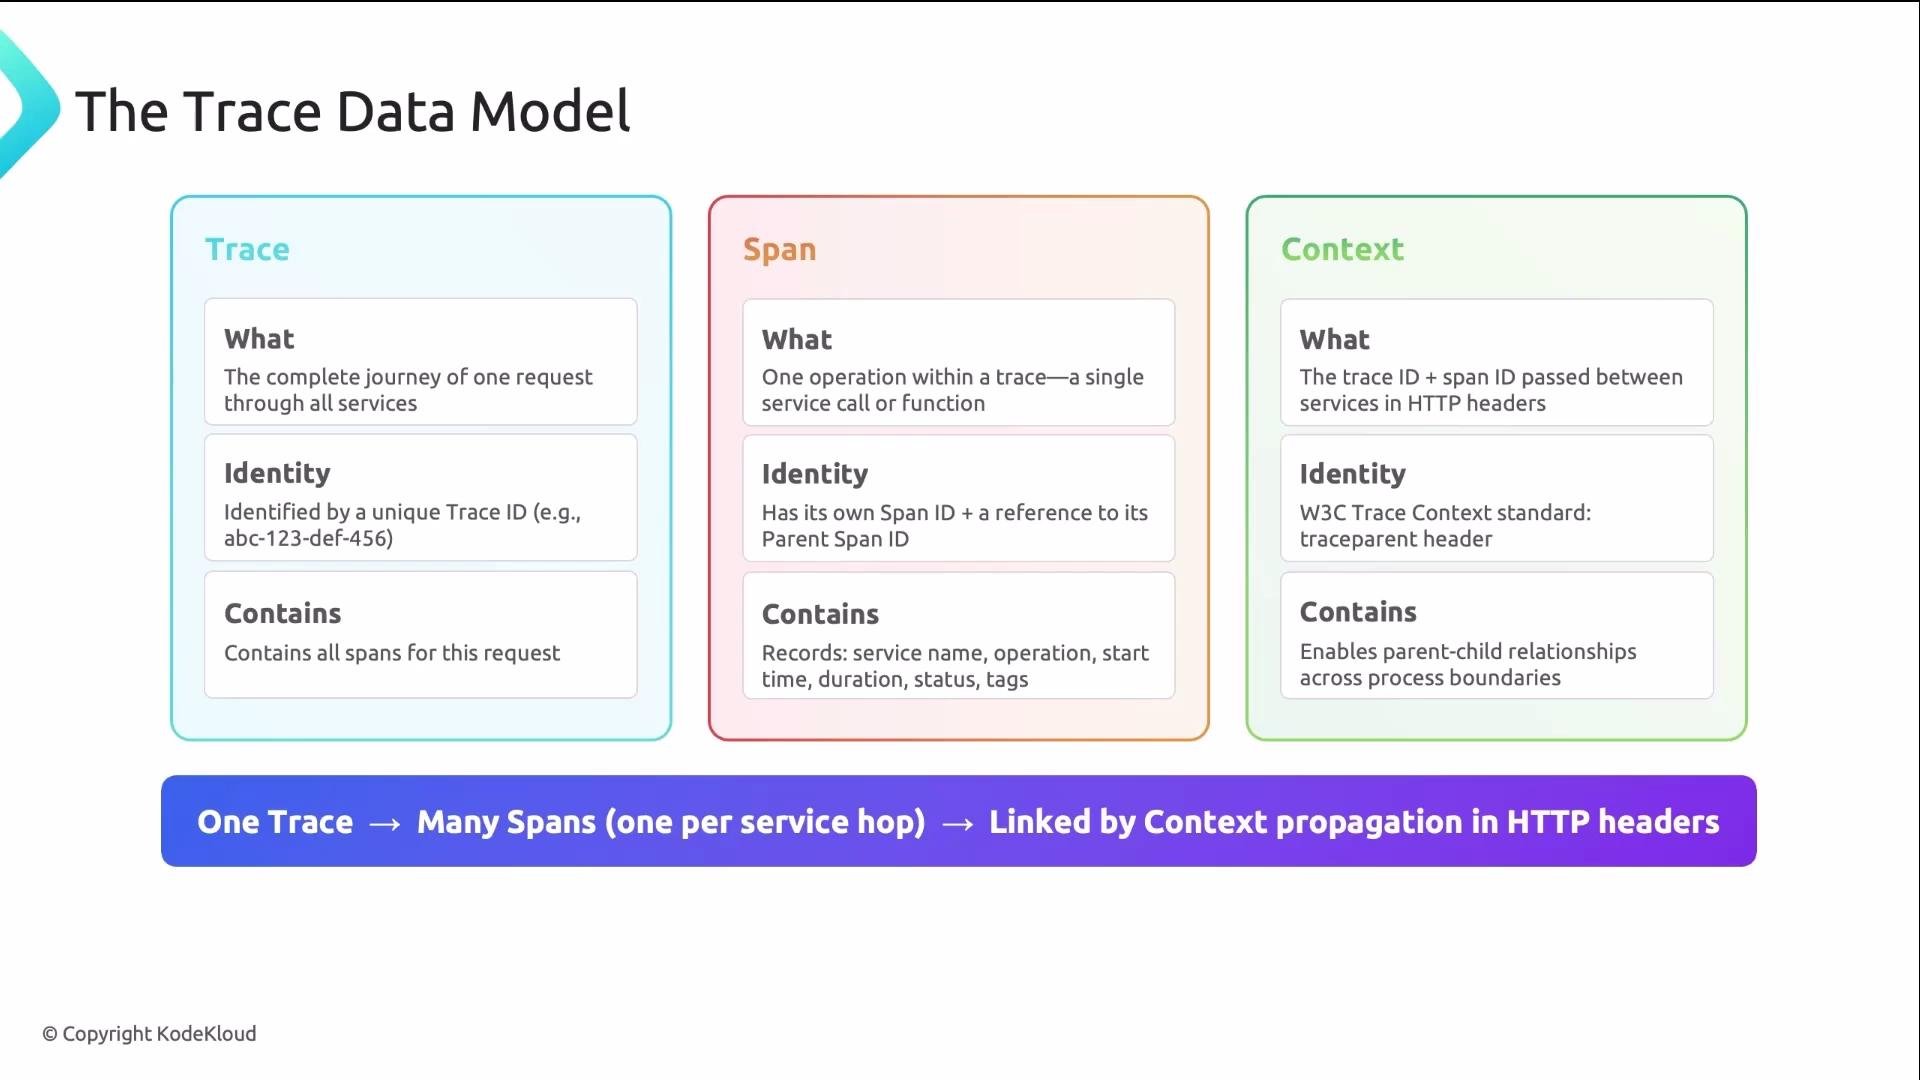
 Trace building blocks
| Component | Purpose | Key fields / examples |
| ------------------------- | ----------------------------------------------------------------------- | ----------------------------------------------------------------------- |
| Trace | The full journey for one request across multiple services | `trace_id` (unique identifier for the trace) |
| Span | One unit of work within a trace (HTTP call, DB query, etc.) | `span_id`, start time, duration, attributes/tags, events (logs), status |
| Parent-child relationship | Spans form a tree. A parent span may have many child spans | Parent span links to child span IDs |
| Context propagation | Moves trace context (trace ID + span context) across process boundaries | Typically via HTTP headers (e.g., `traceparent`) |
Trace building blocks
| Component | Purpose | Key fields / examples |
| ------------------------- | ----------------------------------------------------------------------- | ----------------------------------------------------------------------- |
| Trace | The full journey for one request across multiple services | `trace_id` (unique identifier for the trace) |
| Span | One unit of work within a trace (HTTP call, DB query, etc.) | `span_id`, start time, duration, attributes/tags, events (logs), status |
| Parent-child relationship | Spans form a tree. A parent span may have many child spans | Parent span links to child span IDs |
| Context propagation | Moves trace context (trace ID + span context) across process boundaries | Typically via HTTP headers (e.g., `traceparent`) |
 OpenTelemetry (OTEL) — standardized instrumentation
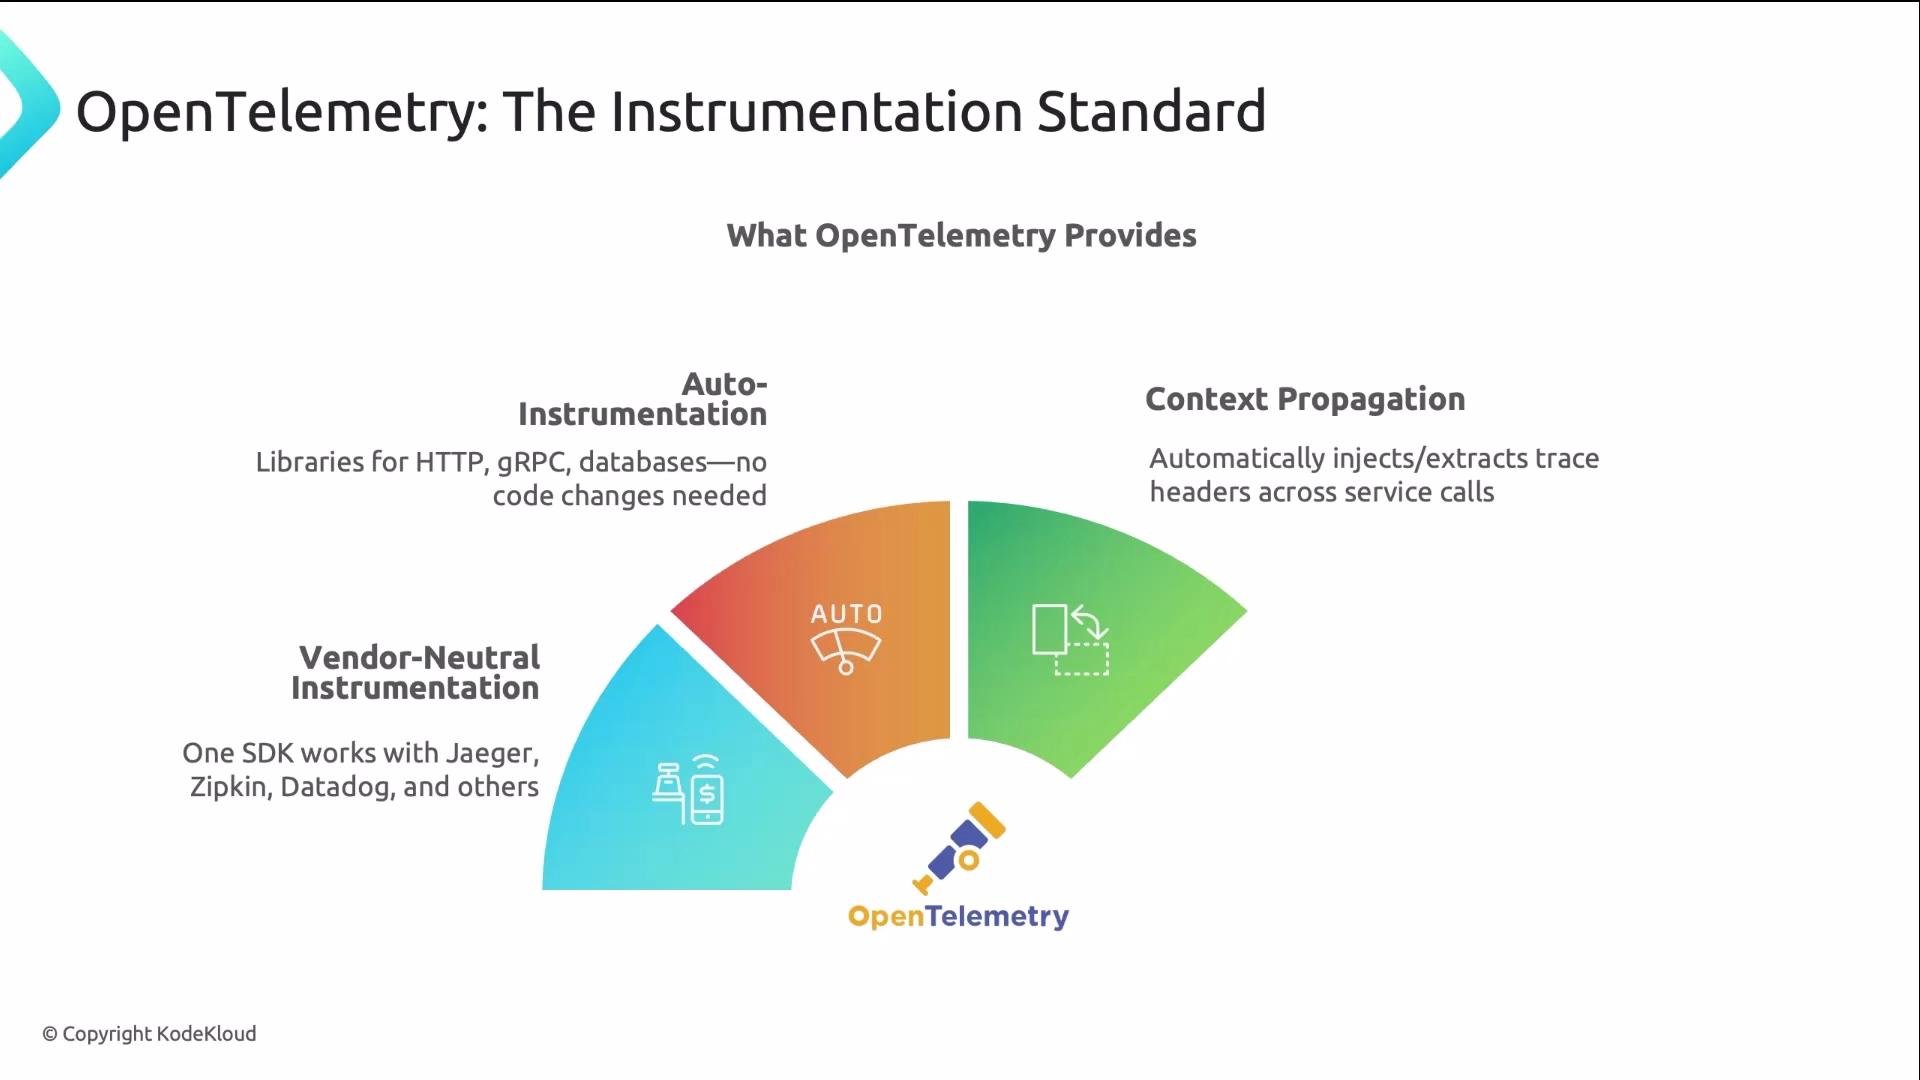
OpenTelemetry is the CNCF standard for instrumentation and context propagation. It is vendor-neutral: instrument once and export to multiple backends. OTEL supports:
* Auto-instrumentation for HTTP, gRPC, common database clients
* Automatic injection/extraction of trace context on outgoing/incoming requests
* OTLP (OpenTelemetry Protocol) as the common export format for traces and metrics
OpenTelemetry (OTEL) — standardized instrumentation
OpenTelemetry is the CNCF standard for instrumentation and context propagation. It is vendor-neutral: instrument once and export to multiple backends. OTEL supports:
* Auto-instrumentation for HTTP, gRPC, common database clients
* Automatic injection/extraction of trace context on outgoing/incoming requests
* OTLP (OpenTelemetry Protocol) as the common export format for traces and metrics
 Configuring OpenTelemetry with environment variables
You typically configure the OTEL SDK via environment variables to identify your service and tell the SDK where to export traces. Common settings:
```bash theme={null}
# Service identification
OTEL_SERVICE_NAME=order-service
# Exporter endpoint (Jaeger collector or OTLP receiver)
OTEL_EXPORTER_OTLP_ENDPOINT=http://jaeger-collector:4317
# Protocol for OTLP (grpc or http/protobuf)
OTEL_EXPORTER_OTLP_PROTOCOL=grpc
# Traces exporter (common values: otlp, jaeger, none)
OTEL_TRACES_EXPORTER=otlp
```
Note: gRPC OTLP often uses port `4317`; HTTP/protobuf OTLP often uses port `4318`. Ensure the protocol and endpoint match your collector.
OpenTelemetry SDKs and auto-instrumentation inject and extract trace context automatically. In most cases you only need to set environment variables and enable auto-instrumentation or initialize the SDK in your app.
Jaeger — collect and visualize traces
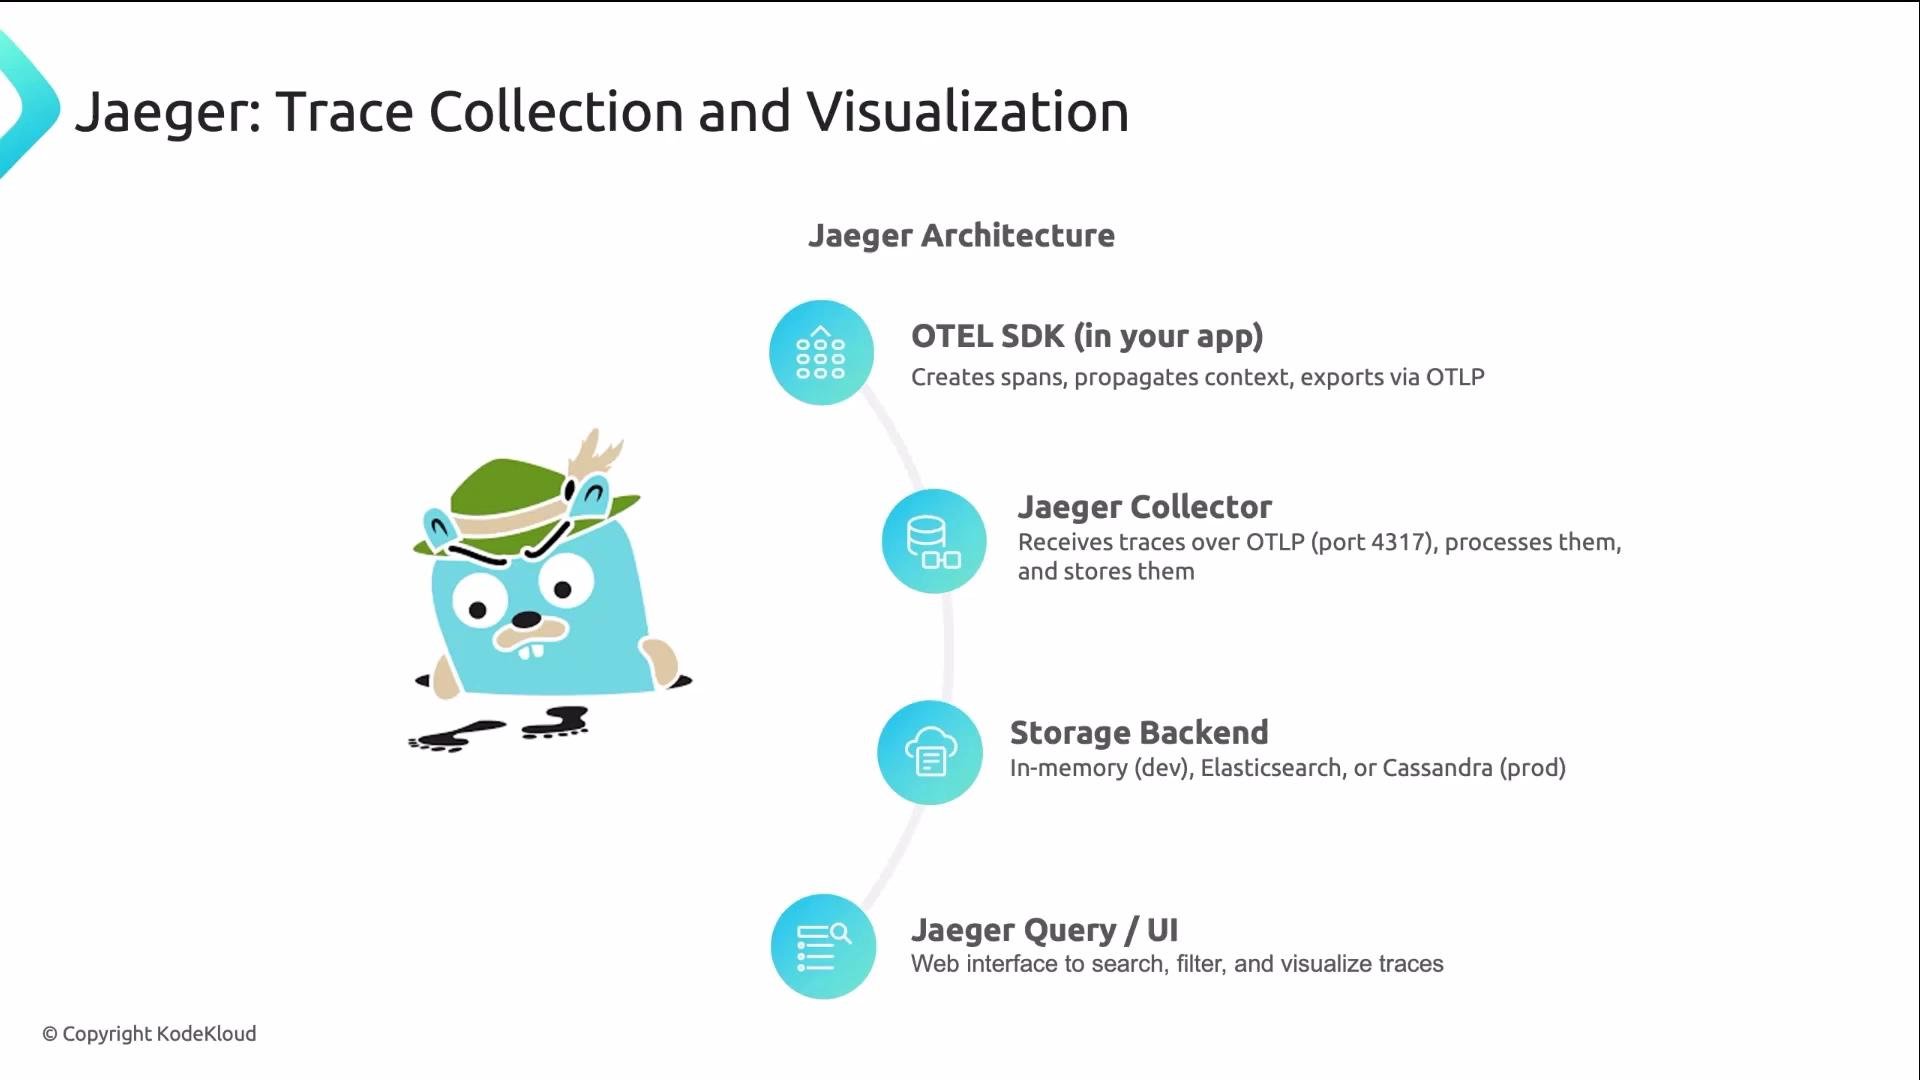
Jaeger collects, stores, and visualizes traces. Typical architecture:
* OTEL SDK in your application exports traces to the Jaeger collector (often via OTLP).
* The collector writes traces to a storage backend (Elasticsearch, Cassandra, etc.).
* The query service reads the stored traces and powers the Jaeger UI.
Configuring OpenTelemetry with environment variables
You typically configure the OTEL SDK via environment variables to identify your service and tell the SDK where to export traces. Common settings:
```bash theme={null}
# Service identification
OTEL_SERVICE_NAME=order-service
# Exporter endpoint (Jaeger collector or OTLP receiver)
OTEL_EXPORTER_OTLP_ENDPOINT=http://jaeger-collector:4317
# Protocol for OTLP (grpc or http/protobuf)
OTEL_EXPORTER_OTLP_PROTOCOL=grpc
# Traces exporter (common values: otlp, jaeger, none)
OTEL_TRACES_EXPORTER=otlp
```
Note: gRPC OTLP often uses port `4317`; HTTP/protobuf OTLP often uses port `4318`. Ensure the protocol and endpoint match your collector.
OpenTelemetry SDKs and auto-instrumentation inject and extract trace context automatically. In most cases you only need to set environment variables and enable auto-instrumentation or initialize the SDK in your app.
Jaeger — collect and visualize traces
Jaeger collects, stores, and visualizes traces. Typical architecture:
* OTEL SDK in your application exports traces to the Jaeger collector (often via OTLP).
* The collector writes traces to a storage backend (Elasticsearch, Cassandra, etc.).
* The query service reads the stored traces and powers the Jaeger UI.
 Using the Jaeger UI
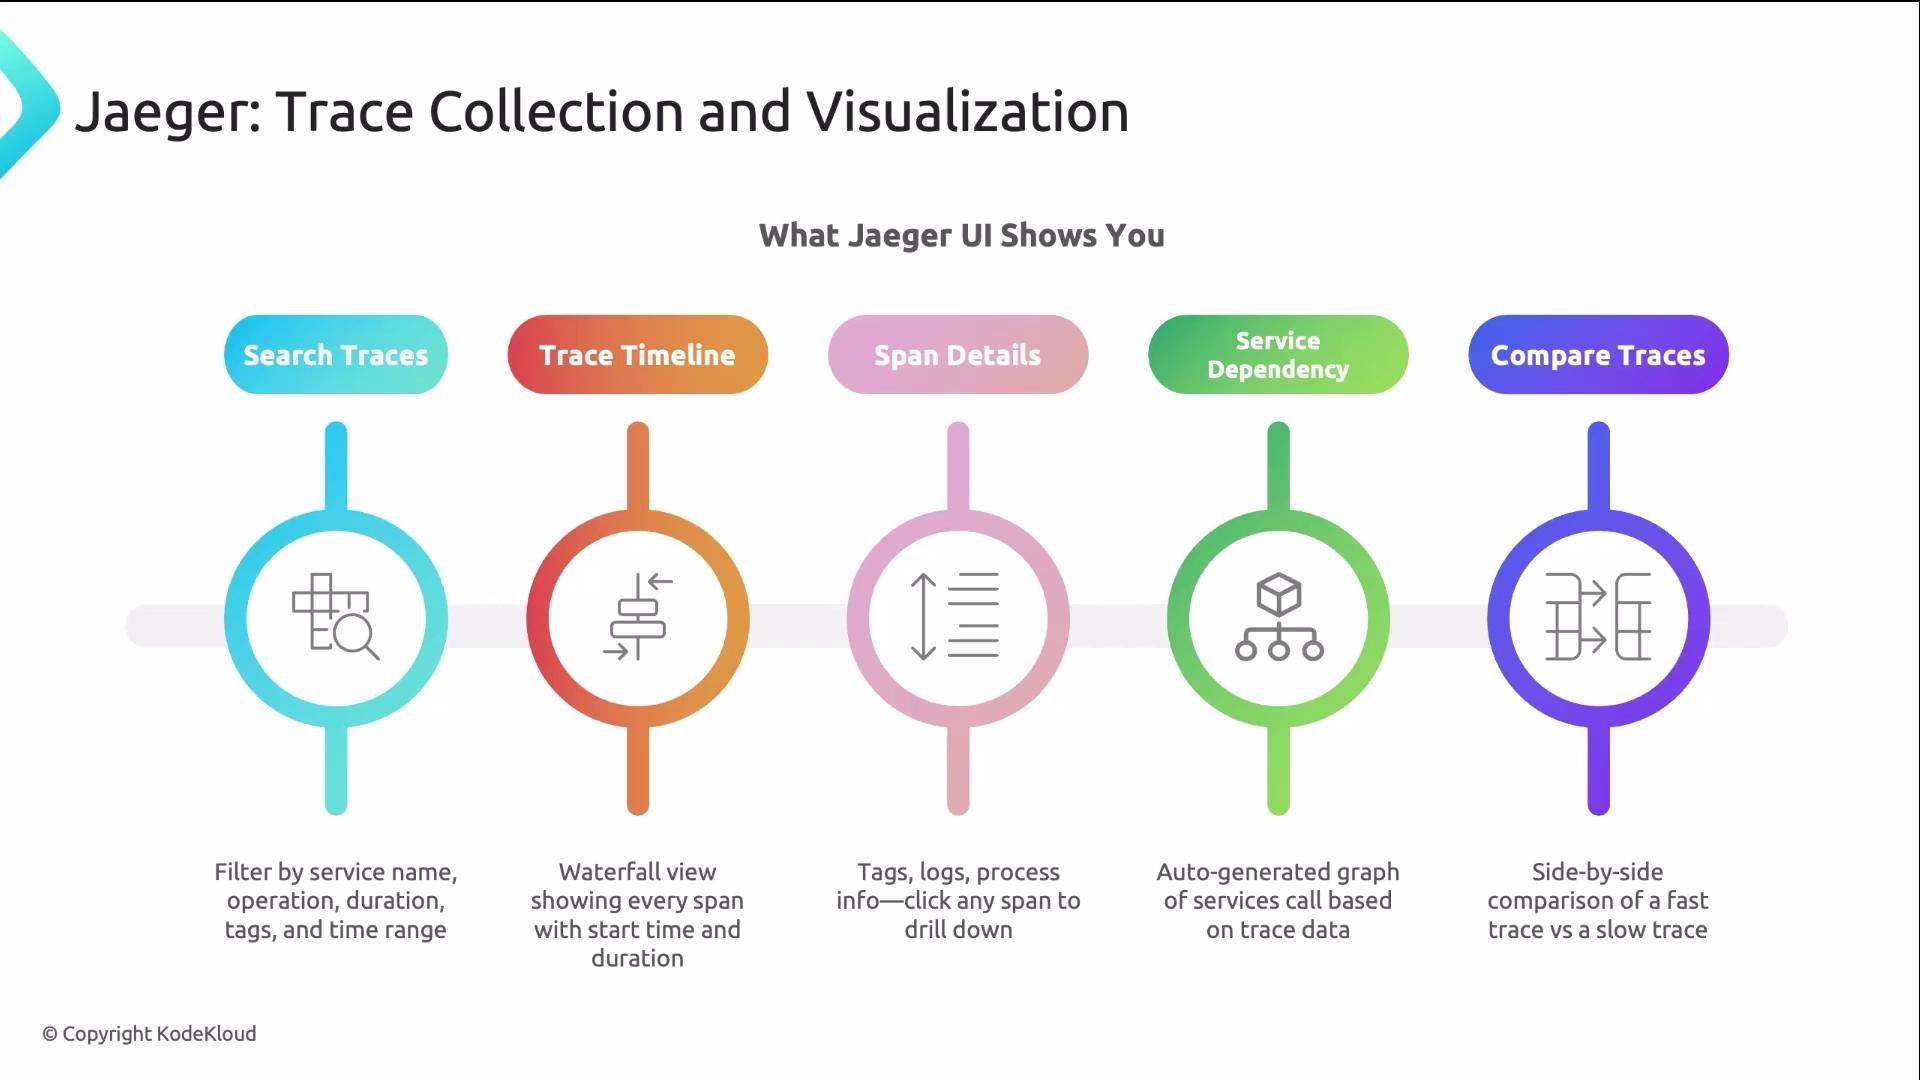
* Search traces by service name, operation, minimum duration, or tags.
* The waterfall/timeline view shows spans as horizontal bars whose widths represent duration. The widest bar is often the bottleneck.
* Click a span to view tags, logs/events, and process information.
* The service dependency graph is built from real trace data and shows call relationships between services.
Using the Jaeger UI
* Search traces by service name, operation, minimum duration, or tags.
* The waterfall/timeline view shows spans as horizontal bars whose widths represent duration. The widest bar is often the bottleneck.
* Click a span to view tags, logs/events, and process information.
* The service dependency graph is built from real trace data and shows call relationships between services.
 Context propagation: an example flow
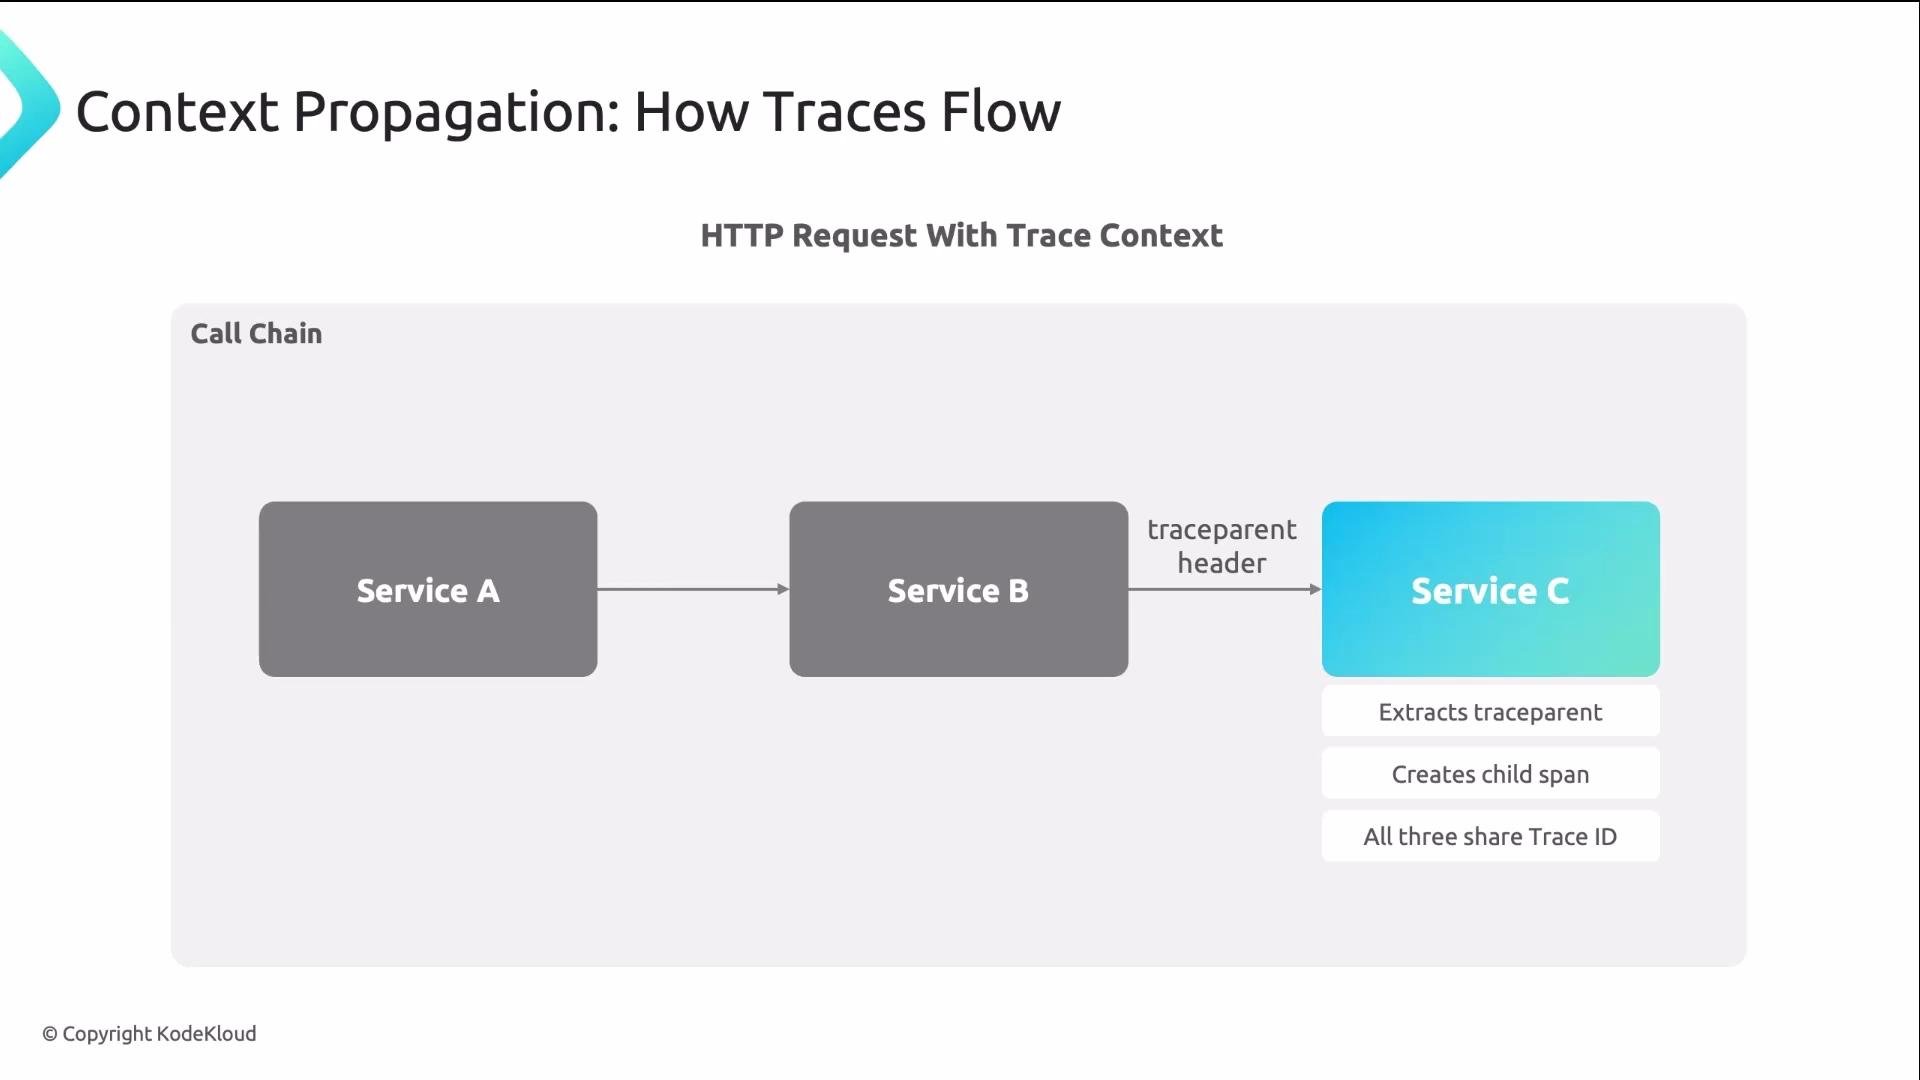
1. Service A receives an incoming request and creates the root span (and a trace ID).
2. When Service A calls Service B, it injects a trace context header into the outgoing HTTP request.
3. Service B extracts the header, creates a child span (same trace ID, new span ID), and continues the chain when calling Service C.
4. All services share the single trace ID, allowing Jaeger to reconstruct the complete end-to-end journey.
Context propagation: an example flow
1. Service A receives an incoming request and creates the root span (and a trace ID).
2. When Service A calls Service B, it injects a trace context header into the outgoing HTTP request.
3. Service B extracts the header, creates a child span (same trace ID, new span ID), and continues the chain when calling Service C.
4. All services share the single trace ID, allowing Jaeger to reconstruct the complete end-to-end journey.
 W3C trace context: the `traceparent` header
The W3C `traceparent` header is a standard way to carry trace context across process boundaries. It has four hyphen-separated fields:
* Version (currently `00`)
* Trace ID (32 hex characters) — identifies the entire trace
* Span ID (16 hex characters) — identifies the specific span
* Trace flags (e.g., `01` indicates the trace is sampled)
Example header:
```http theme={null}
traceparent: 00-4bf92f3577b34da6a3ce929d0e0e4736-00f067aa0ba902b7-01
```
In practice you rarely need to parse or create this header manually — OpenTelemetry injects and extracts it automatically.
Reference: W3C Trace Context — [https://www.w3.org/TR/trace-context/](https://www.w3.org/TR/trace-context/)
W3C trace context: the `traceparent` header
The W3C `traceparent` header is a standard way to carry trace context across process boundaries. It has four hyphen-separated fields:
* Version (currently `00`)
* Trace ID (32 hex characters) — identifies the entire trace
* Span ID (16 hex characters) — identifies the specific span
* Trace flags (e.g., `01` indicates the trace is sampled)
Example header:
```http theme={null}
traceparent: 00-4bf92f3577b34da6a3ce929d0e0e4736-00f067aa0ba902b7-01
```
In practice you rarely need to parse or create this header manually — OpenTelemetry injects and extracts it automatically.
Reference: W3C Trace Context — [https://www.w3.org/TR/trace-context/](https://www.w3.org/TR/trace-context/)
 Quick checklist to get tracing working
| Step | Action |
| --------------- | ------------------------------------------------------------------------------------------------------------------------------------------------------------ |
| Instrumentation | Enable OpenTelemetry SDK or auto-instrumentation for your runtime (Java, Node, Python, Go, etc.). See [https://opentelemetry.io/](https://opentelemetry.io/) |
| Configure | Set `OTEL_SERVICE_NAME` and OTLP exporter variables (example above). |
| Collector | Deploy or point to a collector (Jaeger collector or OTLP receiver). |
| Storage & UI | Configure Jaeger (or another backend) for storage and enable the UI for trace analysis. |
| Verify | Generate traffic and search traces in Jaeger; inspect the waterfall view to find slow spans. |
Final summary
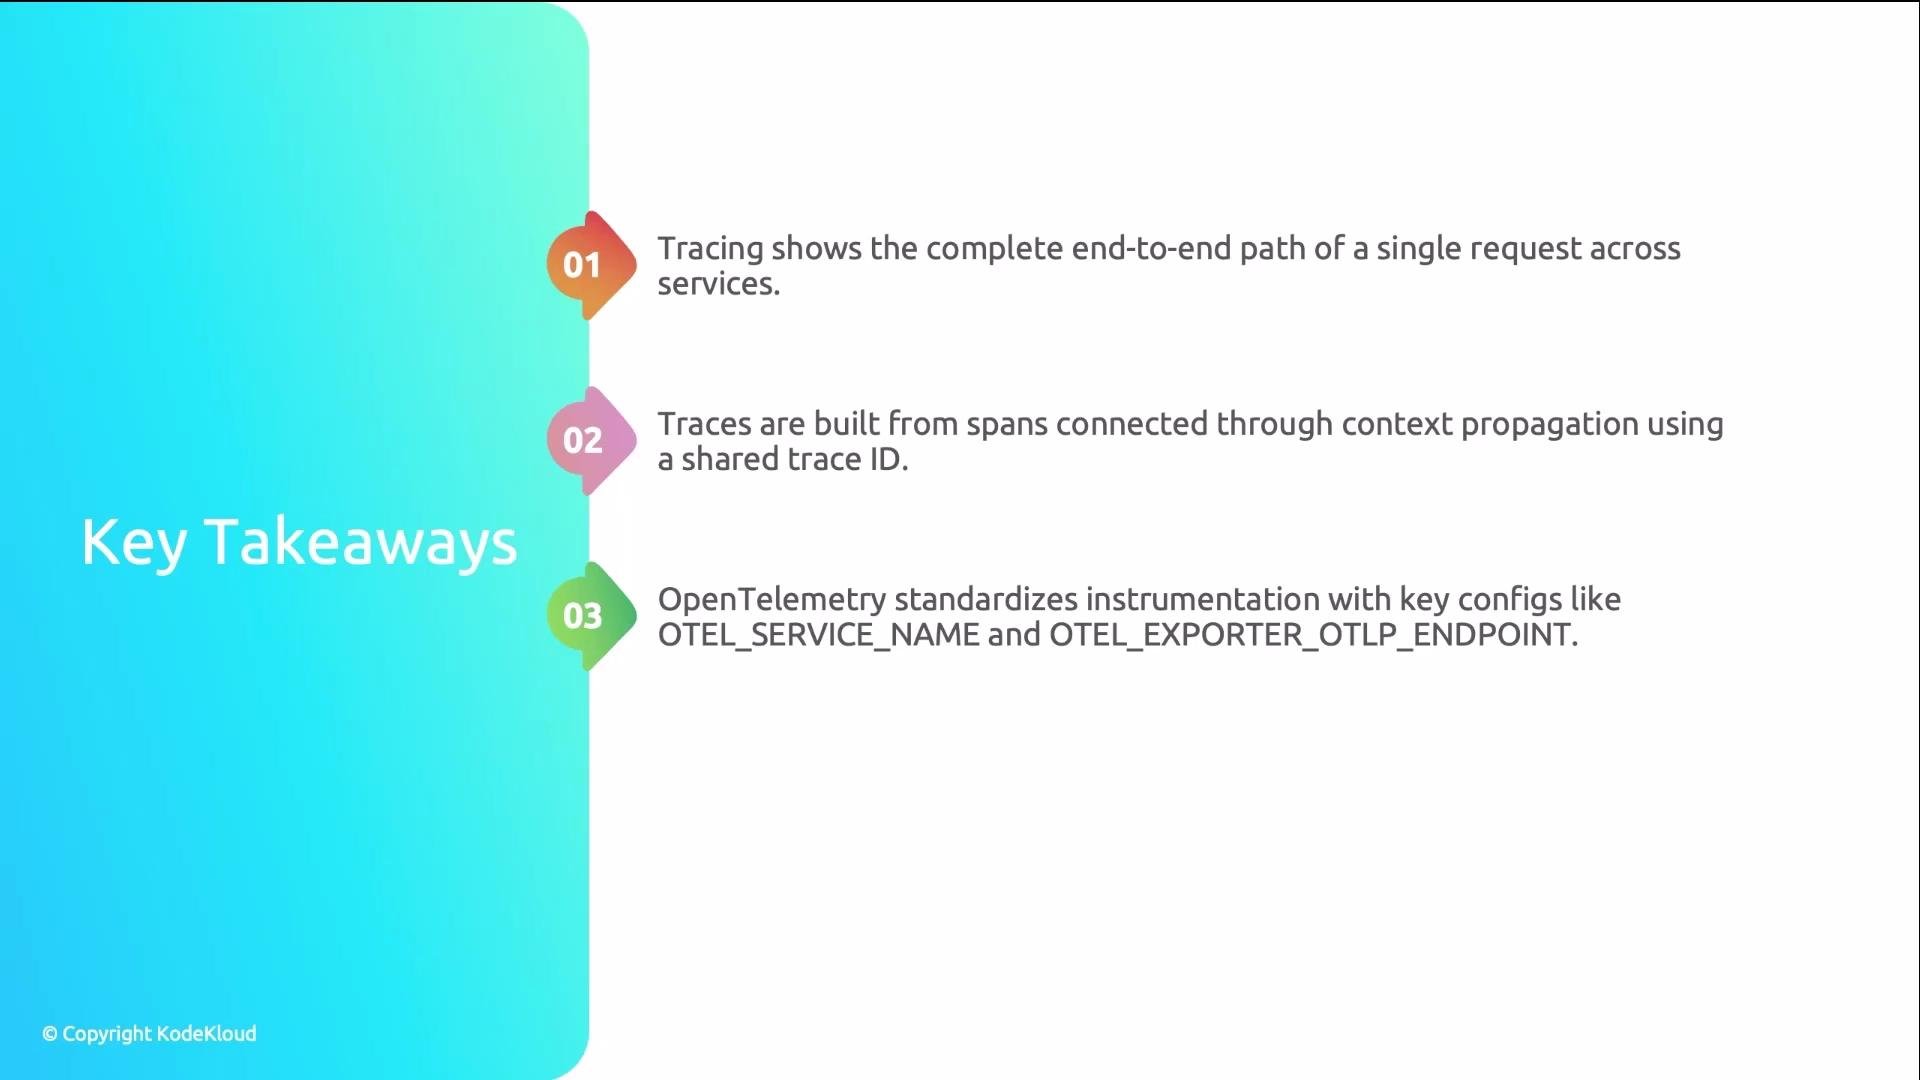
Tracing gives you end-to-end visibility that metrics and logs cannot provide alone. Traces are built from spans linked by a shared trace ID and joined together via context propagation (for example, the W3C `traceparent` header). Use OpenTelemetry for standardized instrumentation and OTLP export, and use Jaeger (or another backend) to collect, store, and analyze traces.
Useful references
* OpenTelemetry: [https://opentelemetry.io/](https://opentelemetry.io/)
* Jaeger: [https://www.jaegertracing.io/](https://www.jaegertracing.io/)
* W3C Trace Context: [https://www.w3.org/TR/trace-context/](https://www.w3.org/TR/trace-context/)
Quick checklist to get tracing working
| Step | Action |
| --------------- | ------------------------------------------------------------------------------------------------------------------------------------------------------------ |
| Instrumentation | Enable OpenTelemetry SDK or auto-instrumentation for your runtime (Java, Node, Python, Go, etc.). See [https://opentelemetry.io/](https://opentelemetry.io/) |
| Configure | Set `OTEL_SERVICE_NAME` and OTLP exporter variables (example above). |
| Collector | Deploy or point to a collector (Jaeger collector or OTLP receiver). |
| Storage & UI | Configure Jaeger (or another backend) for storage and enable the UI for trace analysis. |
| Verify | Generate traffic and search traces in Jaeger; inspect the waterfall view to find slow spans. |
Final summary
Tracing gives you end-to-end visibility that metrics and logs cannot provide alone. Traces are built from spans linked by a shared trace ID and joined together via context propagation (for example, the W3C `traceparent` header). Use OpenTelemetry for standardized instrumentation and OTLP export, and use Jaeger (or another backend) to collect, store, and analyze traces.
Useful references
* OpenTelemetry: [https://opentelemetry.io/](https://opentelemetry.io/)
* Jaeger: [https://www.jaegertracing.io/](https://www.jaegertracing.io/)
* W3C Trace Context: [https://www.w3.org/TR/trace-context/](https://www.w3.org/TR/trace-context/)