> ## Documentation Index
> Fetch the complete documentation index at: https://notes.kodekloud.com/llms.txt
> Use this file to discover all available pages before exploring further.
# Incident Playbook Triage Fix Validate Repeat
> A five-phase incident response playbook guiding teams from alert to validation using observability tools and safe reversible fixes to reduce mean time to recovery
This capstone ties together the observability and incident-response concepts covered earlier into a single, repeatable flow. Use this five-phase playbook to go from “something’s broken” to “it's fixed and confirmed” and to map each phase to the right tools and actions.
A logistics company had all the right tools — Prometheus, Grafana, Jaeger, Loki, and Alertmanager — but no playbook. At 2:00 a.m. their shipping API went down. The on-call engineer opened Grafana, saw red everywhere, panicked, and started restarting pods at random. Forty-five minutes later they discovered the root cause: an HPA had scaled the API to zero because a custom metric was broken.
After implementing a simple playbook, the next similar incident took four minutes instead of forty-five. The tools were the same; the outcome changed because they had a process.
Use this playbook for every incident, every time.
* Alert: Something triggered (Alertmanager, PagerDuty, Slack, or a custom report). It tells you which metric crossed a threshold and when.
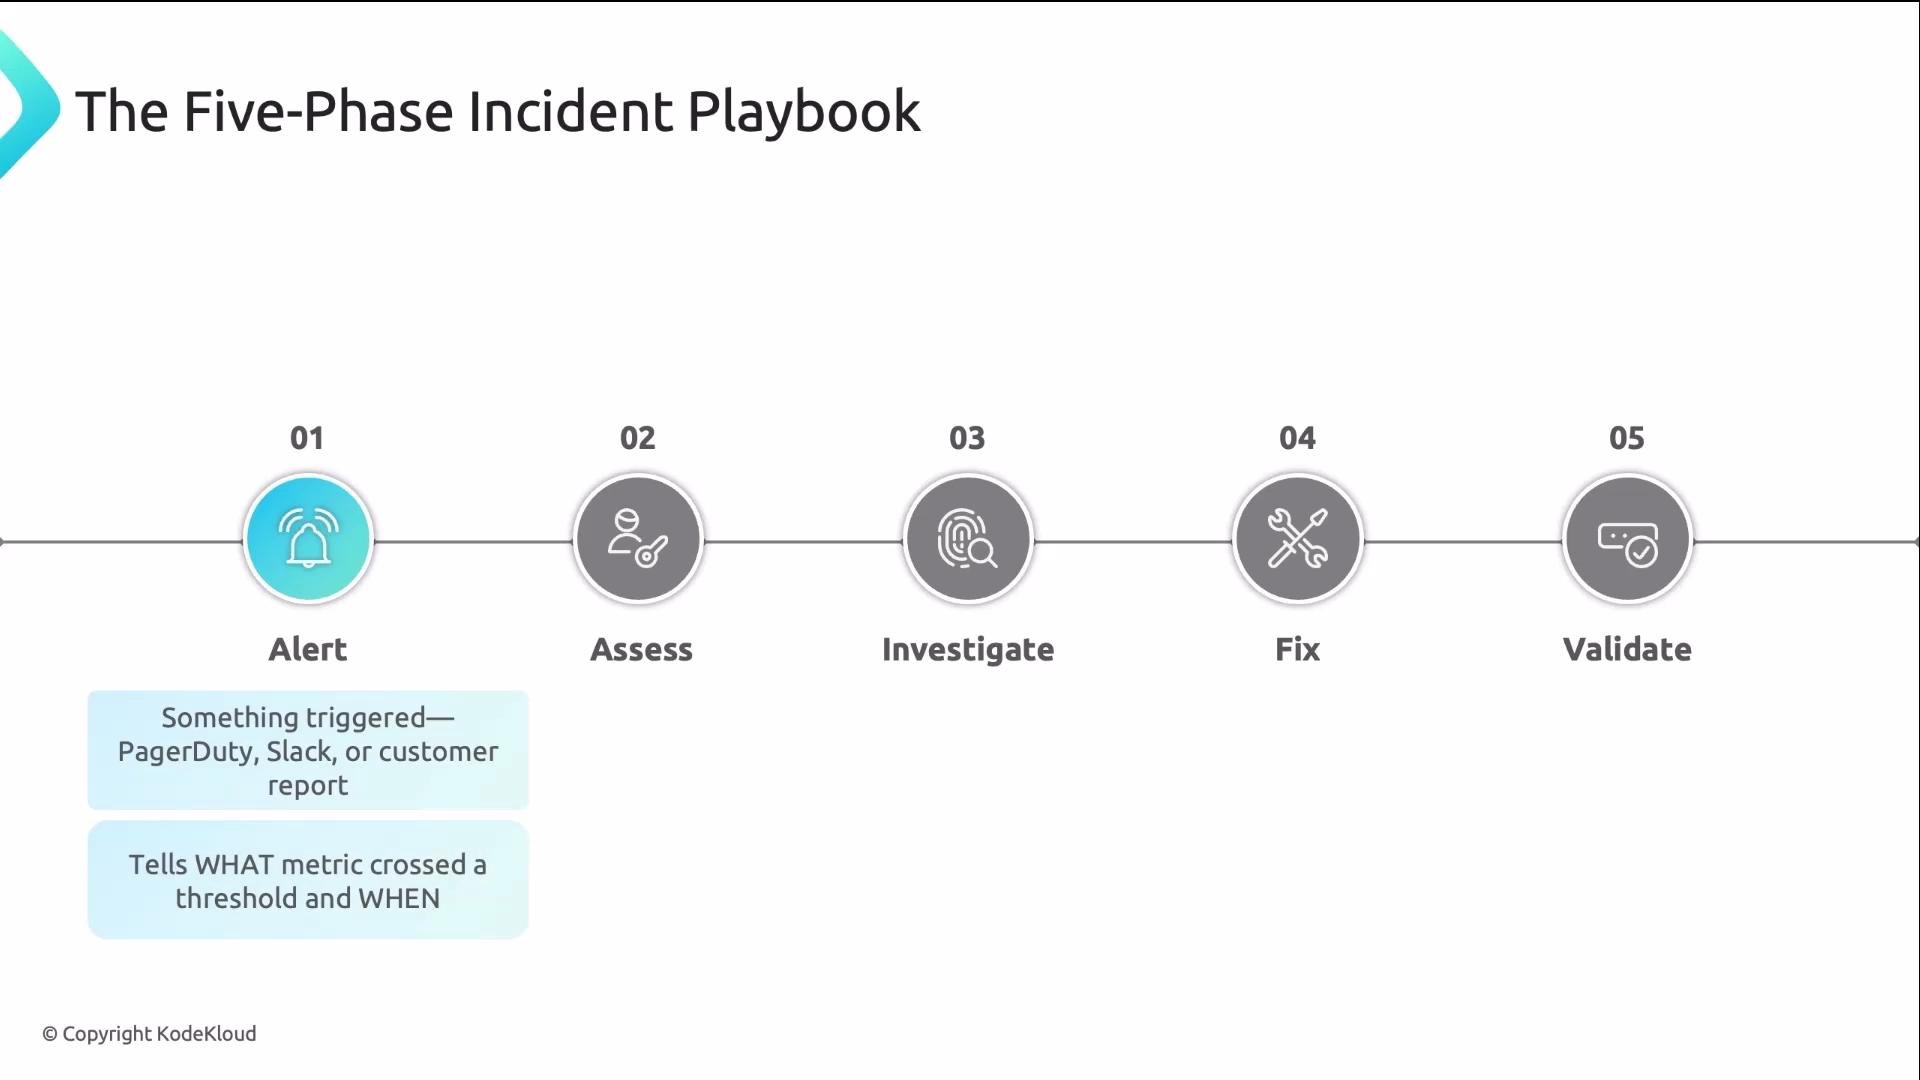 * Assess: Before you touch anything, spend a short, focused time (aim \~60 seconds) to understand the scope: how bad it is, who is affected, and whether it's partial or total.
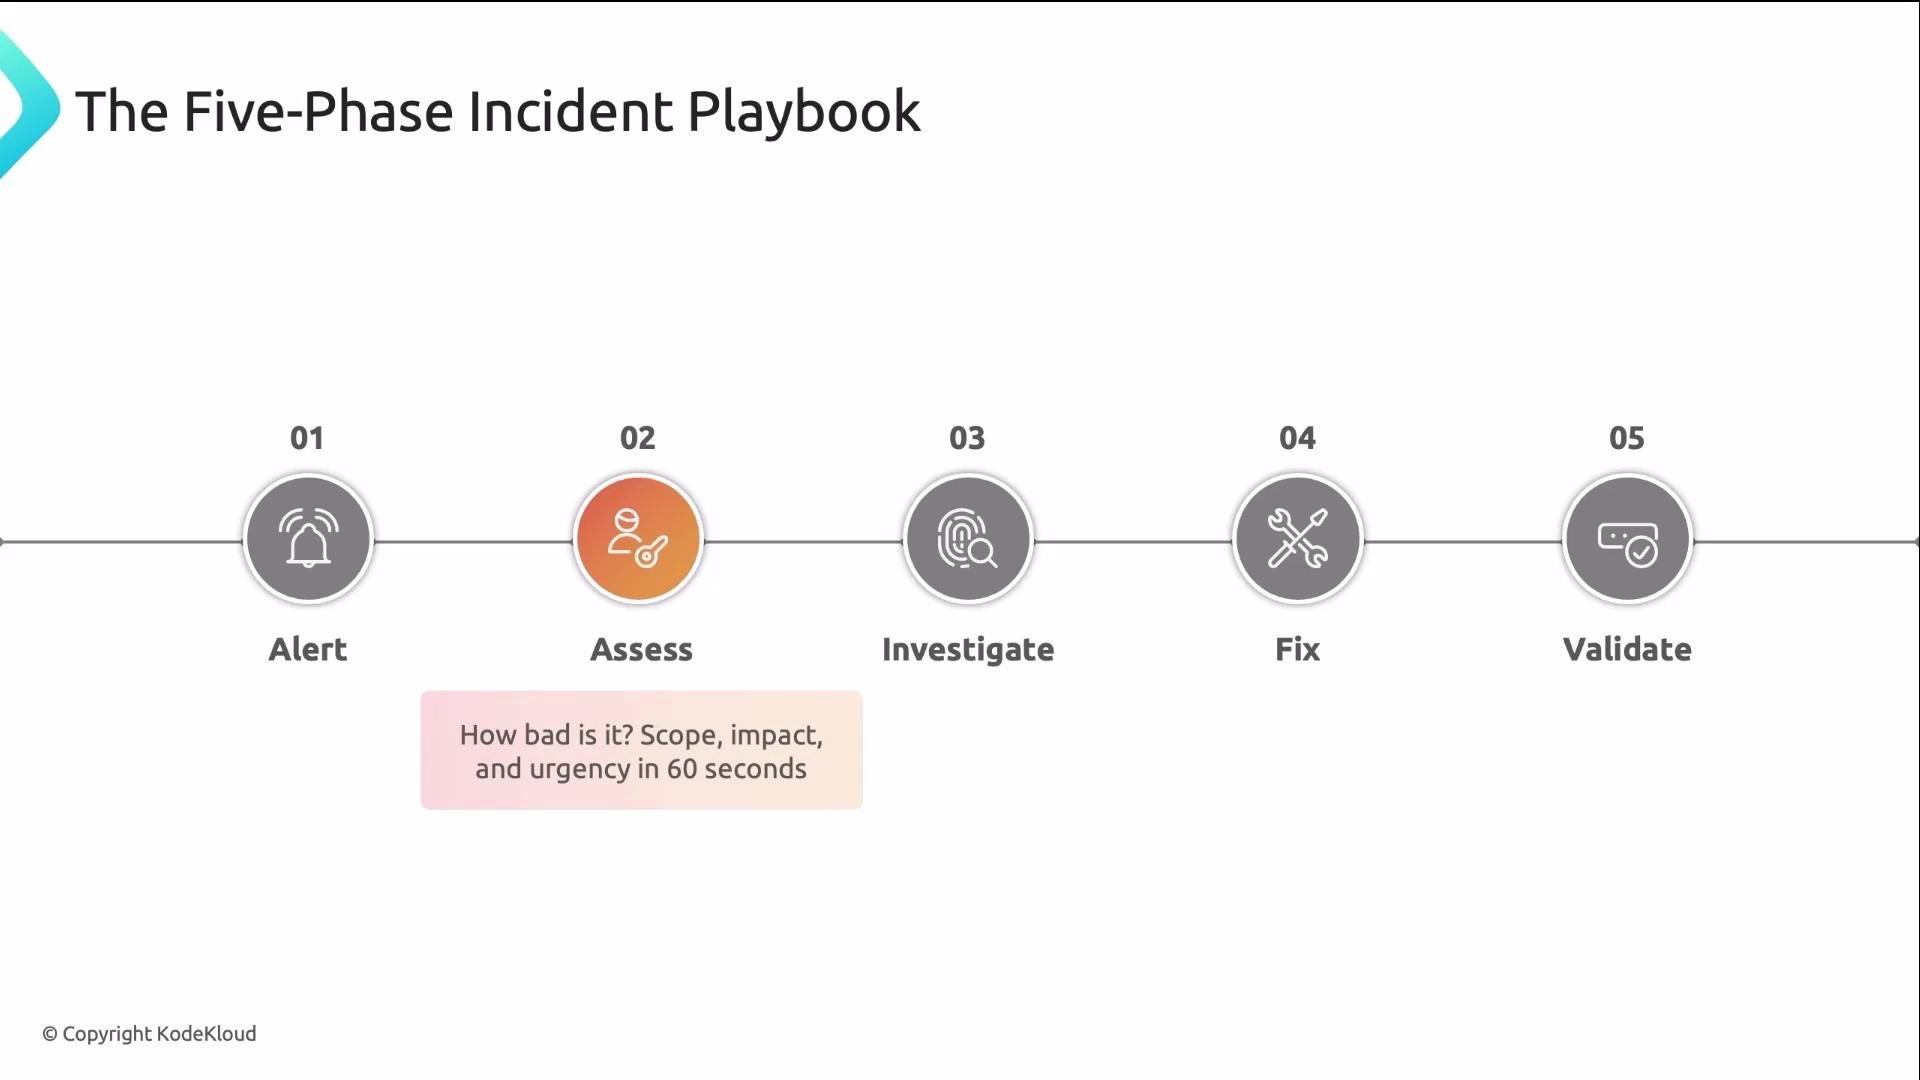 Spend a minute to assess before you act. Skipping assess is the most common cause of wasted time and harmful changes.
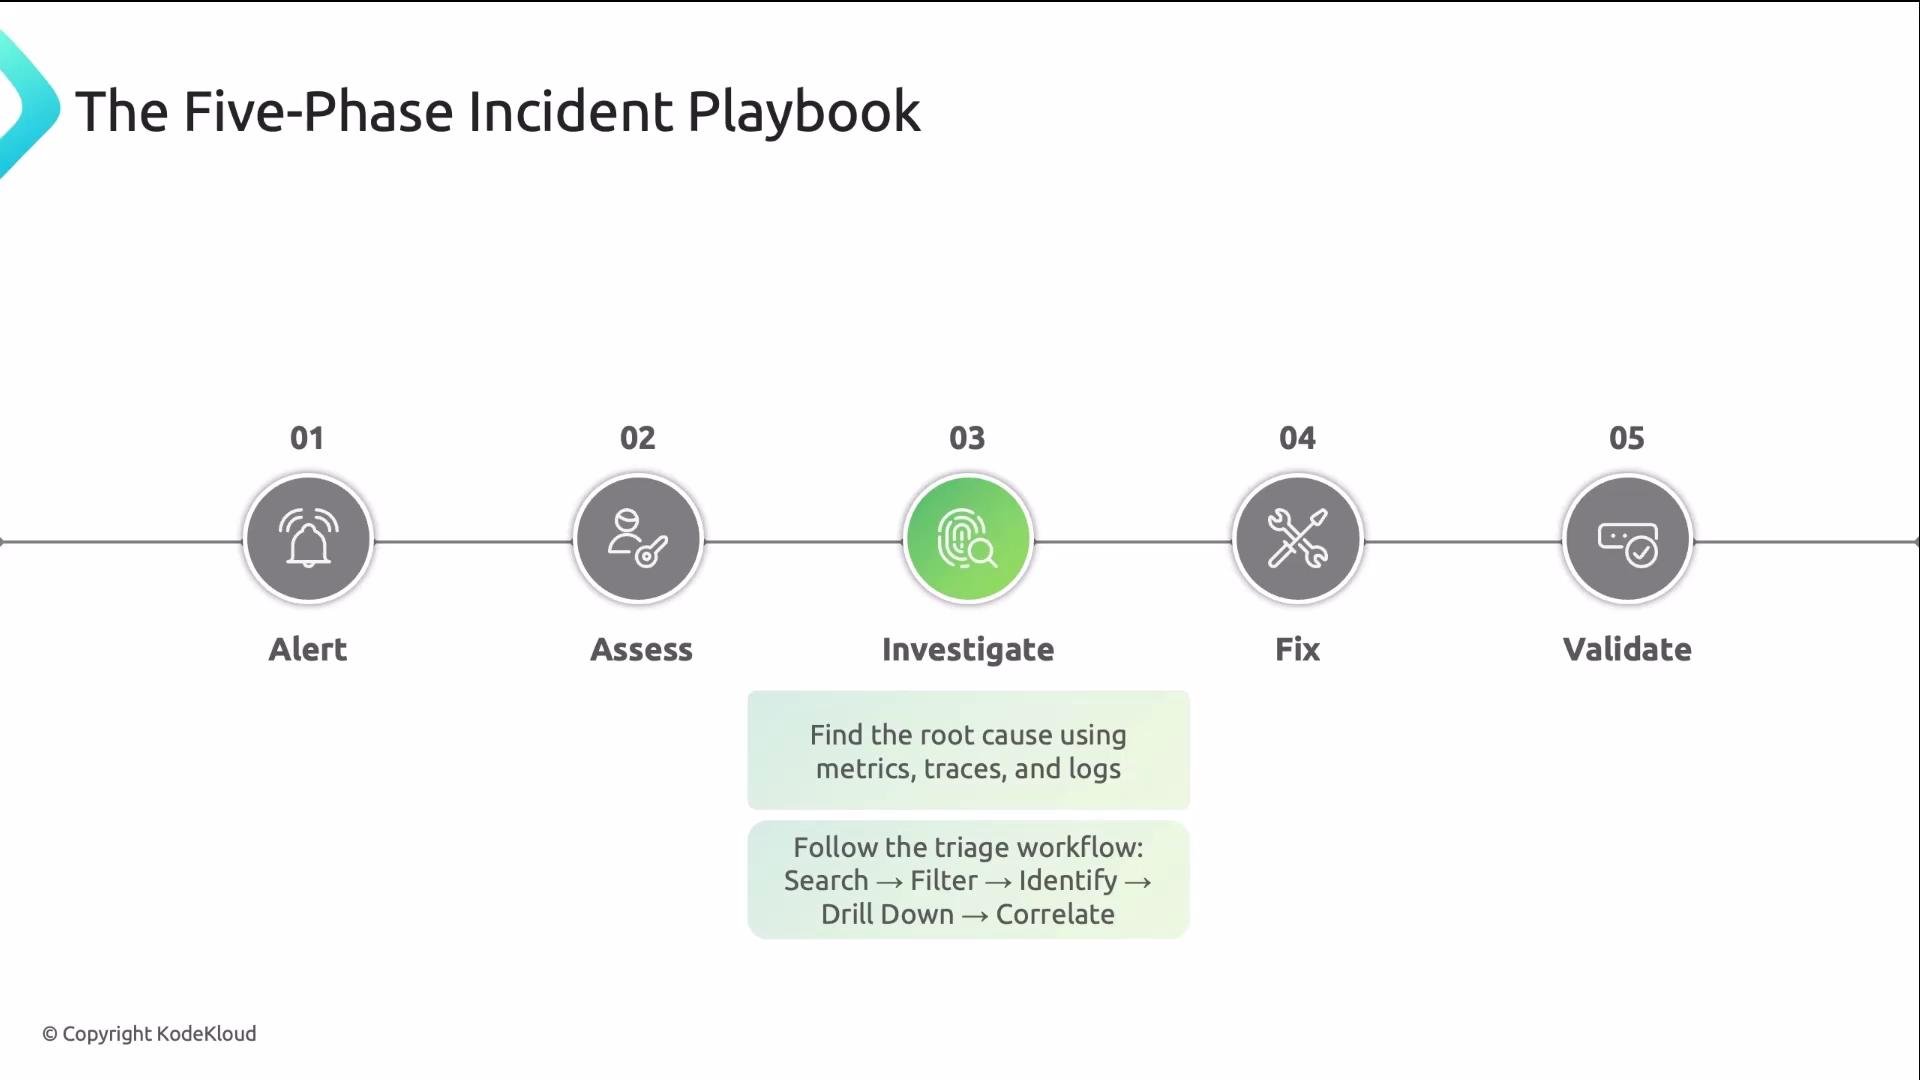
* Investigate: Dig into the root cause in a focused, methodical order: metrics first, then traces, then logs. Follow a triage workflow to narrow scope gradually.
Spend a minute to assess before you act. Skipping assess is the most common cause of wasted time and harmful changes.
* Investigate: Dig into the root cause in a focused, methodical order: metrics first, then traces, then logs. Follow a triage workflow to narrow scope gradually.
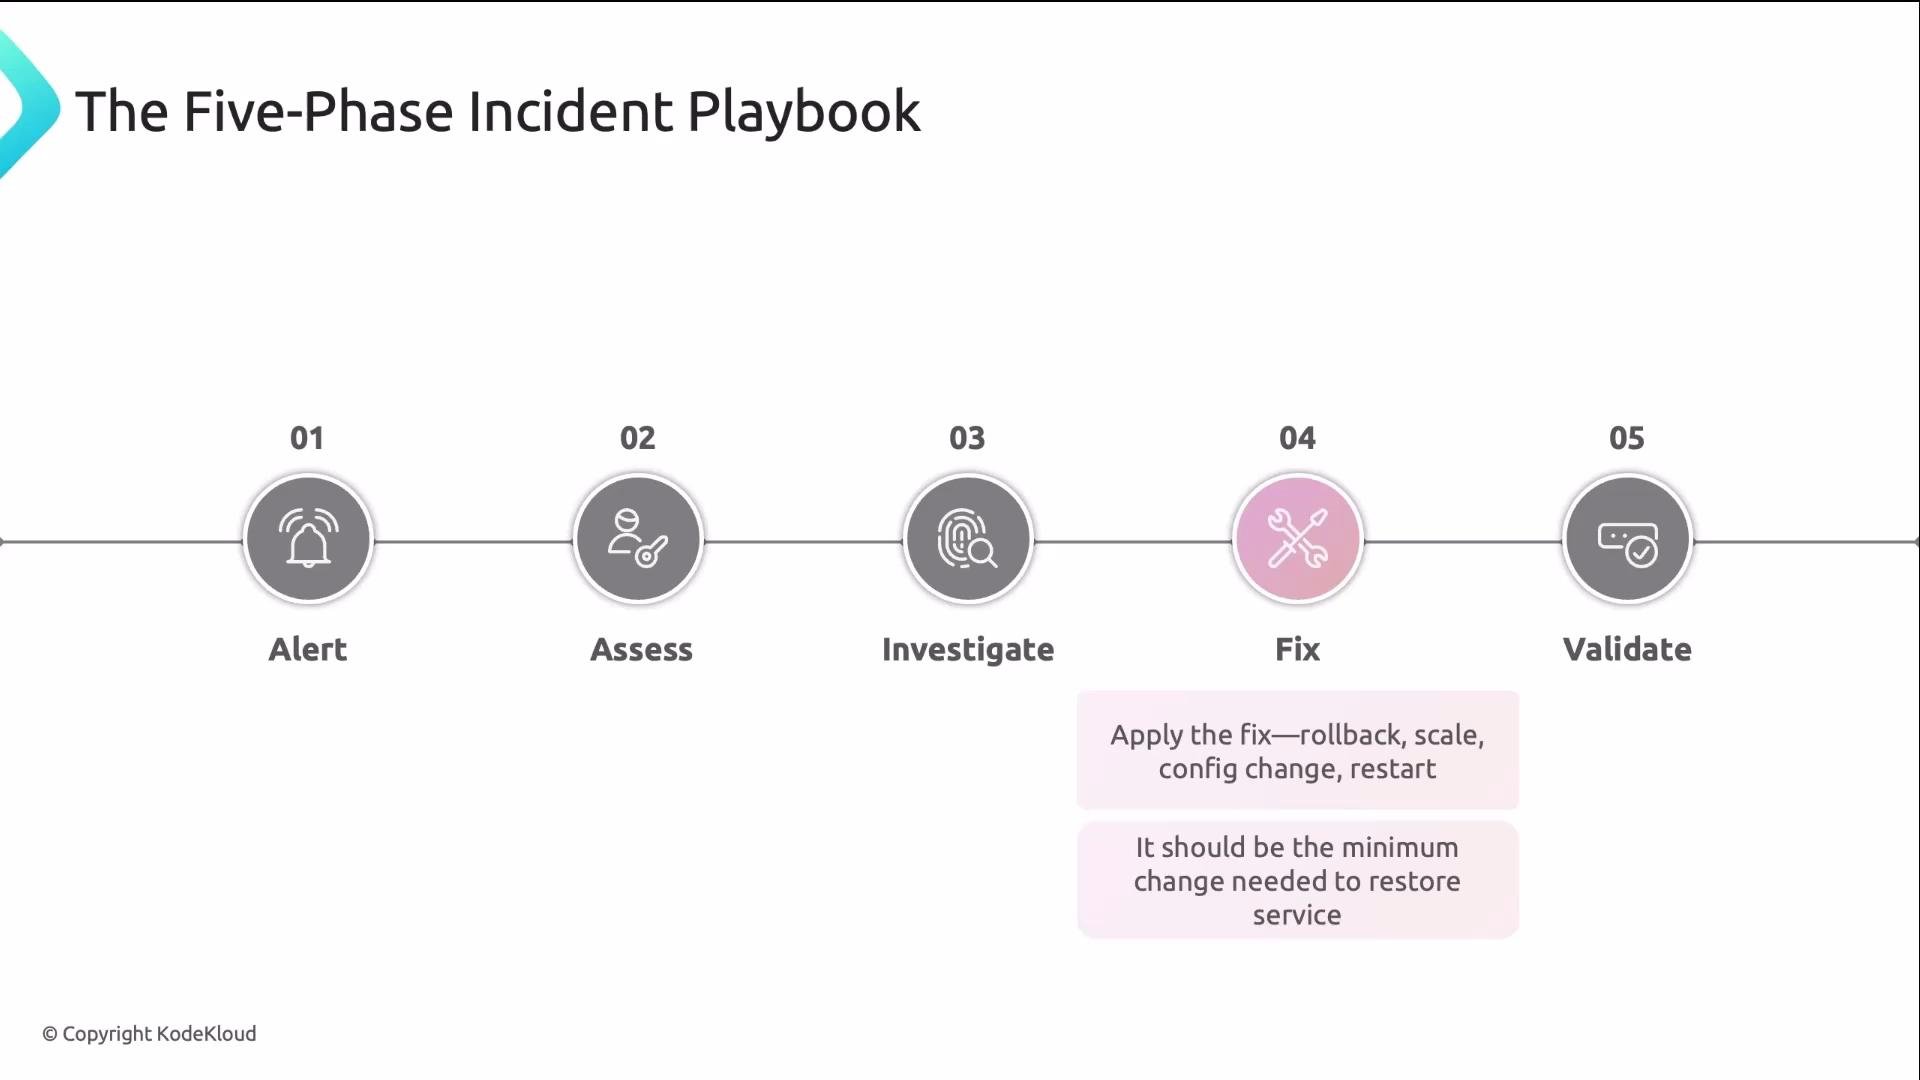
 * Fix: Apply the minimum-change necessary to restore service: rollback, scale up, adjust configuration, or restart. Prefer a reversible, conservative change that buys time to investigate further.
 * Validate: Don't close the incident until you confirm the fix worked. Watch dashboards and verify stability for a few minutes.
Tools map naturally to the phases:
* Alertmanager, PagerDuty, Slack — alerts and notification (Alert, Validate)
* Grafana — dashboards and runbooks (Assess, Validate)
* Prometheus — metrics and PromQL (Investigate)
* Jaeger — distributed traces (Investigate)
* Loki / kubectl logs — logs and pod-level details (Investigate)
* kubectl, GitOps, Helm — apply safe, reversible fixes (Fix)
Now let’s dig into each phase, starting with Assess — the step most engineers skip or rush.
Assess: four quick questions
* What’s broken? Read the alert and identify the affected service, endpoint, or pod.
* How bad is it? Is the outage partial (a single endpoint or region) or total?
* Who’s affected? One customer, a region, or everyone?
* What changed recently? A deployment or config change within the alert window is a prime suspect.
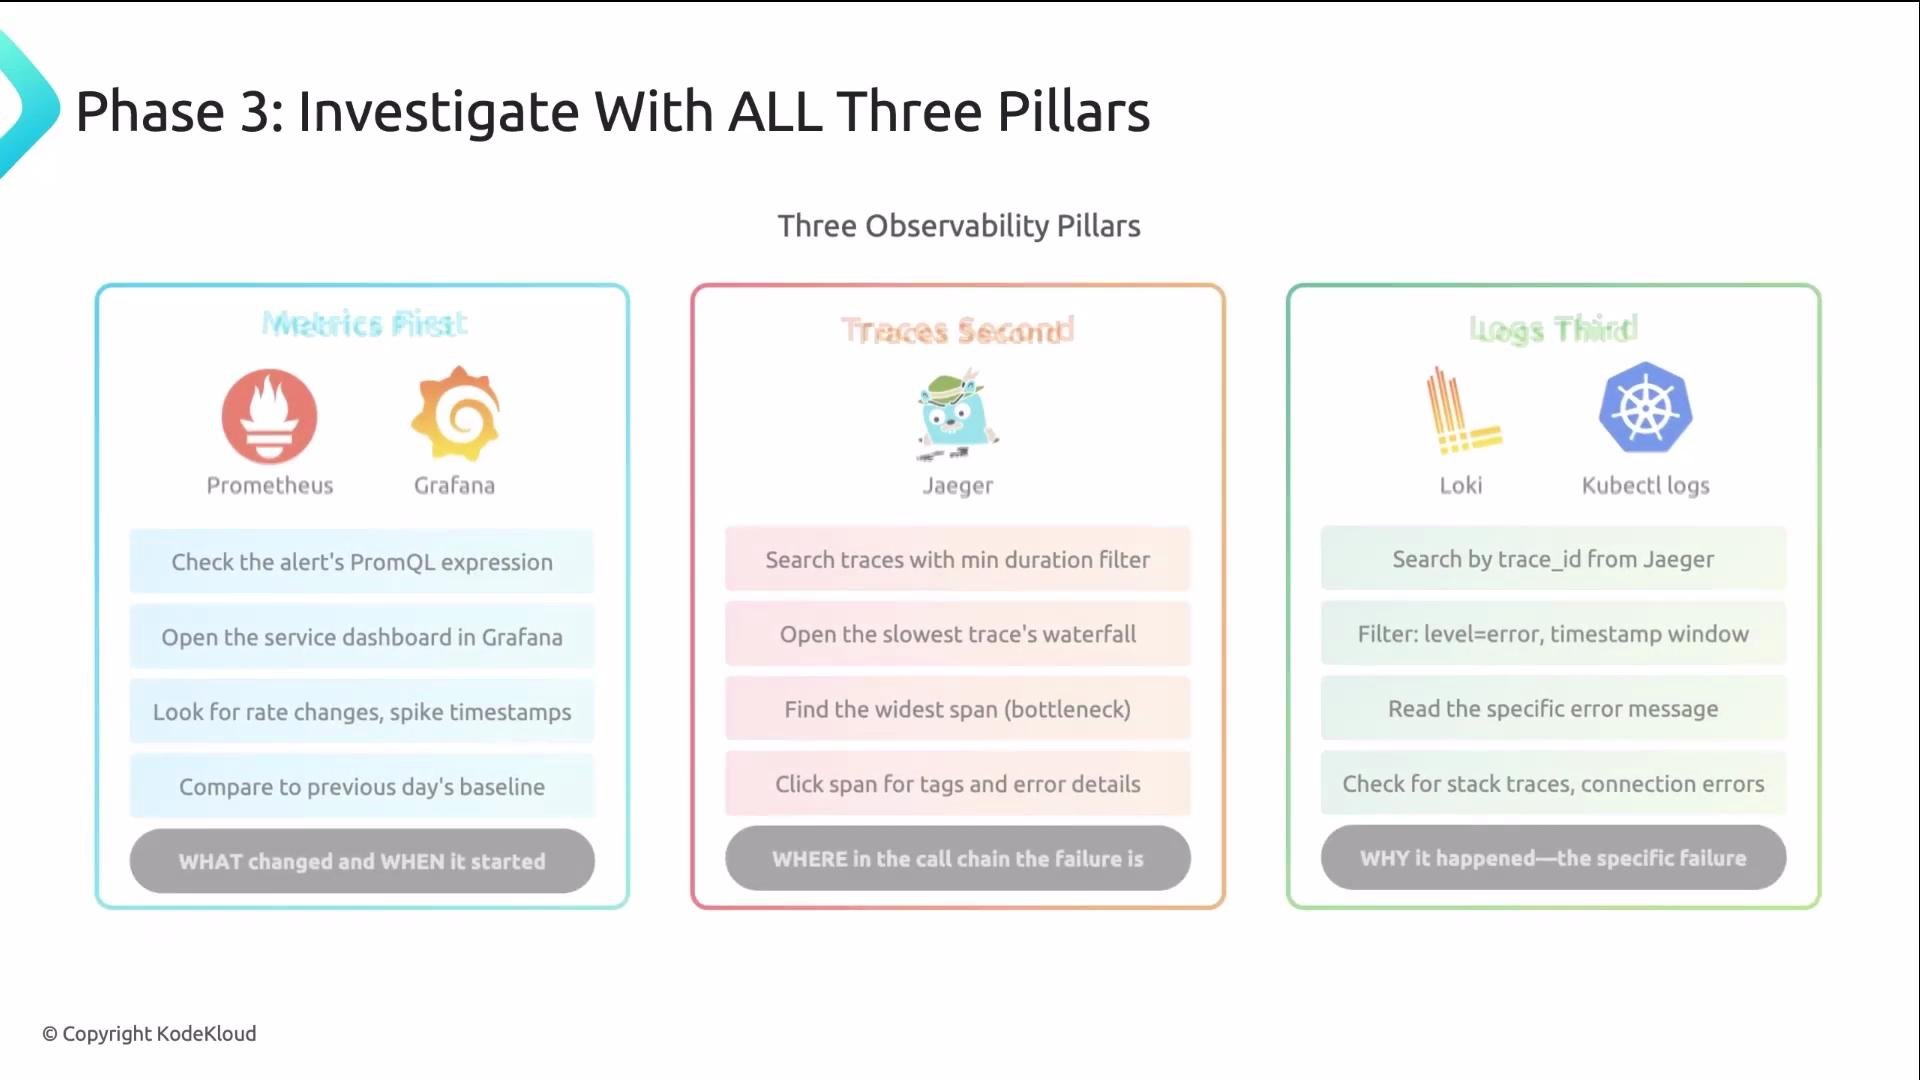
Investigation: use the observability funnel (metrics → traces → logs)
* Metrics first: Inspect the alert’s PromQL expression and open Grafana. Confirm the alert timestamps, pattern (sudden vs gradual), and compare to baseline (same time yesterday, same weekday).
* Traces next: Search Jaeger for slow or error traces. Use minimal-duration filters, inspect the waterfall, and find the longest-duration span or failing service.
* Logs last: Query logs by service and timestamp, or by trace ID to pinpoint the exact error message.
Each pillar narrows the search: metrics detect and scope, traces locate the problematic service or interaction, and logs explain the root cause.
* Validate: Don't close the incident until you confirm the fix worked. Watch dashboards and verify stability for a few minutes.
Tools map naturally to the phases:
* Alertmanager, PagerDuty, Slack — alerts and notification (Alert, Validate)
* Grafana — dashboards and runbooks (Assess, Validate)
* Prometheus — metrics and PromQL (Investigate)
* Jaeger — distributed traces (Investigate)
* Loki / kubectl logs — logs and pod-level details (Investigate)
* kubectl, GitOps, Helm — apply safe, reversible fixes (Fix)
Now let’s dig into each phase, starting with Assess — the step most engineers skip or rush.
Assess: four quick questions
* What’s broken? Read the alert and identify the affected service, endpoint, or pod.
* How bad is it? Is the outage partial (a single endpoint or region) or total?
* Who’s affected? One customer, a region, or everyone?
* What changed recently? A deployment or config change within the alert window is a prime suspect.
Investigation: use the observability funnel (metrics → traces → logs)
* Metrics first: Inspect the alert’s PromQL expression and open Grafana. Confirm the alert timestamps, pattern (sudden vs gradual), and compare to baseline (same time yesterday, same weekday).
* Traces next: Search Jaeger for slow or error traces. Use minimal-duration filters, inspect the waterfall, and find the longest-duration span or failing service.
* Logs last: Query logs by service and timestamp, or by trace ID to pinpoint the exact error message.
Each pillar narrows the search: metrics detect and scope, traces locate the problematic service or interaction, and logs explain the root cause.
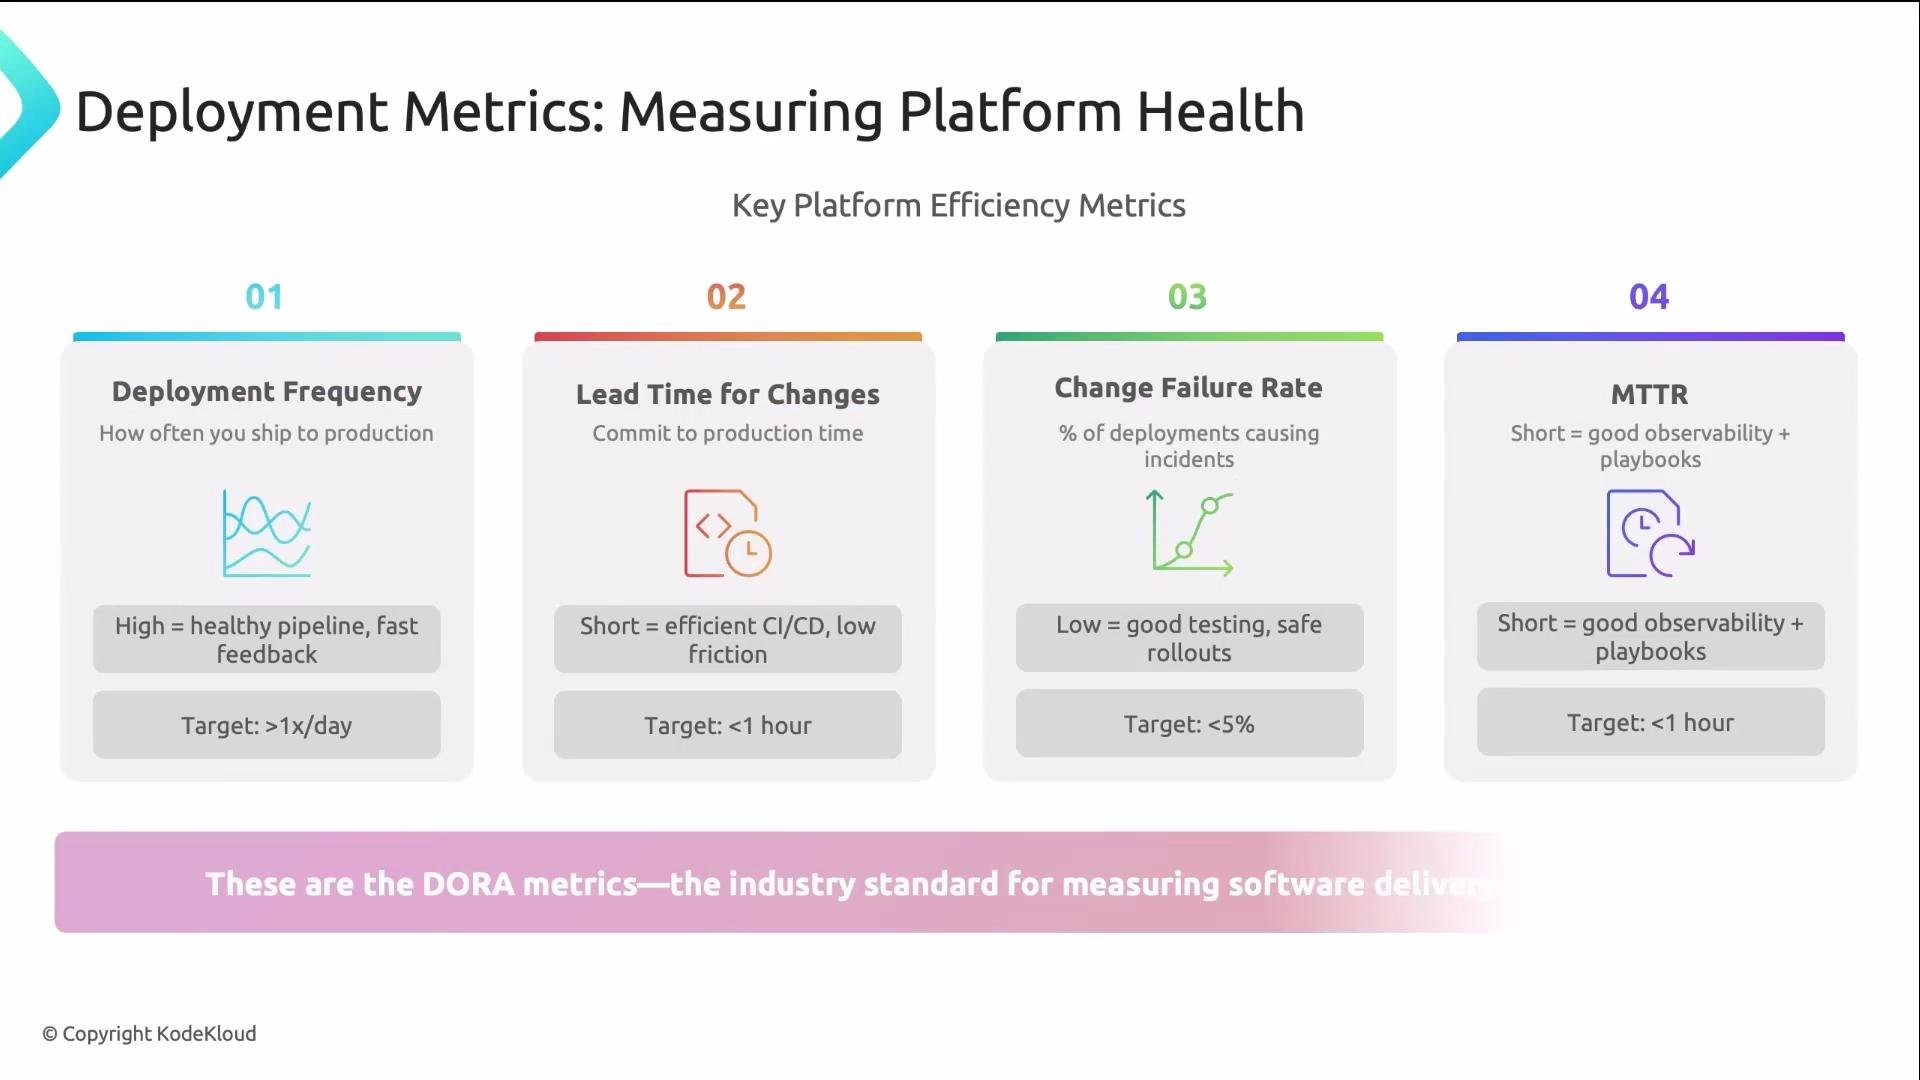
 Measure platform performance over time with DORA metrics. These give you objective targets to reduce MTTR and improve reliability.
| DORA Metric | What it measures | Example target |
| ---------------------------- | ----------------------------------------- | -------------- |
| Deployment Frequency | How often you ship to production | Daily or more |
| Lead Time for Changes | Time from commit to production | Under 1 hour |
| Change Failure Rate | % of deployments causing failures | Under 5% |
| Mean Time to Recovery (MTTR) | Time to restore service after an incident | Under 1 hour |
Measure platform performance over time with DORA metrics. These give you objective targets to reduce MTTR and improve reliability.
| DORA Metric | What it measures | Example target |
| ---------------------------- | ----------------------------------------- | -------------- |
| Deployment Frequency | How often you ship to production | Daily or more |
| Lead Time for Changes | Time from commit to production | Under 1 hour |
| Change Failure Rate | % of deployments causing failures | Under 5% |
| Mean Time to Recovery (MTTR) | Time to restore service after an incident | Under 1 hour |
 Phase 4 — Fix: four safe strategies
* Rollback
* When to use: a recent deployment caused the incident and assessment/investigation confirm it.
* Why: fastest, lowest-risk path to restore service.
* Example:
```bash theme={null}
kubectl rollout undo deployment app
```
* Scale up
* When to use: load exceeds capacity (CPU/memory/requests throttled) and you need breathing room.
* Why: buys time to investigate whether load is legitimate or anomalous.
* Example:
```bash theme={null}
kubectl scale deployment app --replicas=5
```
* Config fixes
* When to use: misconfigured DB URL, expired secret, or bad environment variable.
* How: update ConfigMap/Secret and trigger a restart or rolling update.
* Example:
```bash theme={null}
kubectl rollout restart deployment app
```
* Resource adjustments (scheduling failures)
* When to use: pods Pending because nodes lack allocatable resources.
* How: free resources, tune requests/limits, or adjust quotas for targeted workloads.
* Note: avoid broad, cluster-wide changes during an active incident; prefer targeted, minimal changes.
During an incident prefer reversible, minimal changes. Large, unreviewed edits or cluster-wide operations increase risk and can create cascading failures.
Quick phase-to-tool reference
| Phase | Common tools / actions |
| ----------- | ------------------------------------------------------------------ |
| Alert | Alertmanager, PagerDuty, Slack; check alert details and timestamps |
| Assess | Grafana dashboards, runbooks, deployment history |
| Investigate | Prometheus (PromQL), Jaeger traces, Loki/kubectl logs |
| Fix | kubectl, Helm, GitOps rollbacks, targeted scaling or config edits |
| Validate | Grafana dashboards, synthetic tests, user-facing checks |
Key takeaways
* Follow the playbook every time: Alert → Assess → Investigate → Fix → Validate.
* Never skip the Assess phase; the 60-second check prevents wasted effort.
* Use the three observability pillars as a funnel: metrics detect, traces locate, logs explain.
* Prefer minimal, reversible fixes that restore service quickly and enable deeper post-incident investigation.
* Track DORA metrics to measure platform health and quantify improvements to MTTR.
Links and references
* [Prometheus Documentation](https://prometheus.io/docs/)
* [Grafana Docs](https://grafana.com/docs/)
* [Jaeger Tracing](https://www.jaegertracing.io/docs/)
* [Loki Logging](https://grafana.com/oss/loki/)
* [Kubernetes kubectl reference](https://kubernetes.io/docs/reference/kubectl/)
Use this playbook as your default incident response flow. With consistent practice and post-incident learning, the same tools will yield much faster, safer outcomes.
Phase 4 — Fix: four safe strategies
* Rollback
* When to use: a recent deployment caused the incident and assessment/investigation confirm it.
* Why: fastest, lowest-risk path to restore service.
* Example:
```bash theme={null}
kubectl rollout undo deployment app
```
* Scale up
* When to use: load exceeds capacity (CPU/memory/requests throttled) and you need breathing room.
* Why: buys time to investigate whether load is legitimate or anomalous.
* Example:
```bash theme={null}
kubectl scale deployment app --replicas=5
```
* Config fixes
* When to use: misconfigured DB URL, expired secret, or bad environment variable.
* How: update ConfigMap/Secret and trigger a restart or rolling update.
* Example:
```bash theme={null}
kubectl rollout restart deployment app
```
* Resource adjustments (scheduling failures)
* When to use: pods Pending because nodes lack allocatable resources.
* How: free resources, tune requests/limits, or adjust quotas for targeted workloads.
* Note: avoid broad, cluster-wide changes during an active incident; prefer targeted, minimal changes.
During an incident prefer reversible, minimal changes. Large, unreviewed edits or cluster-wide operations increase risk and can create cascading failures.
Quick phase-to-tool reference
| Phase | Common tools / actions |
| ----------- | ------------------------------------------------------------------ |
| Alert | Alertmanager, PagerDuty, Slack; check alert details and timestamps |
| Assess | Grafana dashboards, runbooks, deployment history |
| Investigate | Prometheus (PromQL), Jaeger traces, Loki/kubectl logs |
| Fix | kubectl, Helm, GitOps rollbacks, targeted scaling or config edits |
| Validate | Grafana dashboards, synthetic tests, user-facing checks |
Key takeaways
* Follow the playbook every time: Alert → Assess → Investigate → Fix → Validate.
* Never skip the Assess phase; the 60-second check prevents wasted effort.
* Use the three observability pillars as a funnel: metrics detect, traces locate, logs explain.
* Prefer minimal, reversible fixes that restore service quickly and enable deeper post-incident investigation.
* Track DORA metrics to measure platform health and quantify improvements to MTTR.
Links and references
* [Prometheus Documentation](https://prometheus.io/docs/)
* [Grafana Docs](https://grafana.com/docs/)
* [Jaeger Tracing](https://www.jaegertracing.io/docs/)
* [Loki Logging](https://grafana.com/oss/loki/)
* [Kubernetes kubectl reference](https://kubernetes.io/docs/reference/kubectl/)
Use this playbook as your default incident response flow. With consistent practice and post-incident learning, the same tools will yield much faster, safer outcomes.