> ## Documentation Index
> Fetch the complete documentation index at: https://notes.kodekloud.com/llms.txt
> Use this file to discover all available pages before exploring further.
# Metrics Architecture Collection Storage and Querying
> Overview of Prometheus metrics architecture, collection, metric types, labeling, PromQL querying and Kubernetes integration for reliable, scalable observability and consistent dashboards
Metrics are the first pillar of observability — they answer "what is happening" in your system. Collecting metrics at scale, however, introduces challenges: fragmentation, inconsistent labeling, and difficulty correlating signals across components.
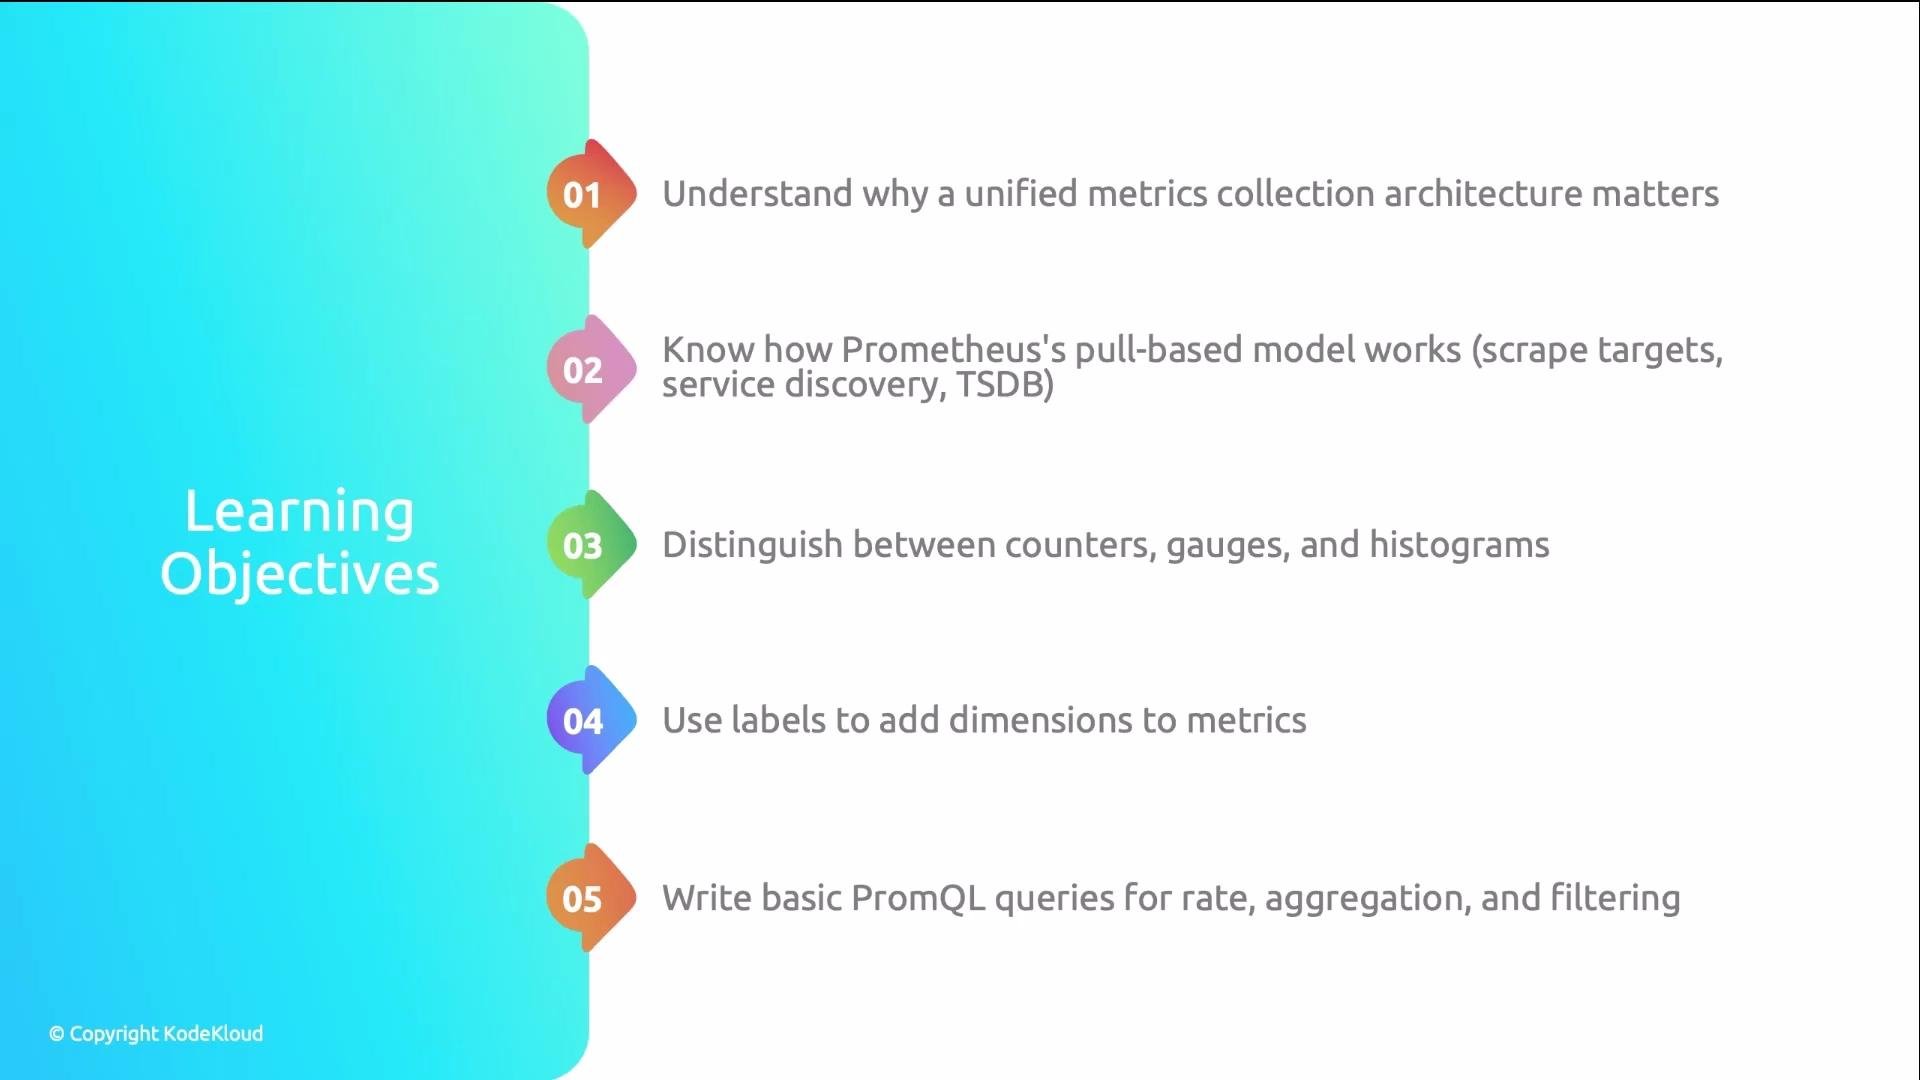
By the end of this lesson you'll understand how Prometheus collects metrics, the three primary metric types and when to use each, how labels enable multi-dimensional queries, and enough PromQL to build Grafana dashboards and alerts.
 ## Why consistent labeling matters — a concrete example
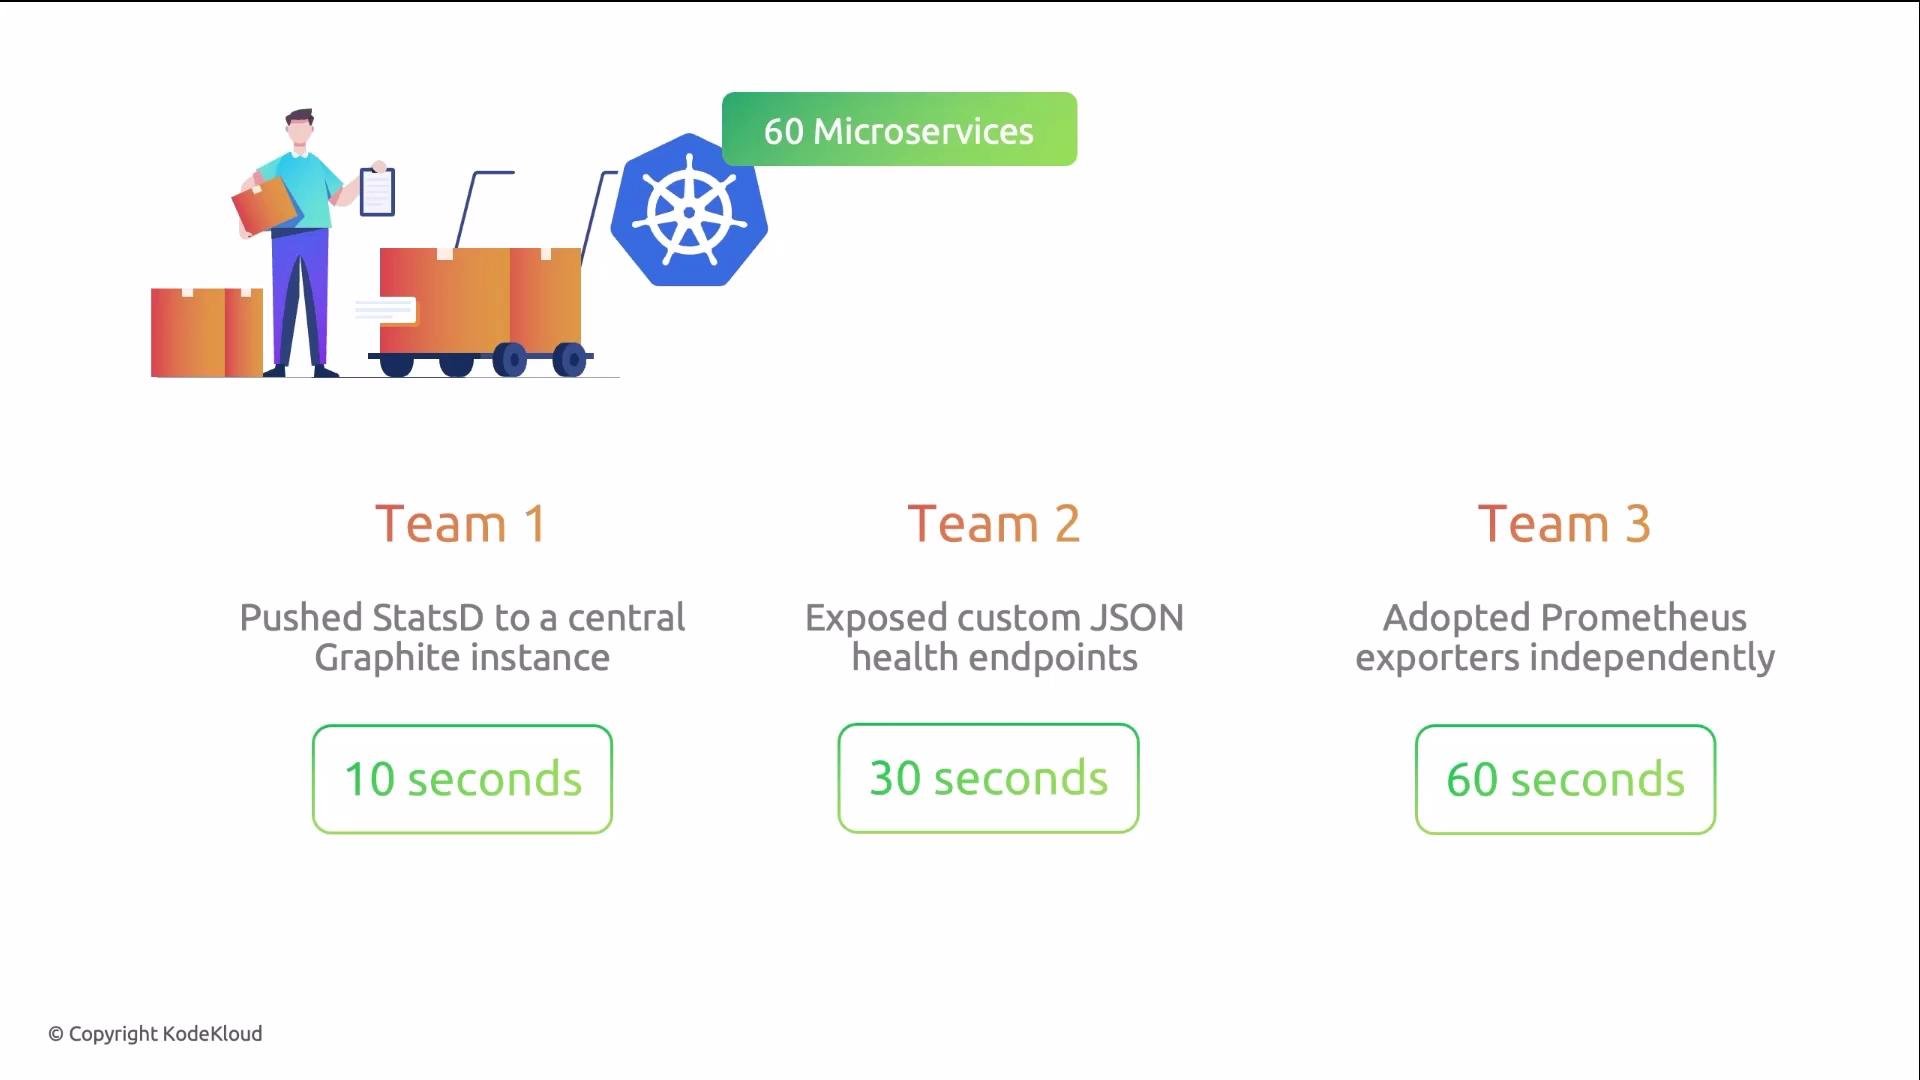
A logistics platform ran 60 microservices across three Kubernetes clusters. Each team chose different metric approaches. During a database connection-pool exhaustion incident, the platform team needed to correlate:
* API error rates
* Database connection counts
* Pod memory usage
Those metrics existed across three different systems, with different time granularities and distinct label sets — there was no reliable way to join them. What should have been a five-minute correlation became a ninety-minute merge of spreadsheets.
After migrating to Prometheus and enforcing consistent labeling, the same correlation was a single-line PromQL query and returned instant results.
## Why consistent labeling matters — a concrete example
A logistics platform ran 60 microservices across three Kubernetes clusters. Each team chose different metric approaches. During a database connection-pool exhaustion incident, the platform team needed to correlate:
* API error rates
* Database connection counts
* Pod memory usage
Those metrics existed across three different systems, with different time granularities and distinct label sets — there was no reliable way to join them. What should have been a five-minute correlation became a ninety-minute merge of spreadsheets.
After migrating to Prometheus and enforcing consistent labeling, the same correlation was a single-line PromQL query and returned instant results.
 ## The problem: data everywhere
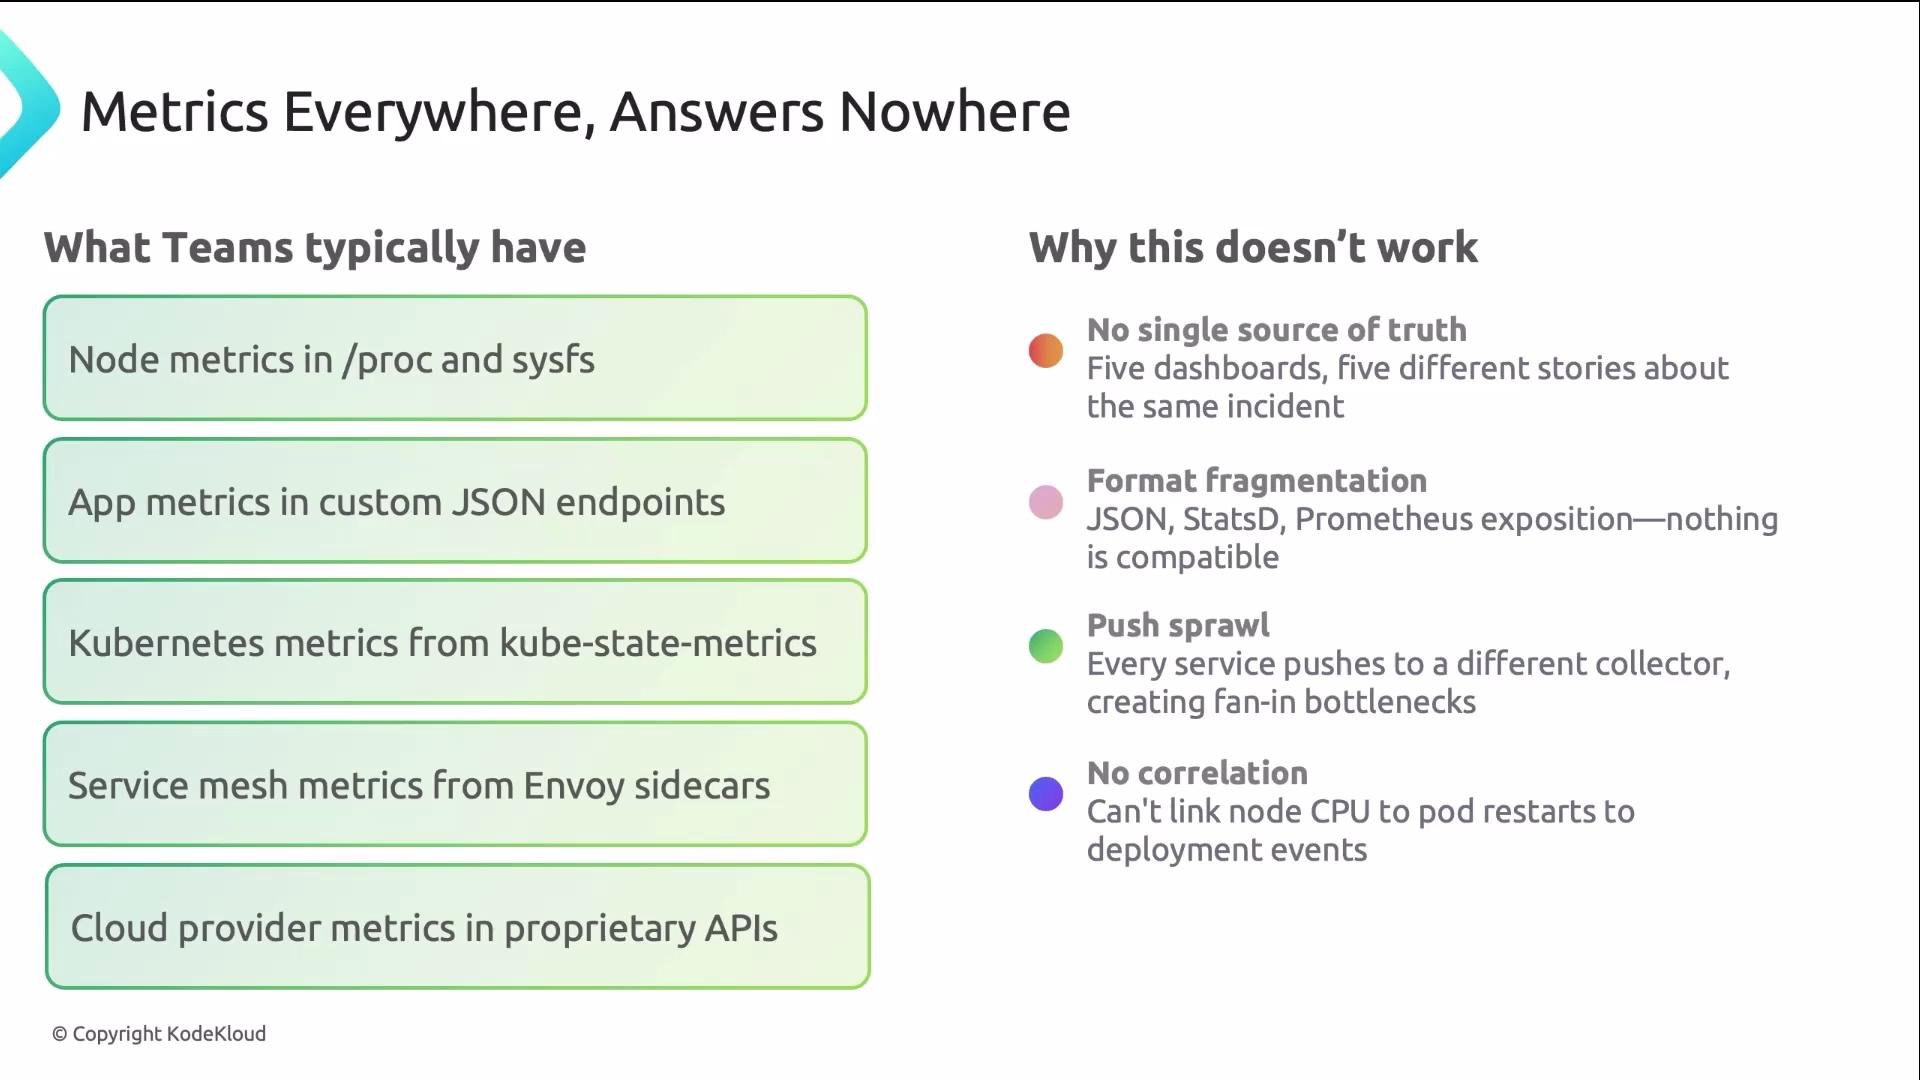
Without a unified approach you get:
* No single source of truth
* Format fragmentation
* Push-sprawl
* Difficult correlation and inconsistent dashboards
A unified collection architecture prevents multiple dashboards from telling different stories about the same incident. Prometheus is the de-facto standard for that unified approach.
## The problem: data everywhere
Without a unified approach you get:
* No single source of truth
* Format fragmentation
* Push-sprawl
* Difficult correlation and inconsistent dashboards
A unified collection architecture prevents multiple dashboards from telling different stories about the same incident. Prometheus is the de-facto standard for that unified approach.
 ## Prometheus architecture — four conceptual layers
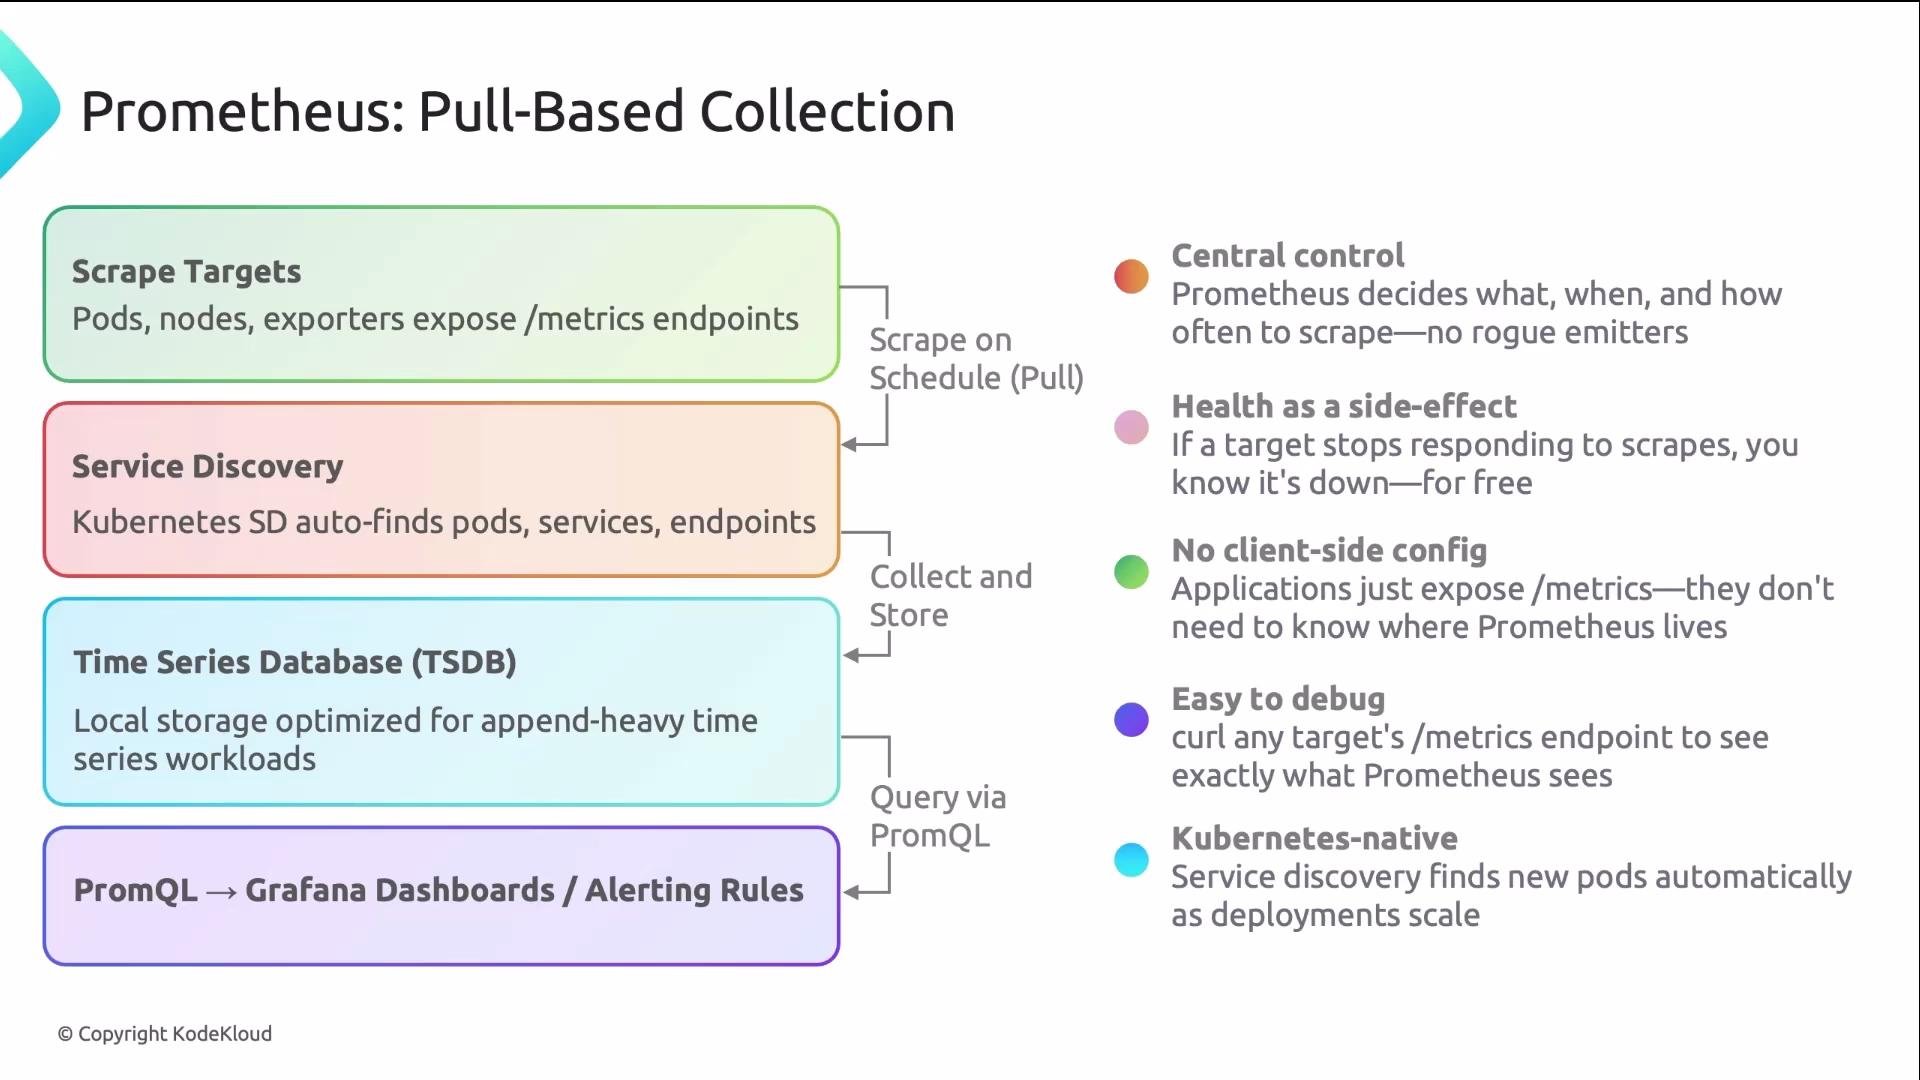
Prometheus provides a predictable, Kubernetes-native collection model. Conceptually it has four layers:
* Targets: applications expose a `/metrics` HTTP endpoint.
* Service discovery: finds targets automatically (Kubernetes, Consul, etc.).
* Prometheus server: scrapes targets and stores time-series samples in its TSDB.
* PromQL: queries the time-series database for analysis, dashboards, and alerts.
Why pull instead of push?
* Central control: scrape intervals and targets are controlled centrally.
* Health detection and debugging: if a target stops responding, Prometheus notices immediately and you can inspect the exact `/metrics` output.
Operational benefits:
* No client-side scrape scheduling
* Easier debugging (query the target directly)
* Strong Kubernetes-native integration
Prometheus is primarily pull-based. For short-lived batch jobs that can't be scraped, the official escape hatch is the Pushgateway. Use Pushgateway sparingly — it’s an exception, not the default pattern. See the Prometheus push practices for details: [https://prometheus.io/docs/practices/pushing/](https://prometheus.io/docs/practices/pushing/)
## Prometheus architecture — four conceptual layers
Prometheus provides a predictable, Kubernetes-native collection model. Conceptually it has four layers:
* Targets: applications expose a `/metrics` HTTP endpoint.
* Service discovery: finds targets automatically (Kubernetes, Consul, etc.).
* Prometheus server: scrapes targets and stores time-series samples in its TSDB.
* PromQL: queries the time-series database for analysis, dashboards, and alerts.
Why pull instead of push?
* Central control: scrape intervals and targets are controlled centrally.
* Health detection and debugging: if a target stops responding, Prometheus notices immediately and you can inspect the exact `/metrics` output.
Operational benefits:
* No client-side scrape scheduling
* Easier debugging (query the target directly)
* Strong Kubernetes-native integration
Prometheus is primarily pull-based. For short-lived batch jobs that can't be scraped, the official escape hatch is the Pushgateway. Use Pushgateway sparingly — it’s an exception, not the default pattern. See the Prometheus push practices for details: [https://prometheus.io/docs/practices/pushing/](https://prometheus.io/docs/practices/pushing/)
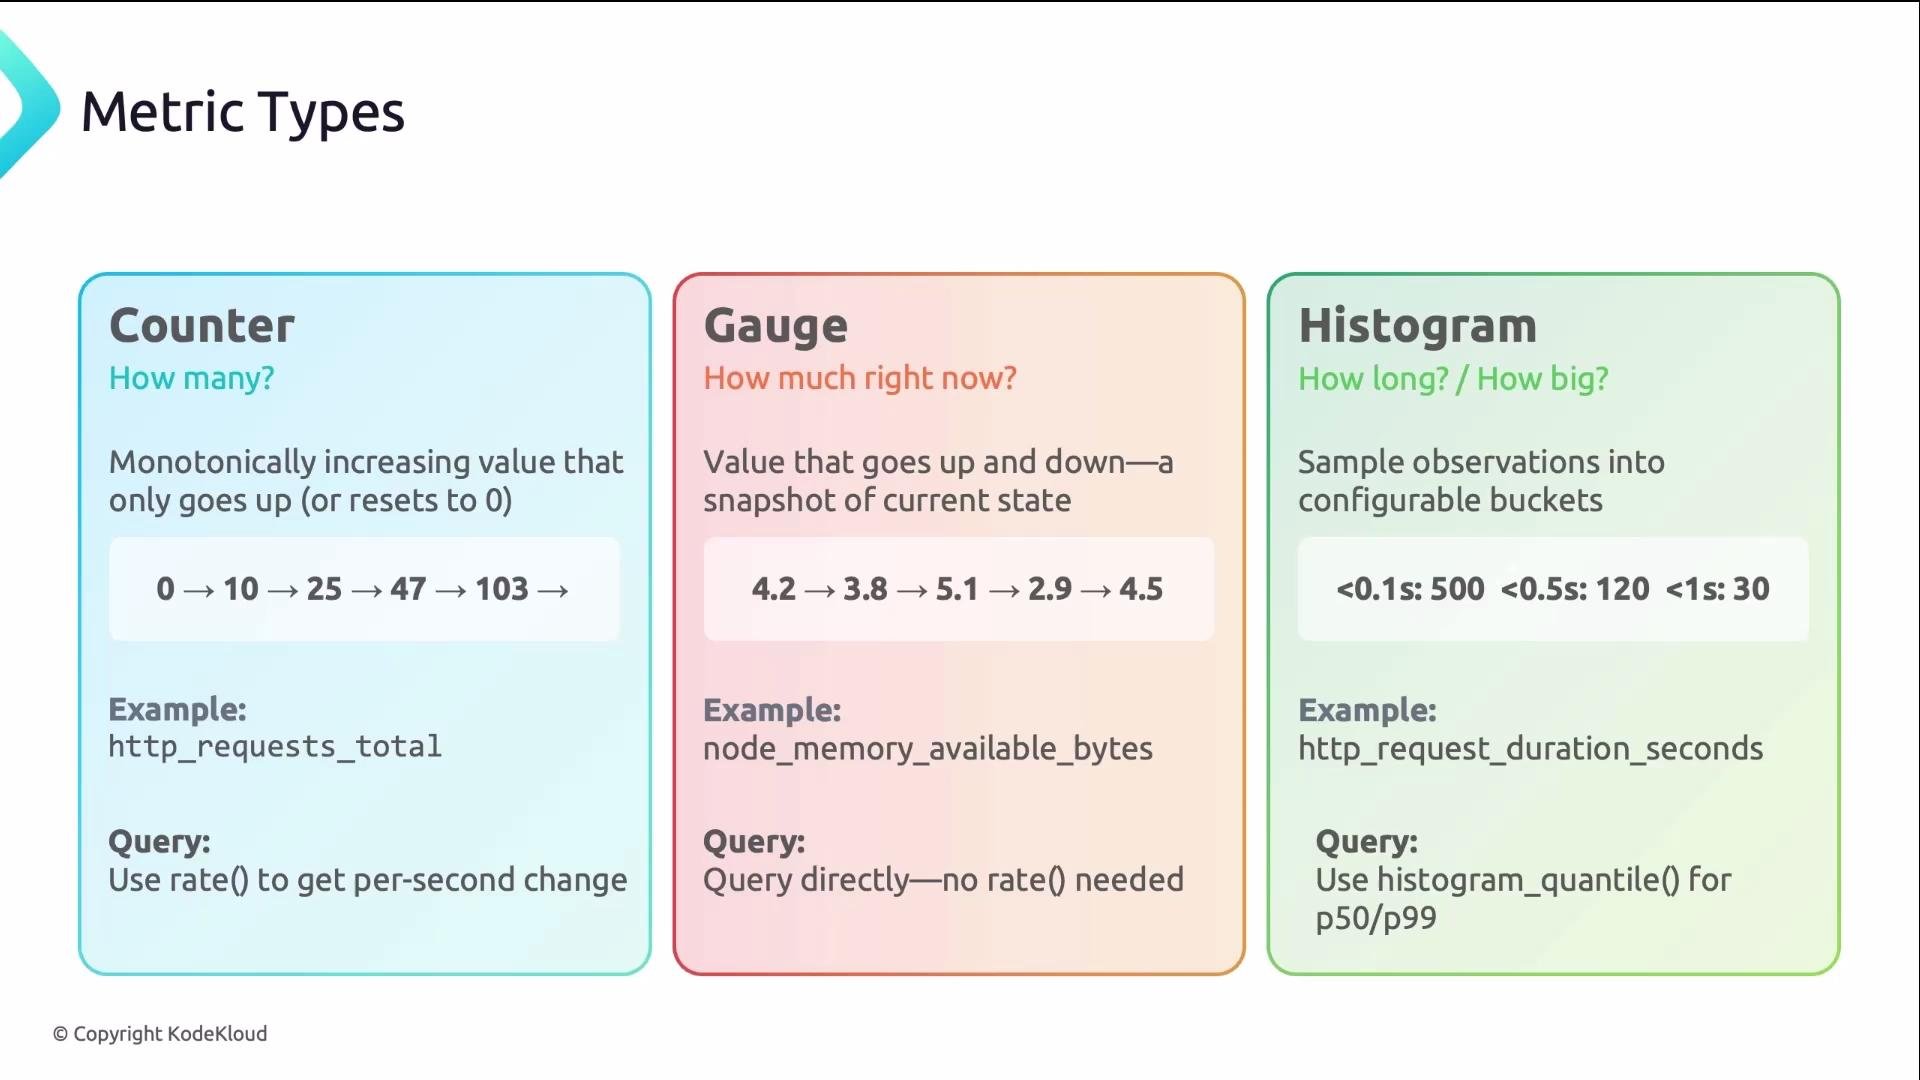
 ## Metric types — what to use and how to query them
Choosing the correct metric type and query pattern is critical. Applying the wrong PromQL function to a metric type is the most common mistake.
| Metric Type | What it answers | How to compute/query | Notes / Example |
| ----------- | ----------------------------------------------------------------------------------- | ----------------------------------------------------------------------------------- | ----------------------------------------------------------------------------------------------------------------- |
| Counter | "How many" (monotonic, non-decreasing) | Use range-vector functions: `rate()` (per-second) or `increase()` over a window | Counters can reset on restart — `rate()` and `increase()` handle resets. Example: `rate(http_requests_total[5m])` |
| Gauge | "How much right now" (can increase/decrease) | Query instant value directly or use other non-monotonic functions | Do not use `rate()` on gauges. Example: `container_memory_usage_bytes{namespace="production"}` |
| Histogram | "How long" or distribution (bucketed cumulative counters, plus `_count` and `_sum`) | Apply `rate()` to `_bucket` counters and use `histogram_quantile()` for percentiles | Example: `histogram_quantile(0.95, sum by (le) (rate(request_duration_seconds_bucket[5m])))` |
Key rules:
* Avoid `rate()` on gauges — use the raw gauge or appropriate functions.
* To interpret counters, always use `rate()` or `increase()`.
* For histograms, operate on the bucket counters (often with `rate()`) and use `histogram_quantile()` for percentiles.
## Metric types — what to use and how to query them
Choosing the correct metric type and query pattern is critical. Applying the wrong PromQL function to a metric type is the most common mistake.
| Metric Type | What it answers | How to compute/query | Notes / Example |
| ----------- | ----------------------------------------------------------------------------------- | ----------------------------------------------------------------------------------- | ----------------------------------------------------------------------------------------------------------------- |
| Counter | "How many" (monotonic, non-decreasing) | Use range-vector functions: `rate()` (per-second) or `increase()` over a window | Counters can reset on restart — `rate()` and `increase()` handle resets. Example: `rate(http_requests_total[5m])` |
| Gauge | "How much right now" (can increase/decrease) | Query instant value directly or use other non-monotonic functions | Do not use `rate()` on gauges. Example: `container_memory_usage_bytes{namespace="production"}` |
| Histogram | "How long" or distribution (bucketed cumulative counters, plus `_count` and `_sum`) | Apply `rate()` to `_bucket` counters and use `histogram_quantile()` for percentiles | Example: `histogram_quantile(0.95, sum by (le) (rate(request_duration_seconds_bucket[5m])))` |
Key rules:
* Avoid `rate()` on gauges — use the raw gauge or appropriate functions.
* To interpret counters, always use `rate()` or `increase()`.
* For histograms, operate on the bucket counters (often with `rate()`) and use `histogram_quantile()` for percentiles.
 ## Labels: dimensionality by design
Labels are one of Prometheus’s most powerful features. Without labels you’d need a unique metric name for every dimension combination — that doesn’t scale. Labels let you:
* Filter subsets (e.g., by `namespace`, `pod`, `service`)
* Group and aggregate (e.g., `sum by (service)`)
* Correlate metrics across services when labels are consistent
Kubernetes injects many useful labels automatically (for example, `namespace`). Establish platform-wide labeling conventions (team, service, environment) to make cross-service queries straightforward.
## PromQL patterns you’ll use daily
PromQL can look intimidating, but most needs are covered by three patterns:
1. Instant vector — current values
2. Range vector + function — rates/changes over time
3. Aggregation — group and summarize by labels
Examples:
```promql theme={null}
# Instant vector: current memory per pod (instant query)
container_memory_usage_bytes{namespace="production"}
```
```promql theme={null}
# Range vector + rate: requests per second over a 5m window
rate(http_requests_total[5m])
```
```promql theme={null}
# Aggregation: total error rate (5xx) by service over 5m
sum by (service) (
rate(http_requests_total{code=~"5.."}[5m])
)
```
Remember: counters may reset when a process restarts. Functions like `rate()` and `increase()` are resilient to resets. Use gauges for instantaneous values and avoid `rate()` on non-monotonic series.
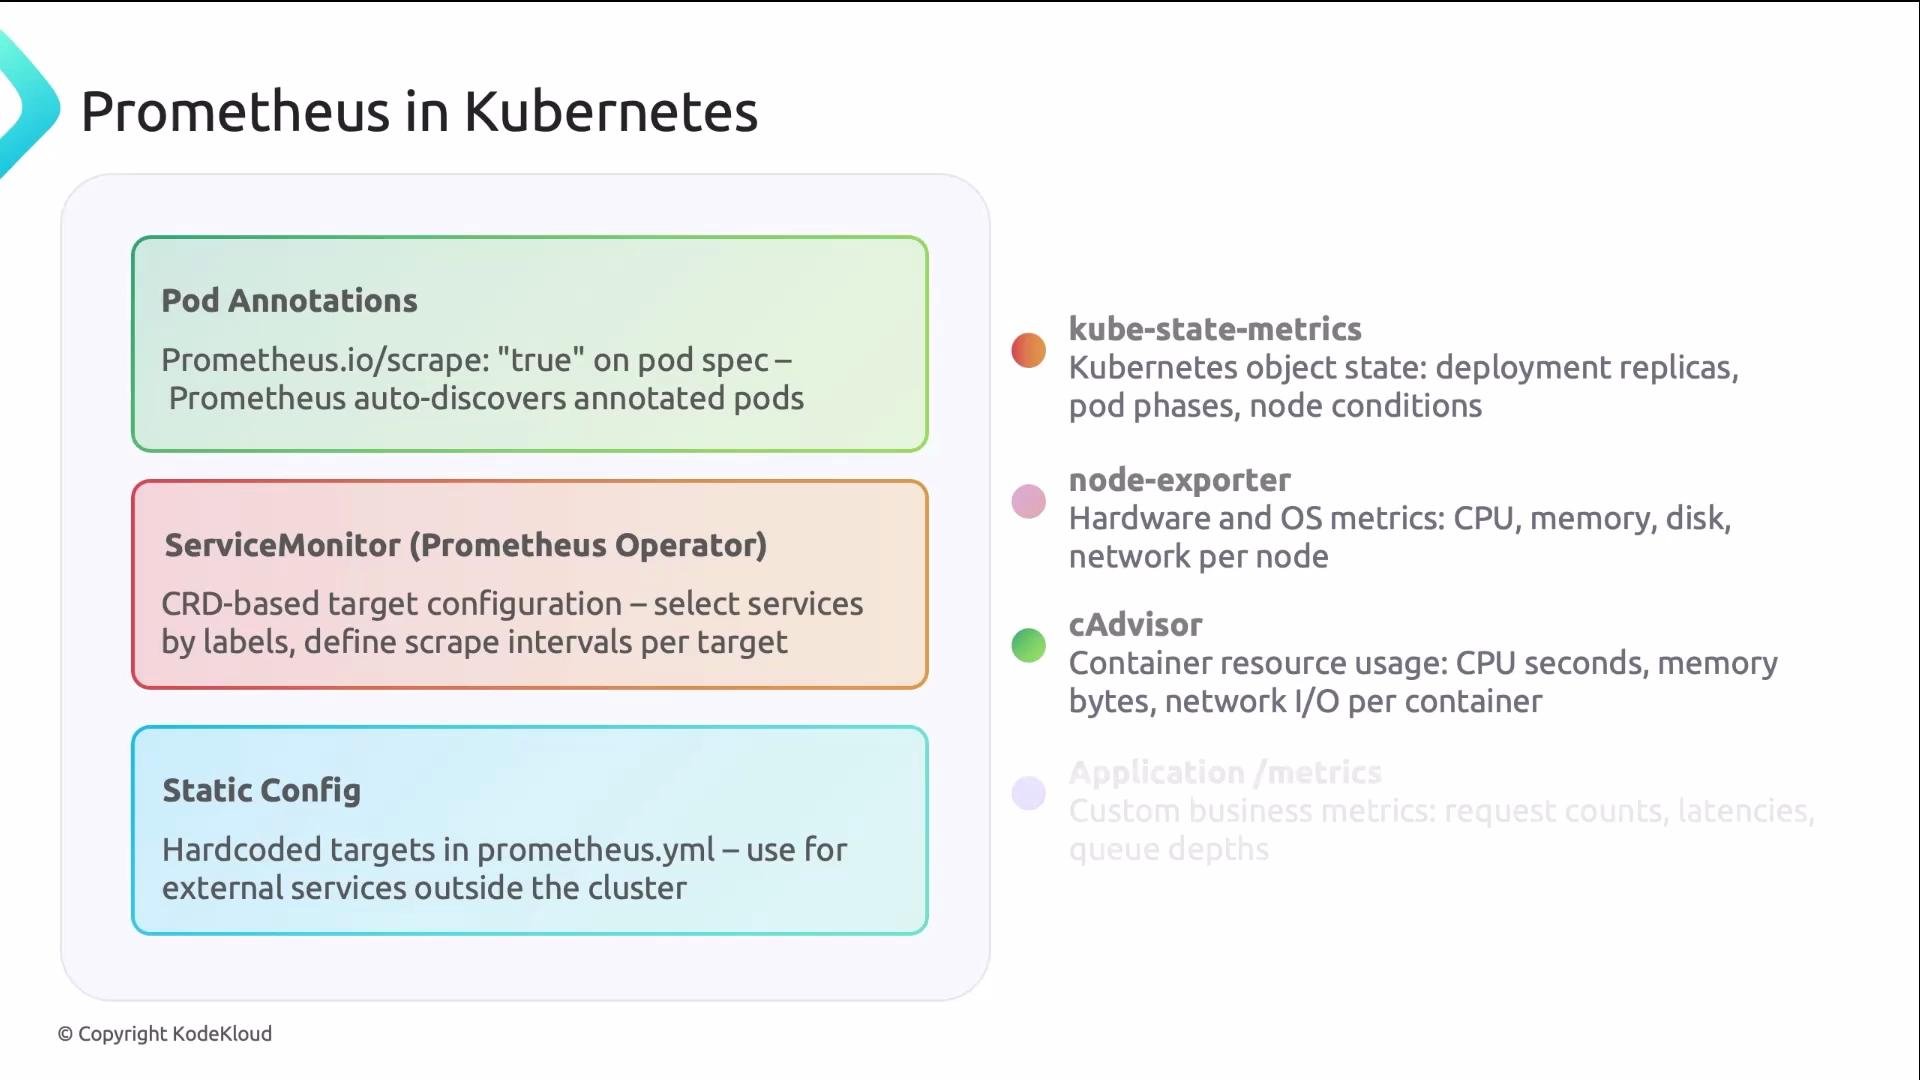
## Prometheus in Kubernetes — discovery and common targets
Common discovery methods in Kubernetes:
* Pod annotations: quick for simple setups. Example:
```yaml theme={null}
# Pod annotation example
metadata:
annotations:
prometheus.io/scrape: "true"
prometheus.io/port: "8080"
```
* ServiceMonitor: CRD from the Prometheus Operator (recommended for scale). ServiceMonitors let you declaratively manage scrape targets and relabeling.
* Static configuration: use for external systems or legacy services that are not discovered via Kubernetes.
Typical metric sources:
* kube-state-metrics: exposes desired/actual state of Kubernetes objects — deployments, replicasets, pods. ([https://github.com/kubernetes/kube-state-metrics](https://github.com/kubernetes/kube-state-metrics))
* node-exporter: node-level hardware metrics — CPU, memory, disk, network. ([https://github.com/prometheus/node\_exporter](https://github.com/prometheus/node_exporter))
* cAdvisor: container-level CPU and memory metrics. ([https://github.com/google/cadvisor](https://github.com/google/cadvisor))
* Your app’s `/metrics` endpoint: business and application-specific metrics.
## Labels: dimensionality by design
Labels are one of Prometheus’s most powerful features. Without labels you’d need a unique metric name for every dimension combination — that doesn’t scale. Labels let you:
* Filter subsets (e.g., by `namespace`, `pod`, `service`)
* Group and aggregate (e.g., `sum by (service)`)
* Correlate metrics across services when labels are consistent
Kubernetes injects many useful labels automatically (for example, `namespace`). Establish platform-wide labeling conventions (team, service, environment) to make cross-service queries straightforward.
## PromQL patterns you’ll use daily
PromQL can look intimidating, but most needs are covered by three patterns:
1. Instant vector — current values
2. Range vector + function — rates/changes over time
3. Aggregation — group and summarize by labels
Examples:
```promql theme={null}
# Instant vector: current memory per pod (instant query)
container_memory_usage_bytes{namespace="production"}
```
```promql theme={null}
# Range vector + rate: requests per second over a 5m window
rate(http_requests_total[5m])
```
```promql theme={null}
# Aggregation: total error rate (5xx) by service over 5m
sum by (service) (
rate(http_requests_total{code=~"5.."}[5m])
)
```
Remember: counters may reset when a process restarts. Functions like `rate()` and `increase()` are resilient to resets. Use gauges for instantaneous values and avoid `rate()` on non-monotonic series.
## Prometheus in Kubernetes — discovery and common targets
Common discovery methods in Kubernetes:
* Pod annotations: quick for simple setups. Example:
```yaml theme={null}
# Pod annotation example
metadata:
annotations:
prometheus.io/scrape: "true"
prometheus.io/port: "8080"
```
* ServiceMonitor: CRD from the Prometheus Operator (recommended for scale). ServiceMonitors let you declaratively manage scrape targets and relabeling.
* Static configuration: use for external systems or legacy services that are not discovered via Kubernetes.
Typical metric sources:
* kube-state-metrics: exposes desired/actual state of Kubernetes objects — deployments, replicasets, pods. ([https://github.com/kubernetes/kube-state-metrics](https://github.com/kubernetes/kube-state-metrics))
* node-exporter: node-level hardware metrics — CPU, memory, disk, network. ([https://github.com/prometheus/node\_exporter](https://github.com/prometheus/node_exporter))
* cAdvisor: container-level CPU and memory metrics. ([https://github.com/google/cadvisor](https://github.com/google/cadvisor))
* Your app’s `/metrics` endpoint: business and application-specific metrics.
 ## Quick reference — common PromQL snippets
* Current memory per pod:
```promql theme={null}
container_memory_usage_bytes{namespace="production"}
```
* Requests per second (5m):
```promql theme={null}
rate(http_requests_total[5m])
```
* Aggregate 5xx error rate by service:
```promql theme={null}
sum by (service) (
rate(http_requests_total{code=~"5.."}[5m])
)
```
* 95th percentile latency from histograms:
```promql theme={null}
histogram_quantile(0.95, sum by (le) (rate(request_duration_seconds_bucket[5m])))
```
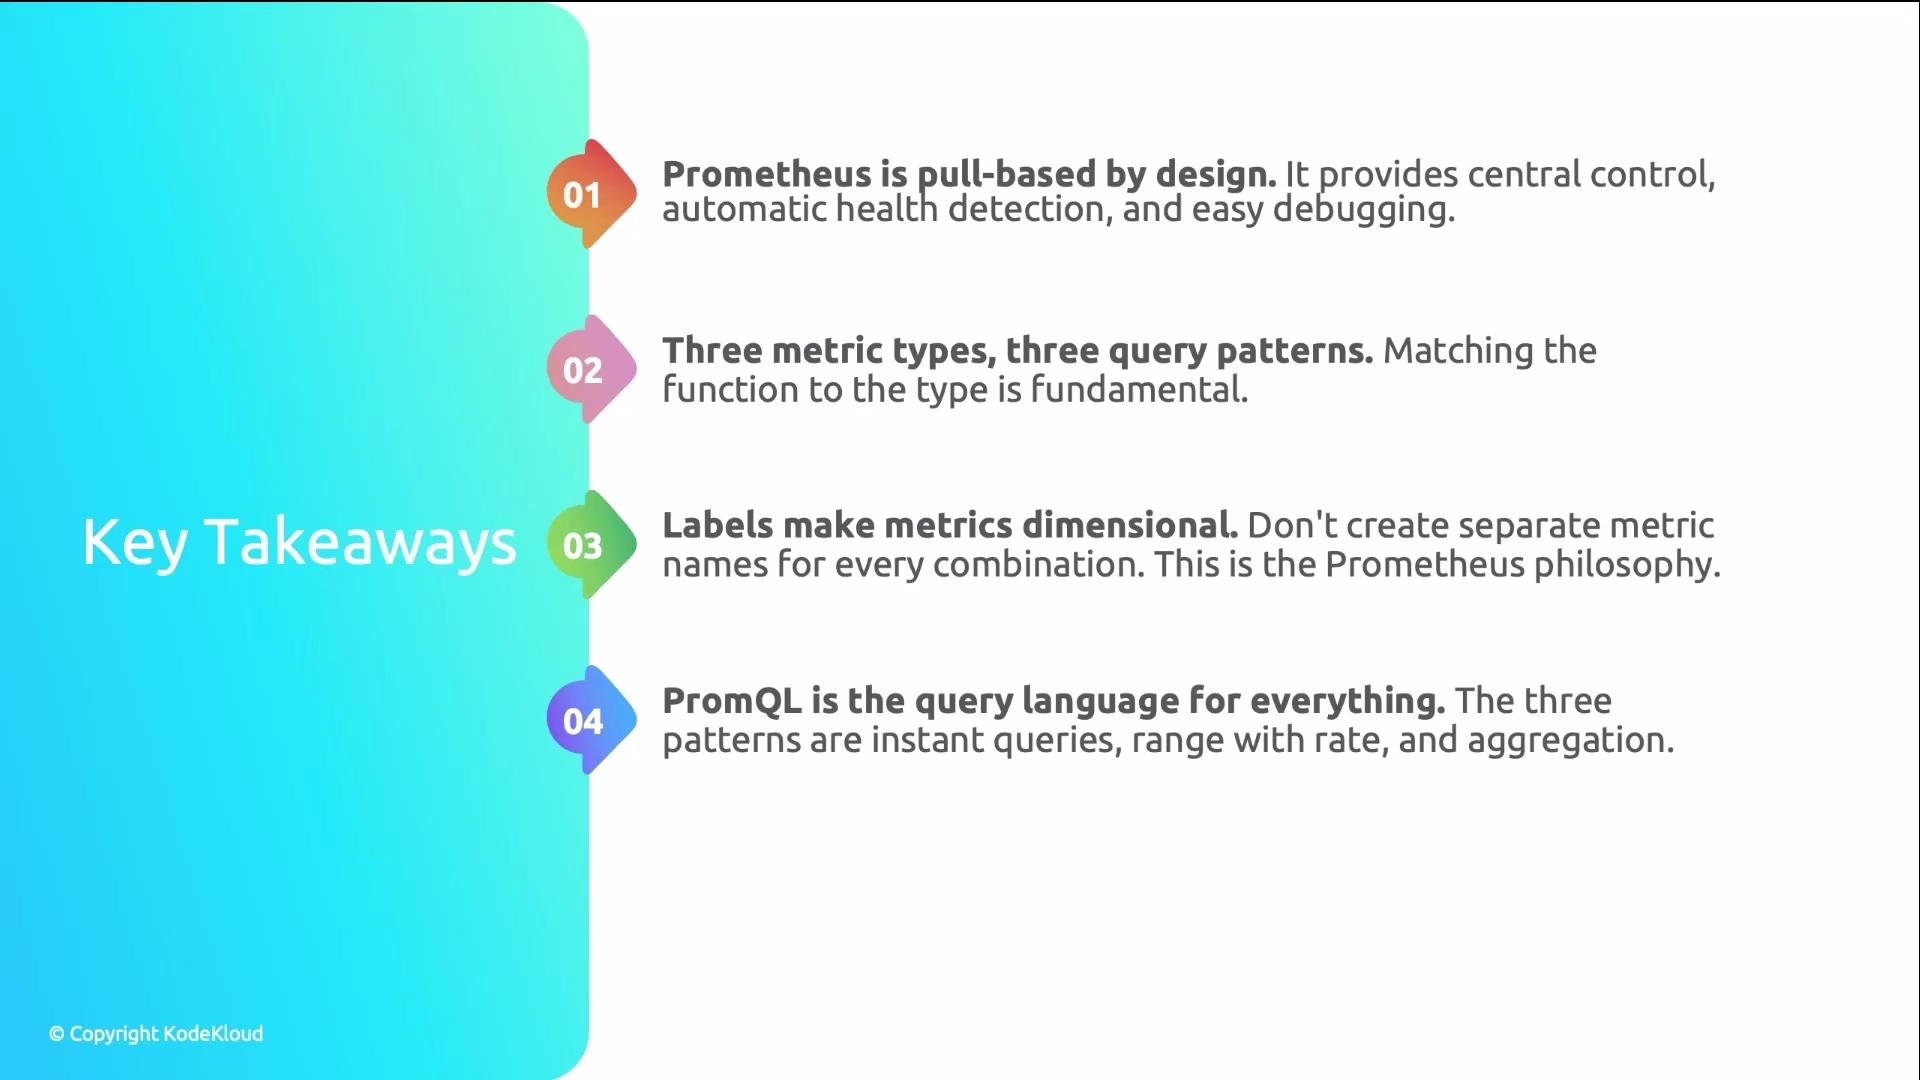
## Summary — core takeaways
* Prometheus is pull-based: this enables central control and automatic health detection.
* There are three primary metric types (counter, gauge, histogram). Use the proper query patterns:
* Counters → `rate()` / `increase()`
* Gauges → instant values or non-monotonic functions
* Histograms → operate on bucket counters and use `histogram_quantile()`
* Labels make metrics dimensional and enable filtering, grouping, and correlation. Enforce consistent labeling conventions.
* PromQL supports instant, range, and aggregation queries — these cover most dashboarding and alerting needs.
## Quick reference — common PromQL snippets
* Current memory per pod:
```promql theme={null}
container_memory_usage_bytes{namespace="production"}
```
* Requests per second (5m):
```promql theme={null}
rate(http_requests_total[5m])
```
* Aggregate 5xx error rate by service:
```promql theme={null}
sum by (service) (
rate(http_requests_total{code=~"5.."}[5m])
)
```
* 95th percentile latency from histograms:
```promql theme={null}
histogram_quantile(0.95, sum by (le) (rate(request_duration_seconds_bucket[5m])))
```
## Summary — core takeaways
* Prometheus is pull-based: this enables central control and automatic health detection.
* There are three primary metric types (counter, gauge, histogram). Use the proper query patterns:
* Counters → `rate()` / `increase()`
* Gauges → instant values or non-monotonic functions
* Histograms → operate on bucket counters and use `histogram_quantile()`
* Labels make metrics dimensional and enable filtering, grouping, and correlation. Enforce consistent labeling conventions.
* PromQL supports instant, range, and aggregation queries — these cover most dashboarding and alerting needs.
 ## Links and further reading
* Prometheus docs: [https://prometheus.io/docs/](https://prometheus.io/docs/)
* PromQL basics: [https://prometheus.io/docs/prometheus/latest/querying/basics/](https://prometheus.io/docs/prometheus/latest/querying/basics/)
* Prometheus Operator and ServiceMonitor: [https://github.com/prometheus-operator/prometheus-operator](https://github.com/prometheus-operator/prometheus-operator)
* kube-state-metrics: [https://github.com/kubernetes/kube-state-metrics](https://github.com/kubernetes/kube-state-metrics)
* node-exporter: [https://github.com/prometheus/node\_exporter](https://github.com/prometheus/node_exporter)
* Pushgateway best practices: [https://prometheus.io/docs/practices/pushing/](https://prometheus.io/docs/practices/pushing/)
## Links and further reading
* Prometheus docs: [https://prometheus.io/docs/](https://prometheus.io/docs/)
* PromQL basics: [https://prometheus.io/docs/prometheus/latest/querying/basics/](https://prometheus.io/docs/prometheus/latest/querying/basics/)
* Prometheus Operator and ServiceMonitor: [https://github.com/prometheus-operator/prometheus-operator](https://github.com/prometheus-operator/prometheus-operator)
* kube-state-metrics: [https://github.com/kubernetes/kube-state-metrics](https://github.com/kubernetes/kube-state-metrics)
* node-exporter: [https://github.com/prometheus/node\_exporter](https://github.com/prometheus/node_exporter)
* Pushgateway best practices: [https://prometheus.io/docs/practices/pushing/](https://prometheus.io/docs/practices/pushing/)