> ## Documentation Index
> Fetch the complete documentation index at: https://notes.kodekloud.com/llms.txt
> Use this file to discover all available pages before exploring further.
# Observability for Platforms What to Measure and Why
> Guide to platform observability covering metrics, logs, traces, golden signals, tooling, deployment and cost metrics, and operational practices for building and running a self service observability stack.
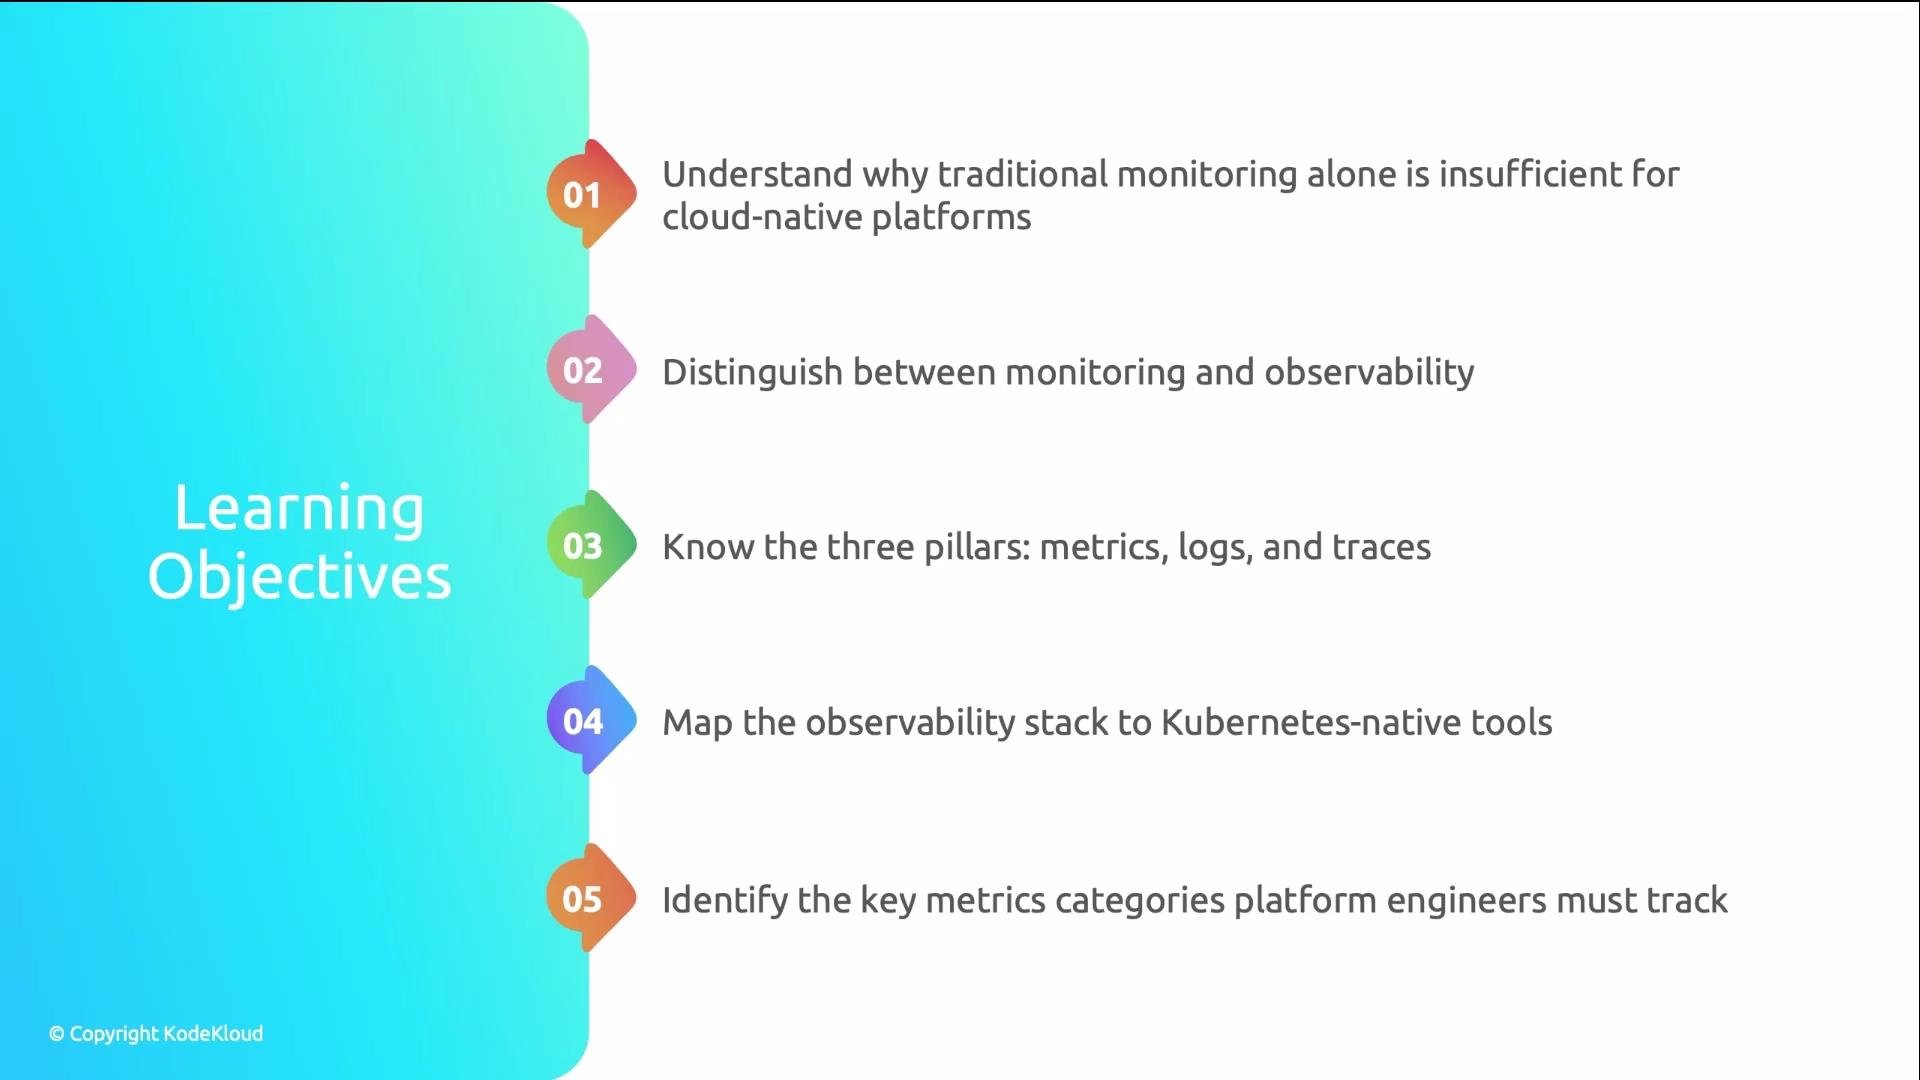
Welcome to the Observability and Operations section.
This domain separates platform engineers who build systems from those who keep them running. The central operational question is simple but critical: when something goes wrong on the platform — and it will — how quickly can you answer what happened, why it happened, and where it happened?
In this lesson we build a mental model that underpins the rest of the course: metrics with Prometheus, dashboards with Grafana, traces with OpenTelemetry and Jaeger, and incident response practices.
 Why observability matters
Think of running a large commercial building with offices, a restaurant, and a gym. If tenants complain, a purely monitoring mindset forces you to walk every floor and manually inspect every panel to find the problem. Observability gives you correlated, centralized signals so you can diagnose from the outside — without physically visiting each system.
In a cloud-native example, a SaaS company running 120 microservices might see checkout latency jump from 200 ms to 8 s during a peak event. Without correlated metrics, traces, and deployment metadata, an on-call engineer can spend 45+ minutes hunting across namespaces and Slack channels. With a well-instrumented platform — centralized metrics, distributed traces tied to deployment metadata, and searchable logs — the root cause can be found in minutes.
Monitoring vs observability
* Monitoring: predefined checks, known failure modes, and binary answers — “is something broken according to the checks we wrote?”
* Observability: exploratory, correlated signals enabling ad-hoc questions — “why is this happening, where is the hotspot, and what change triggered it?”
Why observability matters
Think of running a large commercial building with offices, a restaurant, and a gym. If tenants complain, a purely monitoring mindset forces you to walk every floor and manually inspect every panel to find the problem. Observability gives you correlated, centralized signals so you can diagnose from the outside — without physically visiting each system.
In a cloud-native example, a SaaS company running 120 microservices might see checkout latency jump from 200 ms to 8 s during a peak event. Without correlated metrics, traces, and deployment metadata, an on-call engineer can spend 45+ minutes hunting across namespaces and Slack channels. With a well-instrumented platform — centralized metrics, distributed traces tied to deployment metadata, and searchable logs — the root cause can be found in minutes.
Monitoring vs observability
* Monitoring: predefined checks, known failure modes, and binary answers — “is something broken according to the checks we wrote?”
* Observability: exploratory, correlated signals enabling ad-hoc questions — “why is this happening, where is the hotspot, and what change triggered it?”
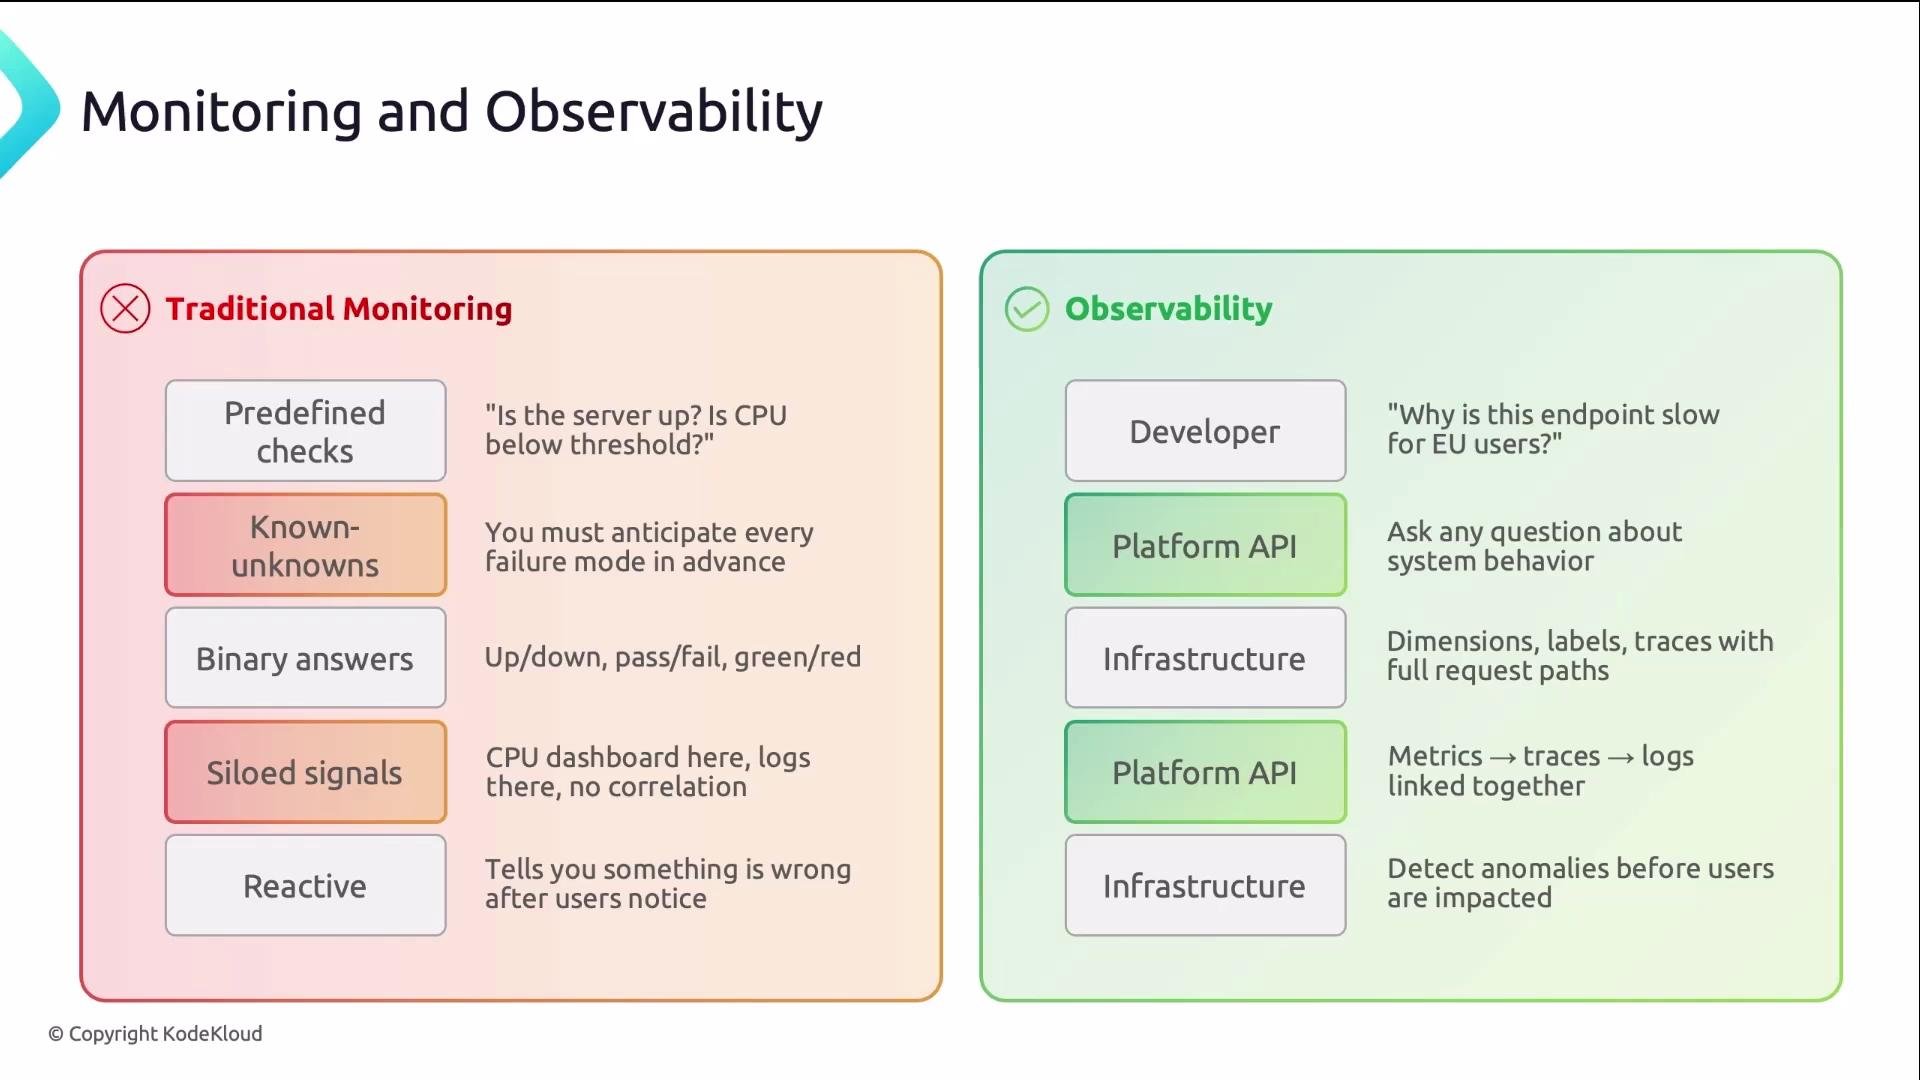 In short: monitoring tells you something is wrong; observability helps you answer why and where.
The three pillars of observability
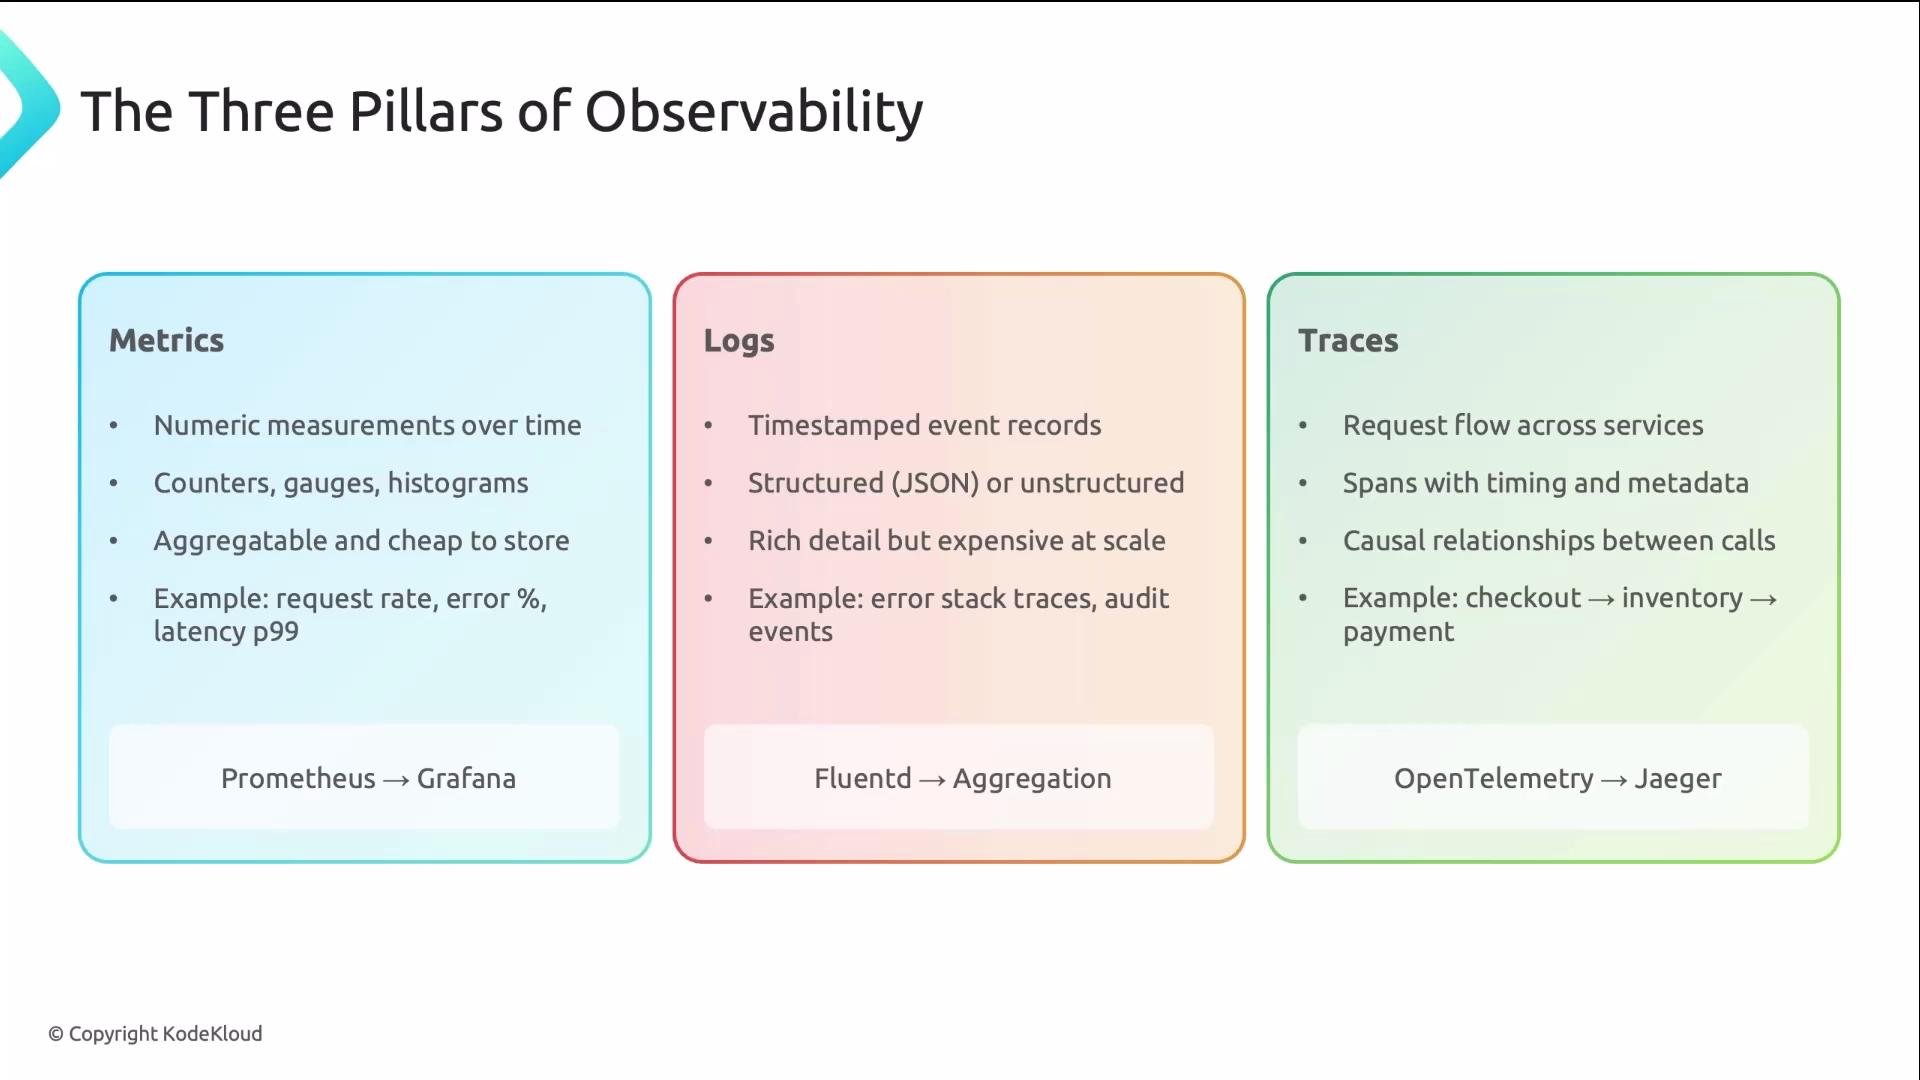
Observability is commonly described with three complementary pillars. Each pillar answers a different operational question:
* Metrics — “What is happening?” Numeric time series: counters, gauges, histograms. Compact, efficient, ideal for dashboards and alerts.
* Logs — “What was the context?” Time-stamped event records with high cardinality and rich context for debugging.
* Traces — “What was the path?” Distributed traces show the sequence of service hops and timings for a request.
Collectively they let you go from a metrics alert to the trace that identifies the slow service and then to the log line with the exception.
In short: monitoring tells you something is wrong; observability helps you answer why and where.
The three pillars of observability
Observability is commonly described with three complementary pillars. Each pillar answers a different operational question:
* Metrics — “What is happening?” Numeric time series: counters, gauges, histograms. Compact, efficient, ideal for dashboards and alerts.
* Logs — “What was the context?” Time-stamped event records with high cardinality and rich context for debugging.
* Traces — “What was the path?” Distributed traces show the sequence of service hops and timings for a request.
Collectively they let you go from a metrics alert to the trace that identifies the slow service and then to the log line with the exception.
 Pillars mapped to common tools
| Pillar | Question answered | Typical tools / examples |
| ------- | --------------------: | -------------------------------------------------------------------------- |
| Metrics | What is happening? | Prometheus (scraping), Grafana (visualization) |
| Logs | What was the context? | Fluentd / Fluent Bit (collection), Elasticsearch / Loki (storage & search) |
| Traces | What was the path? | OpenTelemetry (instrumentation/export), Jaeger / Tempo (visualization) |
How these pillars map to a practical stack
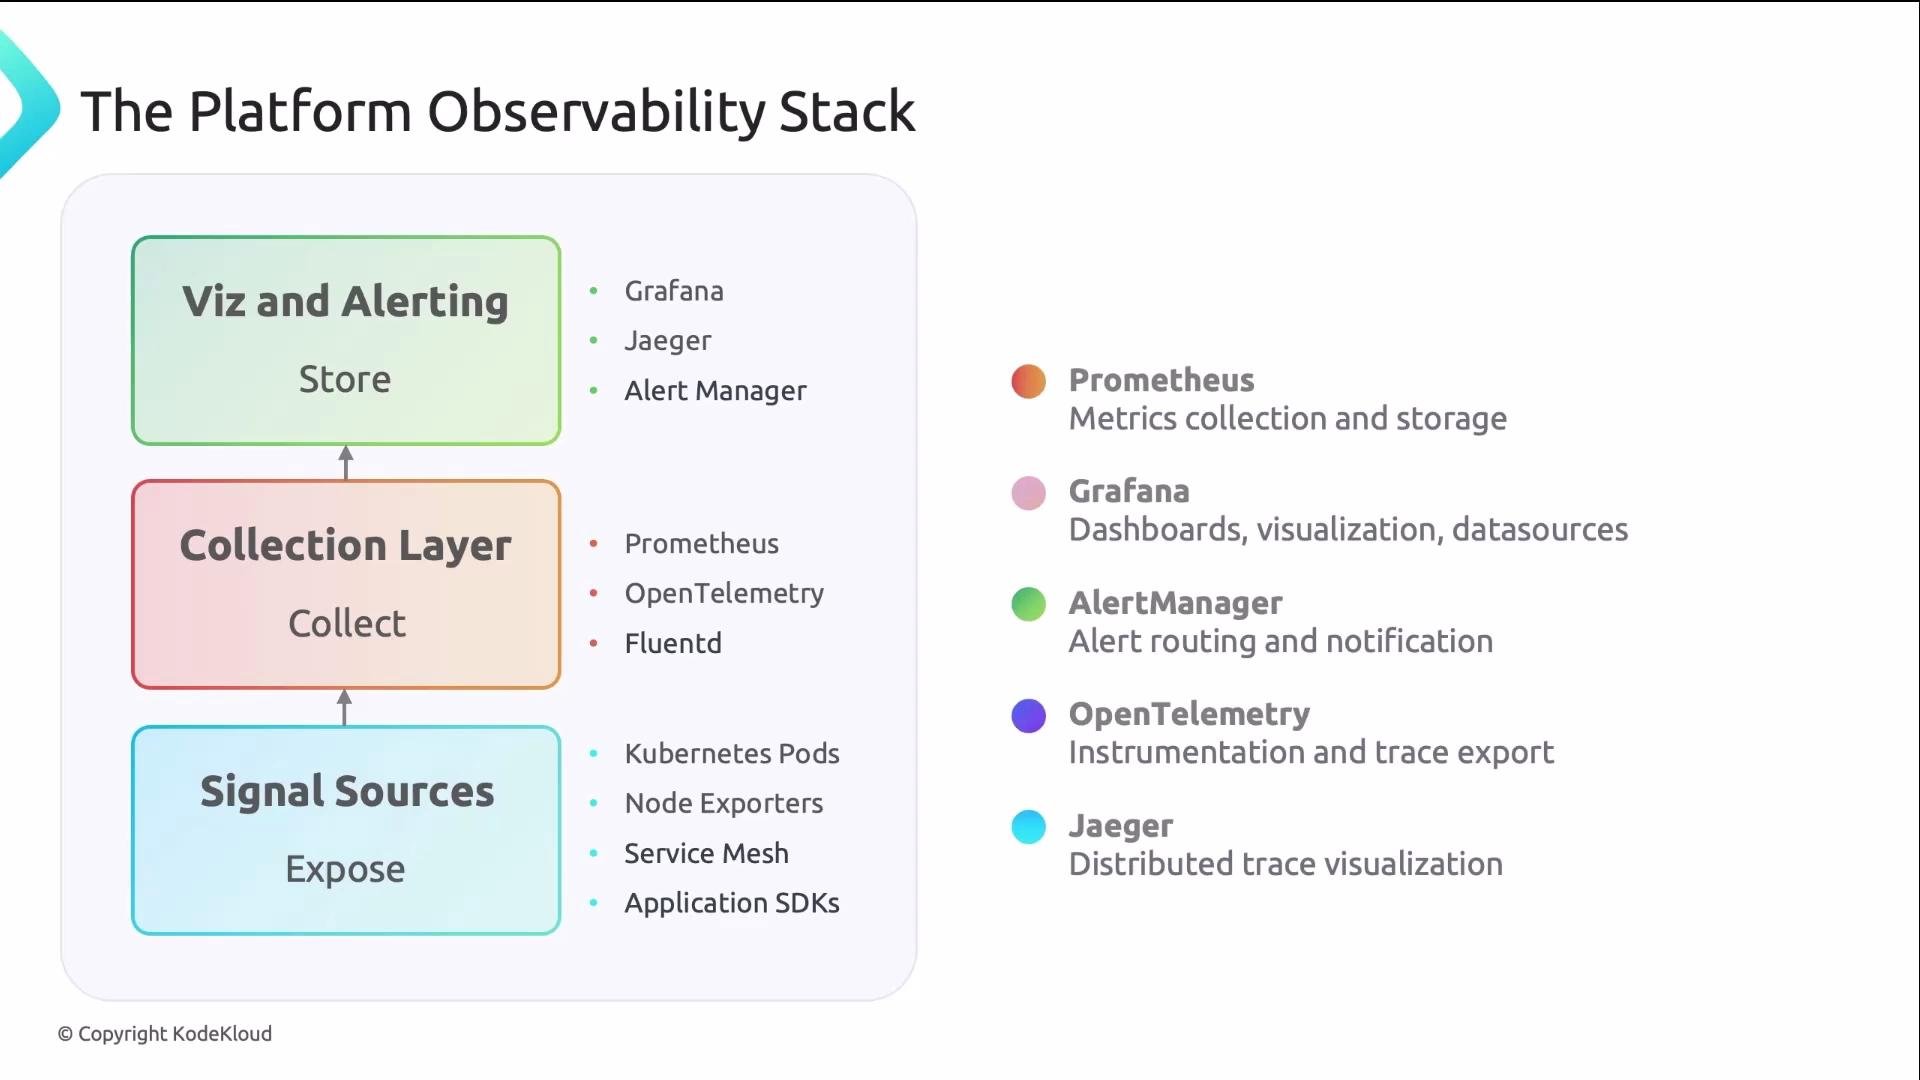
A platform observability stack usually separates responsibilities into layers:
* Signal sources: instrumented apps, node exporters, service mesh sidecars, kube-state metrics.
* Collection layer: Prometheus for metrics scraping, OpenTelemetry Collector for traces and metrics, and Fluentd/Fluent Bit for logs.
* Visualization & alerting: Grafana for dashboards, Jaeger/Tempo for traces, and Alertmanager (or other systems) for notifications and incident workflows.
This diagram is a mental map of signal flow from sources through collection into storage, visualization, and alerting.
Pillars mapped to common tools
| Pillar | Question answered | Typical tools / examples |
| ------- | --------------------: | -------------------------------------------------------------------------- |
| Metrics | What is happening? | Prometheus (scraping), Grafana (visualization) |
| Logs | What was the context? | Fluentd / Fluent Bit (collection), Elasticsearch / Loki (storage & search) |
| Traces | What was the path? | OpenTelemetry (instrumentation/export), Jaeger / Tempo (visualization) |
How these pillars map to a practical stack
A platform observability stack usually separates responsibilities into layers:
* Signal sources: instrumented apps, node exporters, service mesh sidecars, kube-state metrics.
* Collection layer: Prometheus for metrics scraping, OpenTelemetry Collector for traces and metrics, and Fluentd/Fluent Bit for logs.
* Visualization & alerting: Grafana for dashboards, Jaeger/Tempo for traces, and Alertmanager (or other systems) for notifications and incident workflows.
This diagram is a mental map of signal flow from sources through collection into storage, visualization, and alerting.
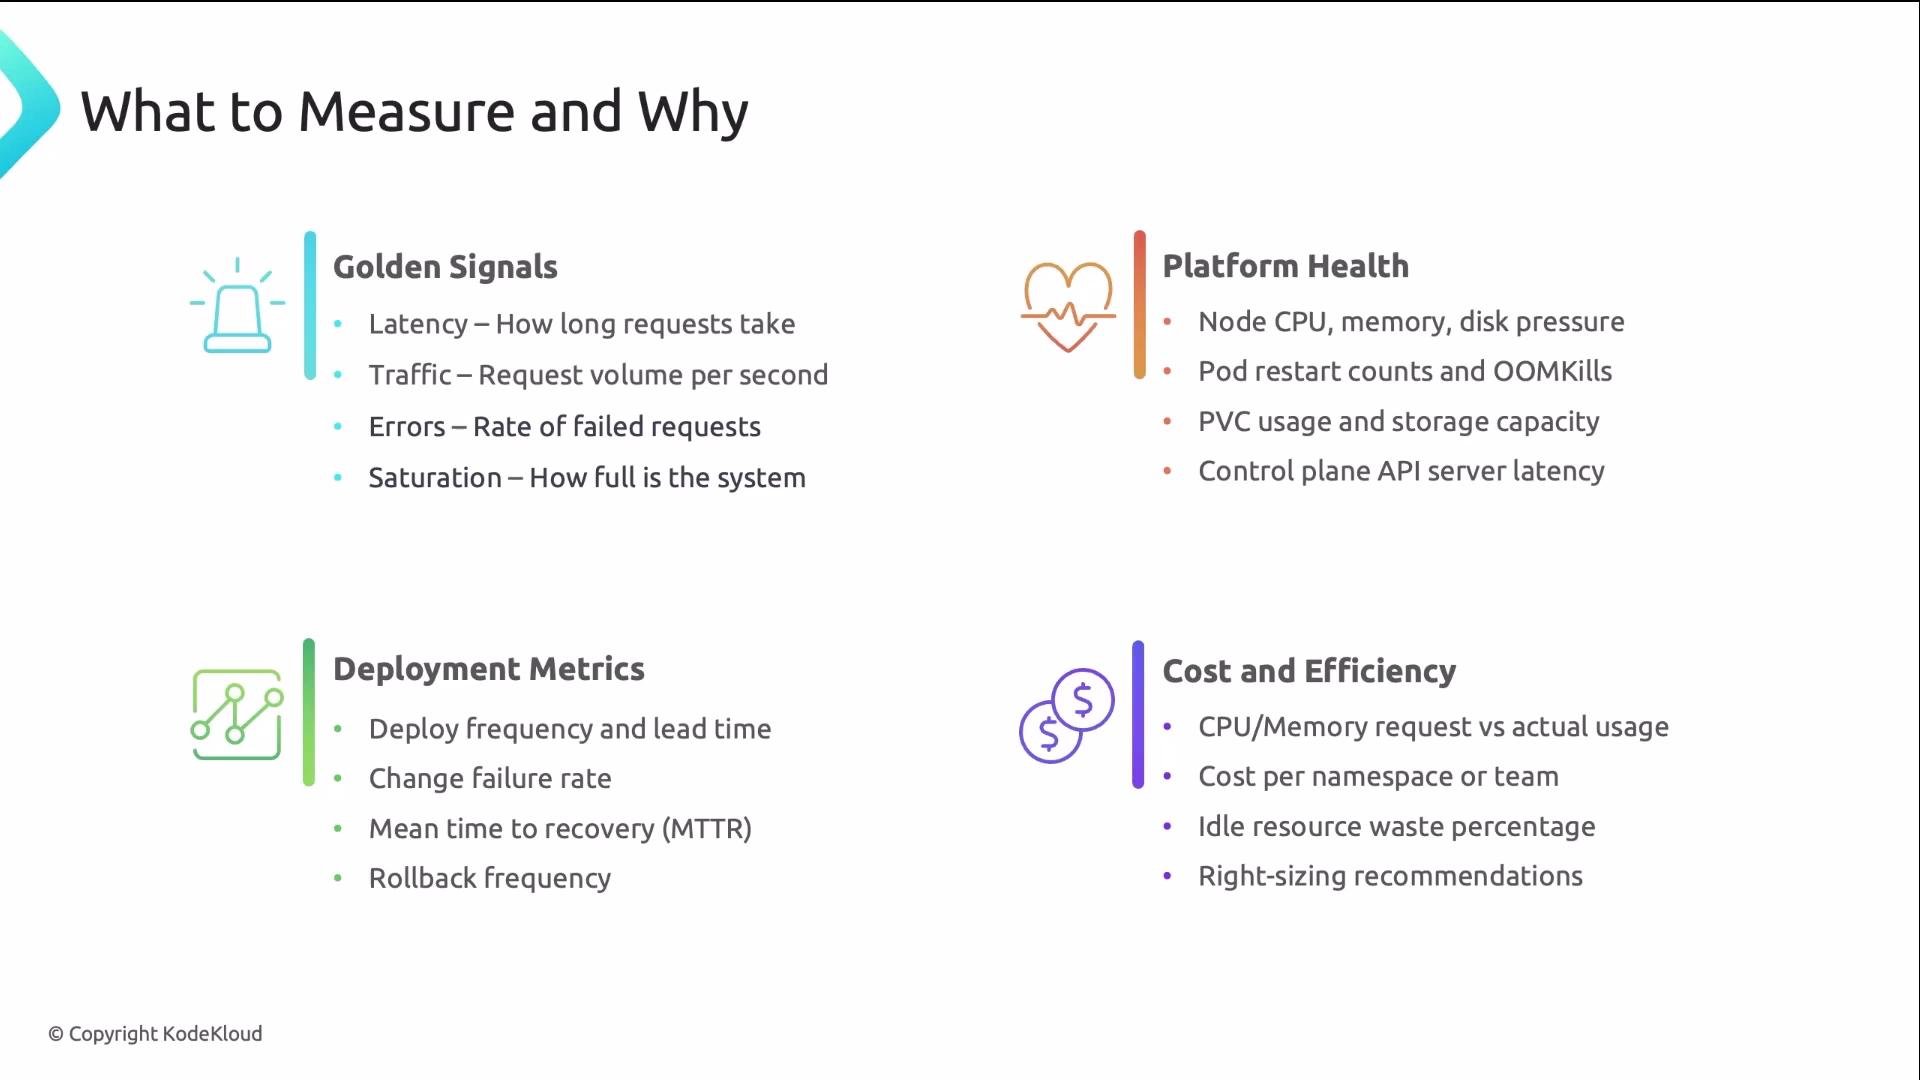
 What to measure — four practical categories
When choosing signals, group them into logical categories that support both incident response and long-term reliability improvements.
1. Golden signals
* Latency: request durations (p50, p90, p99) and distributions by endpoint.
* Traffic: request rates (RPS), throughput, or transactions per second.
* Errors: error count or error-rate percentage, per endpoint/service.
* Saturation: resource usage that limits capacity (CPU, memory, disk, network).
These are the highest-value signals — if you measure only a few things, start here.
The golden signals give immediate insight into user experience and capacity. Instrument critical endpoints and paths to capture latency, traffic, errors, and saturation with labels for service, endpoint, and region to keep cardinality manageable.
2. Platform health
* Node metrics: CPU, memory, disk I/O, network throughput, and filesystem metrics.
* Pod health: restart counts, CrashLoopBackOff events, and OOM kills.
* Control plane metrics: API server latencies, etcd performance, scheduler queues.
3. Deployment and delivery metrics (DORA metrics)
* Deployment release frequency.
* Lead time for changes (commit to production).
* Change failure rate (deployments requiring remediation).
* Mean time to recovery (MTTR).
4. Cost and efficiency
* Requested vs actual resource usage by namespace or workload.
* Cost per service / namespace, and utilization efficiency.
Tools such as OpenCost help map cloud spend to workloads and teams.
Key metrics and examples
| Category | Example metrics | Why they matter |
| --------------- | ------------------------------------------------------------------------------------------------------ | --------------------------------------------------------- |
| Golden signals | `http_request_duration_seconds` (histogram), `http_requests_total` (counter), `node_cpu_seconds_total` | Detect user-facing latency, load, and capacity limits |
| Platform health | `kube_pod_container_status_restarts_total`, `node_filesystem_avail_bytes` | Early warning of infrastructure degradation |
| DORA | `deployments_total`, `lead_time_seconds` | Measure delivery performance and correlate with incidents |
| Cost | `namespace_cpu_cost`, `pod_memory_actual_bytes` | Optimize spend and identify wasteful workloads |
High-cardinality metrics and verbose log retention can dramatically increase storage and costs. Instrument thoughtfully (sample, aggregate, or use histograms), set sensible retention policies, and label with necessary dimensions only.
Operational responsibilities — who owns observability?
* Platform engineers should own the observability stack: provision it, operate it, and provide it as a self-service capability for application teams.
* Application teams should instrument their code with metrics, traces, and meaningful logs using OpenTelemetry and the platform’s recommended libraries and conventions.
* Define SLIs/SLOs and align alerting to actionable thresholds to reduce pager fatigue and false positives.
Quick checklist for a practical observability rollout
* Start with the golden signals for every user-facing service.
* Ensure traces are correlated with request IDs and deployment metadata.
* Centralize logs with searchable context linked from traces and metrics.
* Implement SLOs and configure alerts targeting the right on-call teams.
* Monitor cost and cardinality to keep the observability platform sustainable.
What to measure — four practical categories
When choosing signals, group them into logical categories that support both incident response and long-term reliability improvements.
1. Golden signals
* Latency: request durations (p50, p90, p99) and distributions by endpoint.
* Traffic: request rates (RPS), throughput, or transactions per second.
* Errors: error count or error-rate percentage, per endpoint/service.
* Saturation: resource usage that limits capacity (CPU, memory, disk, network).
These are the highest-value signals — if you measure only a few things, start here.
The golden signals give immediate insight into user experience and capacity. Instrument critical endpoints and paths to capture latency, traffic, errors, and saturation with labels for service, endpoint, and region to keep cardinality manageable.
2. Platform health
* Node metrics: CPU, memory, disk I/O, network throughput, and filesystem metrics.
* Pod health: restart counts, CrashLoopBackOff events, and OOM kills.
* Control plane metrics: API server latencies, etcd performance, scheduler queues.
3. Deployment and delivery metrics (DORA metrics)
* Deployment release frequency.
* Lead time for changes (commit to production).
* Change failure rate (deployments requiring remediation).
* Mean time to recovery (MTTR).
4. Cost and efficiency
* Requested vs actual resource usage by namespace or workload.
* Cost per service / namespace, and utilization efficiency.
Tools such as OpenCost help map cloud spend to workloads and teams.
Key metrics and examples
| Category | Example metrics | Why they matter |
| --------------- | ------------------------------------------------------------------------------------------------------ | --------------------------------------------------------- |
| Golden signals | `http_request_duration_seconds` (histogram), `http_requests_total` (counter), `node_cpu_seconds_total` | Detect user-facing latency, load, and capacity limits |
| Platform health | `kube_pod_container_status_restarts_total`, `node_filesystem_avail_bytes` | Early warning of infrastructure degradation |
| DORA | `deployments_total`, `lead_time_seconds` | Measure delivery performance and correlate with incidents |
| Cost | `namespace_cpu_cost`, `pod_memory_actual_bytes` | Optimize spend and identify wasteful workloads |
High-cardinality metrics and verbose log retention can dramatically increase storage and costs. Instrument thoughtfully (sample, aggregate, or use histograms), set sensible retention policies, and label with necessary dimensions only.
Operational responsibilities — who owns observability?
* Platform engineers should own the observability stack: provision it, operate it, and provide it as a self-service capability for application teams.
* Application teams should instrument their code with metrics, traces, and meaningful logs using OpenTelemetry and the platform’s recommended libraries and conventions.
* Define SLIs/SLOs and align alerting to actionable thresholds to reduce pager fatigue and false positives.
Quick checklist for a practical observability rollout
* Start with the golden signals for every user-facing service.
* Ensure traces are correlated with request IDs and deployment metadata.
* Centralize logs with searchable context linked from traces and metrics.
* Implement SLOs and configure alerts targeting the right on-call teams.
* Monitor cost and cardinality to keep the observability platform sustainable.
 Final thoughts
Observability is broader than monitoring: it empowers teams to investigate unforeseen problems by correlating metrics, logs, and traces. When the platform team owns a well-instrumented, self-service observability stack, development teams move faster and incidents are resolved more quickly and accurately.
Recommended references
* Prometheus: [https://prometheus.io/](https://prometheus.io/)
* Grafana: [https://grafana.com/](https://grafana.com/)
* OpenTelemetry: [https://opentelemetry.io/](https://opentelemetry.io/)
* Jaeger: [https://www.jaegertracing.io/](https://www.jaegertracing.io/)
* Fluentd: [https://www.fluentd.org/](https://www.fluentd.org/)
* Fluent Bit: [https://fluentbit.io/](https://fluentbit.io/)
* Loki: [https://grafana.com/oss/loki](https://grafana.com/oss/loki)
* SRE and Golden Signals: [https://sre.google/](https://sre.google/)
* DORA metrics: [https://devops-research.com/](https://devops-research.com/)
* OpenCost: [https://opencost.io/](https://opencost.io/)
Final thoughts
Observability is broader than monitoring: it empowers teams to investigate unforeseen problems by correlating metrics, logs, and traces. When the platform team owns a well-instrumented, self-service observability stack, development teams move faster and incidents are resolved more quickly and accurately.
Recommended references
* Prometheus: [https://prometheus.io/](https://prometheus.io/)
* Grafana: [https://grafana.com/](https://grafana.com/)
* OpenTelemetry: [https://opentelemetry.io/](https://opentelemetry.io/)
* Jaeger: [https://www.jaegertracing.io/](https://www.jaegertracing.io/)
* Fluentd: [https://www.fluentd.org/](https://www.fluentd.org/)
* Fluent Bit: [https://fluentbit.io/](https://fluentbit.io/)
* Loki: [https://grafana.com/oss/loki](https://grafana.com/oss/loki)
* SRE and Golden Signals: [https://sre.google/](https://sre.google/)
* DORA metrics: [https://devops-research.com/](https://devops-research.com/)
* OpenCost: [https://opencost.io/](https://opencost.io/)