> ## Documentation Index
> Fetch the complete documentation index at: https://notes.kodekloud.com/llms.txt
> Use this file to discover all available pages before exploring further.
# Prometheus Alerting Rules AlertManager and Notification Routing
> Guide to Prometheus alerting rules, Alertmanager routing and grouping, alert lifecycle, and best practices to create reliable, actionable notifications while reducing alert noise.
Collecting metrics is essential, but metrics that sit in a database are useless when an incident happens at 03:00. This lesson closes the loop: it turns PromQL thresholds into automated, actionable notifications. You will learn the two-component alerting model, how to author alerting rules, how Alertmanager routes and groups alerts, and techniques to reduce alert noise.
 Problem statement: dashboards are not alerts
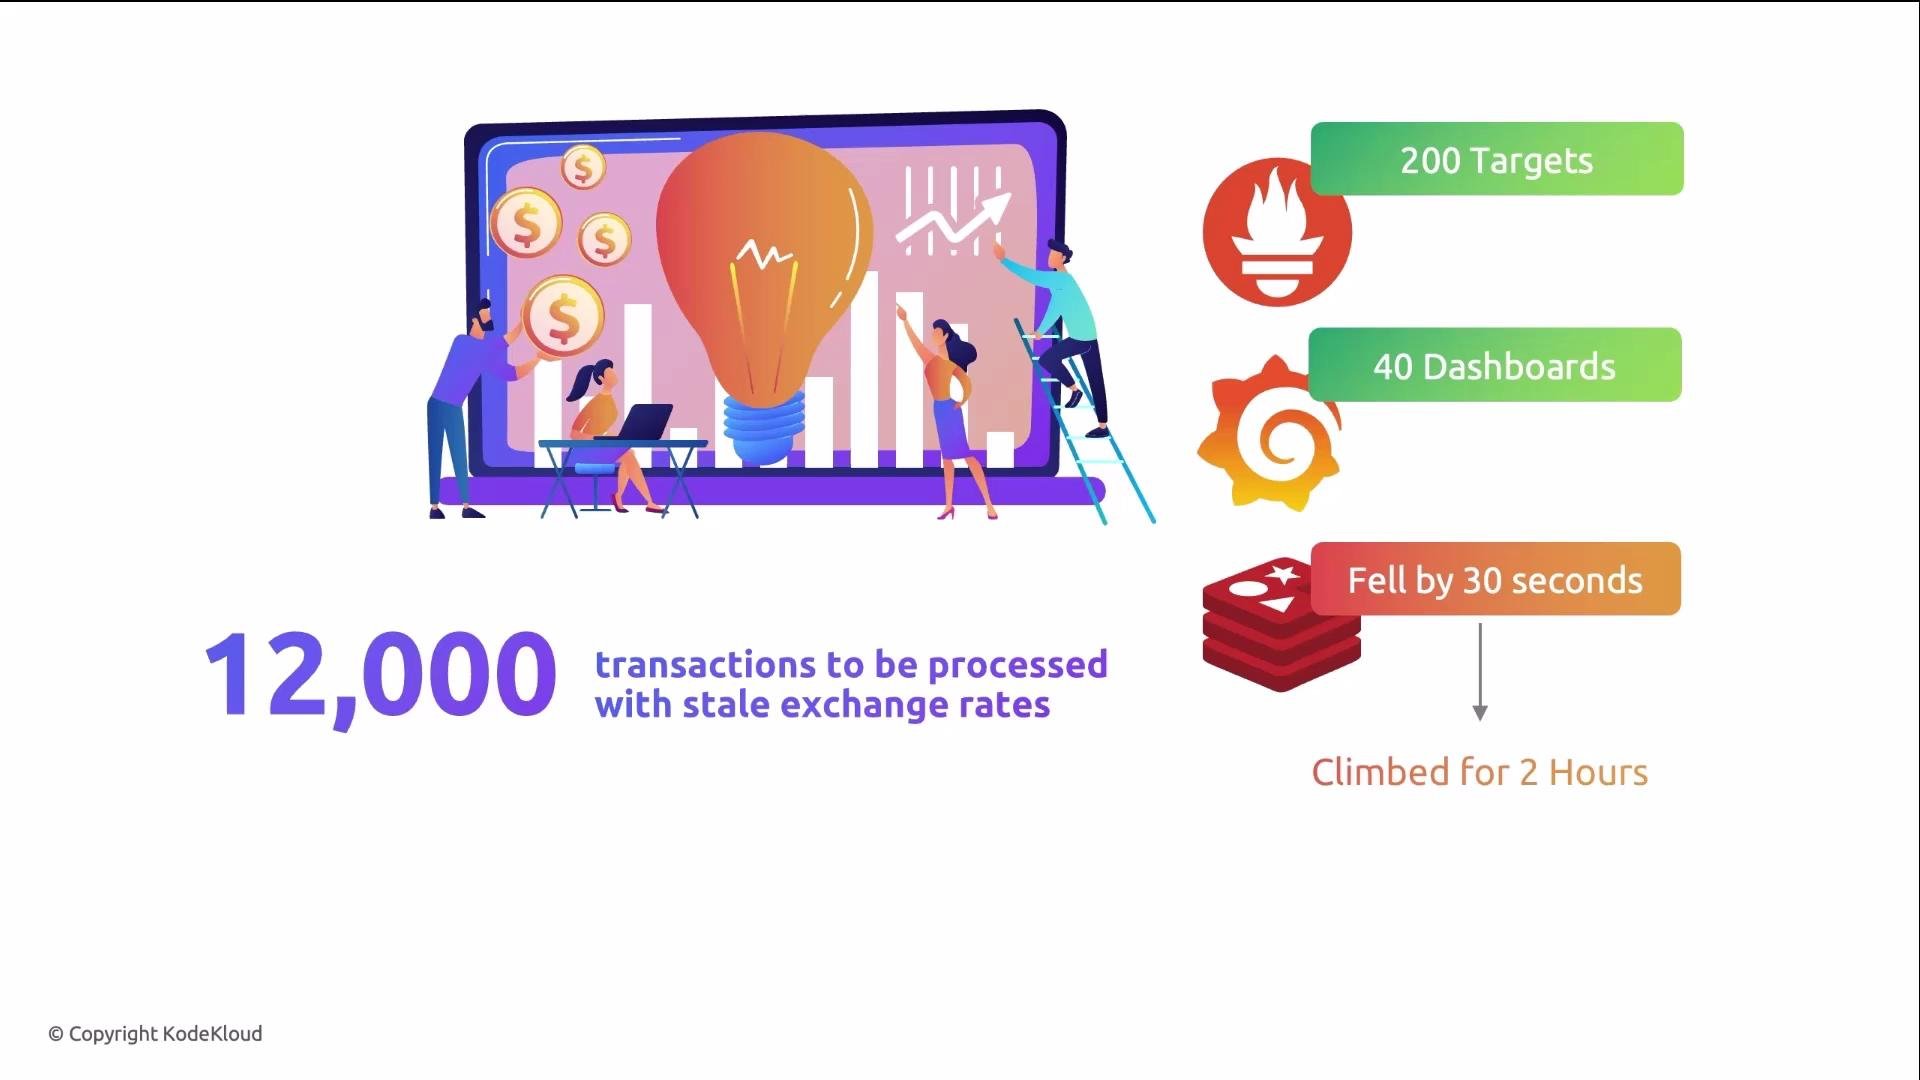
Consider this real-world scenario: a fintech startup runs Prometheus against 200 targets and maintains 40+ Grafana dashboards. Over the weekend, Redis replication lag crept to two hours. The metric already existed, but no alert rule was defined. By Monday, 12,000 transactions used stale exchange rates and significant money was lost.
A short, well-placed alerting rule (often just a few lines) would have detected the problem within minutes and prevented the damage.
Problem statement: dashboards are not alerts
Consider this real-world scenario: a fintech startup runs Prometheus against 200 targets and maintains 40+ Grafana dashboards. Over the weekend, Redis replication lag crept to two hours. The metric already existed, but no alert rule was defined. By Monday, 12,000 transactions used stale exchange rates and significant money was lost.
A short, well-placed alerting rule (often just a few lines) would have detected the problem within minutes and prevented the damage.
 Why automated alerting?
* Prometheus periodically evaluates PromQL expressions (for example, every 15s, depending on your `evaluation_interval`).
* Alerting should be automatic: it removes reliance on someone visually monitoring dashboards.
* Alertmanager performs grouping, deduplication, inhibition, and routing so the right people get paged while others receive lower-priority notifications.
Metrics without alerting are like a smoke detector without a bell.
Two-component alerting model
The alerting stack is intentionally split into two parts:
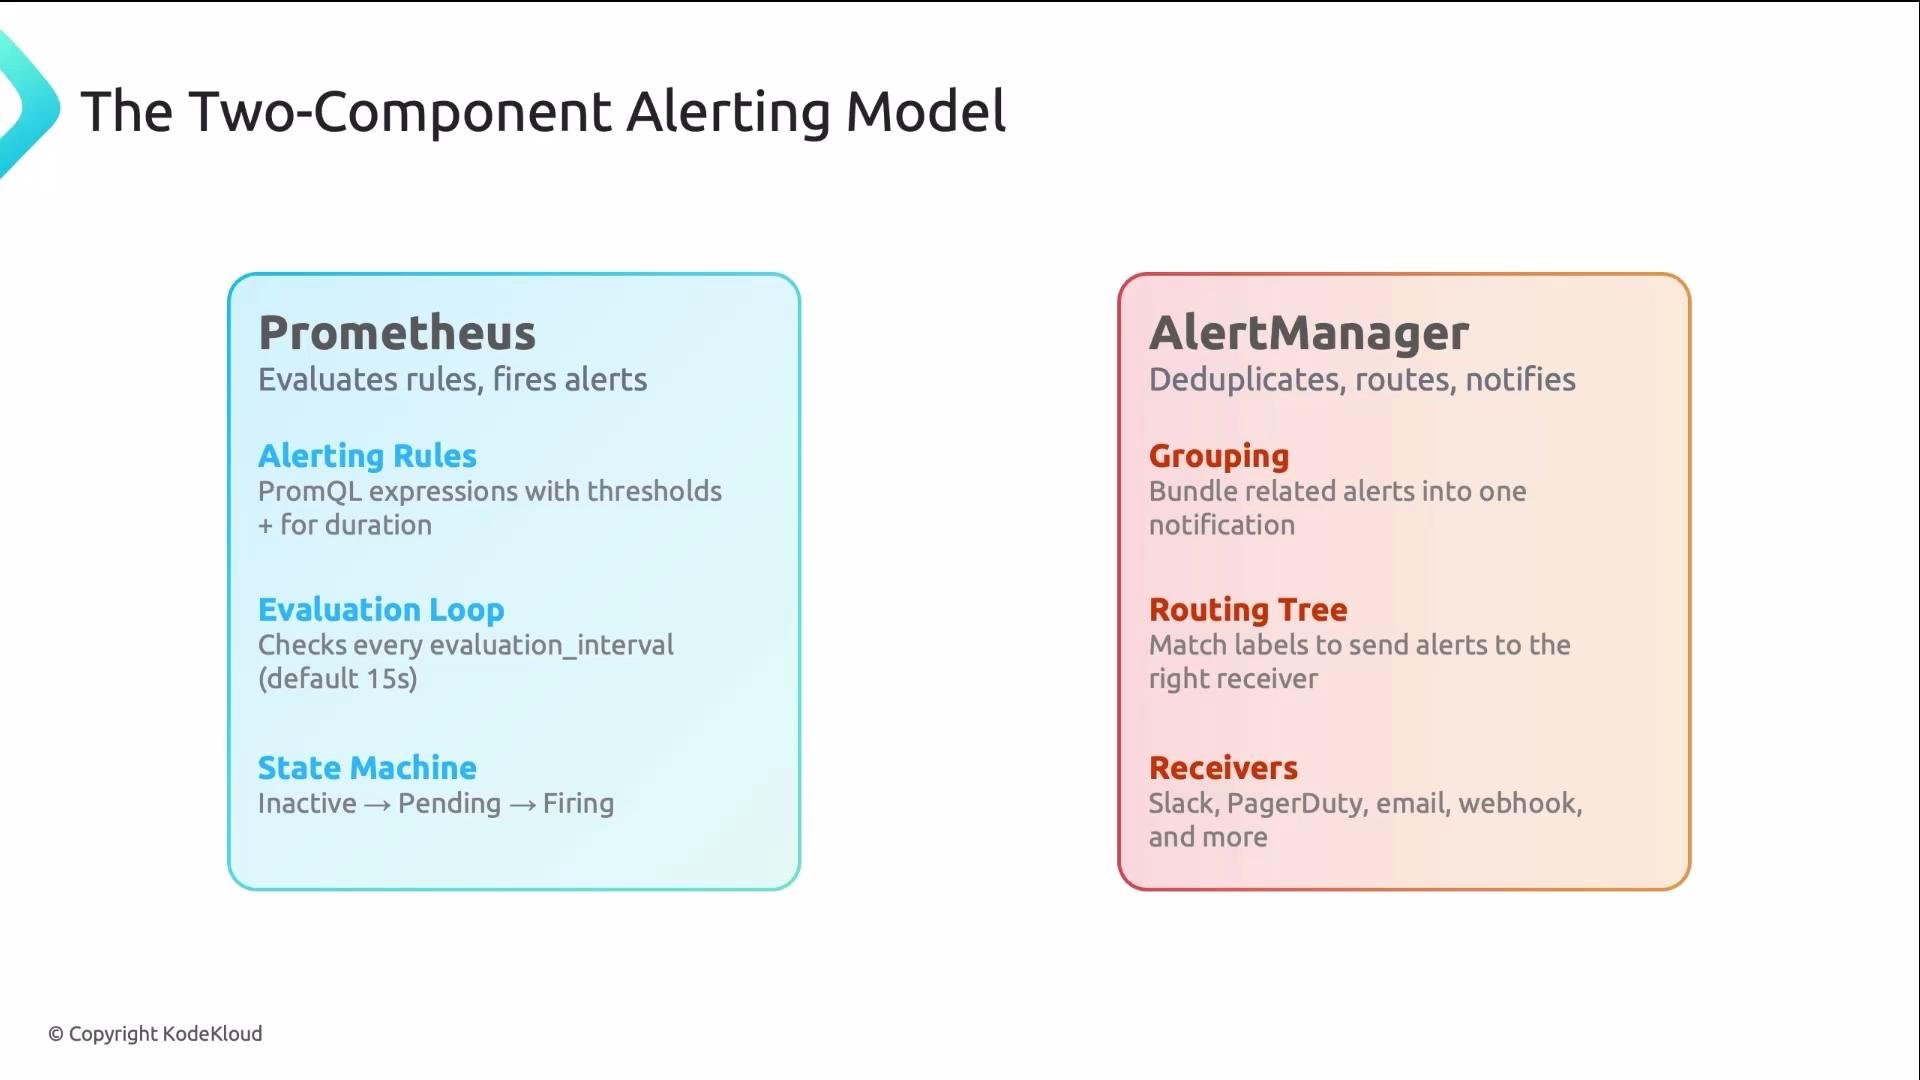
* Prometheus: evaluates alerting rules and decides when an alert should fire.
* Alertmanager: receives firing alerts, deduplicates/group them, applies inhibition rules, and sends notifications to receivers (Slack, PagerDuty, email, etc.).
Prometheus is responsible for "when" an alert fires; Alertmanager is responsible for "who" and "how" they are notified.
Why automated alerting?
* Prometheus periodically evaluates PromQL expressions (for example, every 15s, depending on your `evaluation_interval`).
* Alerting should be automatic: it removes reliance on someone visually monitoring dashboards.
* Alertmanager performs grouping, deduplication, inhibition, and routing so the right people get paged while others receive lower-priority notifications.
Metrics without alerting are like a smoke detector without a bell.
Two-component alerting model
The alerting stack is intentionally split into two parts:
* Prometheus: evaluates alerting rules and decides when an alert should fire.
* Alertmanager: receives firing alerts, deduplicates/group them, applies inhibition rules, and sends notifications to receivers (Slack, PagerDuty, email, etc.).
Prometheus is responsible for "when" an alert fires; Alertmanager is responsible for "who" and "how" they are notified.
 Alerting rules — anatomy and example
An alert rule contains a few essential fields:
* `alert`: logical name for the alert (used in routing and grouping).
* `expr`: PromQL expression that evaluates to true/false or returns series.
* `for`: debounce duration — how long the condition must hold before transitioning from `pending` to `firing`.
* `labels`: routing and metadata (e.g., `severity`, `team`).
* `annotations`: human-readable context such as `summary`, `description`, and `runbook_url`.
Canonical example:
```yaml theme={null}
groups:
- name: platform-alerts
rules:
- alert: HighErrorRate
expr: |
rate(http_requests_total{code=~"5.."}[5m]) > 1
for: 5m
labels:
severity: critical
annotations:
summary: "High 5xx rate"
description: "Cluster-wide 5xx error rate is above 1 req/s for 5 minutes."
runbook_url: "https://runbooks.example.com/high-5xx-rate"
```
Quick reference table for rule fields
| Field | Purpose | Example |
| ------------- | ----------------------------------------------- | ---------------------------- |
| `alert` | Logical identifier used by Alertmanager and UIs | `HighErrorRate` |
| `expr` | PromQL expression that triggers the rule | See code block above |
| `for` | Debounce window to avoid transient spikes | `5m` |
| `labels` | Used for routing and filtering in Alertmanager | `severity: critical` |
| `annotations` | Human-readable context and runbook links | `runbook_url: "https://..."` |
Choose `for` to filter transient spikes without delaying legitimate incidents. Typical ranges are 2–10 minutes depending on metric volatility and operational tolerance.
Prometheus alert states
Prometheus manages three states for each alert rule instance:
* `inactive`: the expression currently evaluates to false.
* `pending`: the expression is true but the `for` duration has not elapsed; no notification yet.
* `firing`: the condition held for the `for` period; Prometheus sends the alert to Alertmanager.
Alertmanager: routing, grouping, and delivery
Alertmanager receives firing alerts and handles the rest: grouping, deduplication, inhibition, and delivery to configured receivers. Routing is evaluated as a first-match tree — order matters.
Example Alertmanager configuration:
```yaml theme={null}
route:
receiver: default-slack
group_by: [alertname, namespace]
group_wait: 30s
group_interval: 5m
repeat_interval: 3h
routes:
- match:
severity: critical
receiver: pagerduty-oncall
- match:
team: payments
receiver: payments-slack
receivers:
- name: default-slack
slack_configs:
- channel: "#alerts"
- name: pagerduty-oncall
pagerduty_configs:
- service_key: ""
- name: payments-slack
slack_configs:
- channel: "#payments"
```
Alertmanager routing fields explained
| Field | Meaning |
| ----------------- | ------------------------------------------------------------------------------------------------------------------------------------------------------------- |
| `receiver` | Default fallback receiver when no child route matches |
| `group_by` | Labels used to bundle alerts into single notifications (e.g., `alertname`, `namespace`) — use backticked lists in configs: `group_by: [alertname, namespace]` |
| `group_wait` | Delay before sending the first notification for a group (typical: `30s`) |
| `group_interval` | Minimum time between notifications for the same group (typical: `5m`) |
| `repeat_interval` | How often to repeat unresolved alerts (e.g., `3h`) |
| `routes` | Child routes evaluated top-to-bottom; the first matching child is used |
Alertmanager routing is first-match. Place your most critical or specific routes near the top. If a single alert matches multiple child routes, only the first match applies.
Techniques to avoid alert fatigue
If alerts become noise, teams learn to ignore them. Use these controls to keep signal high and noise low:
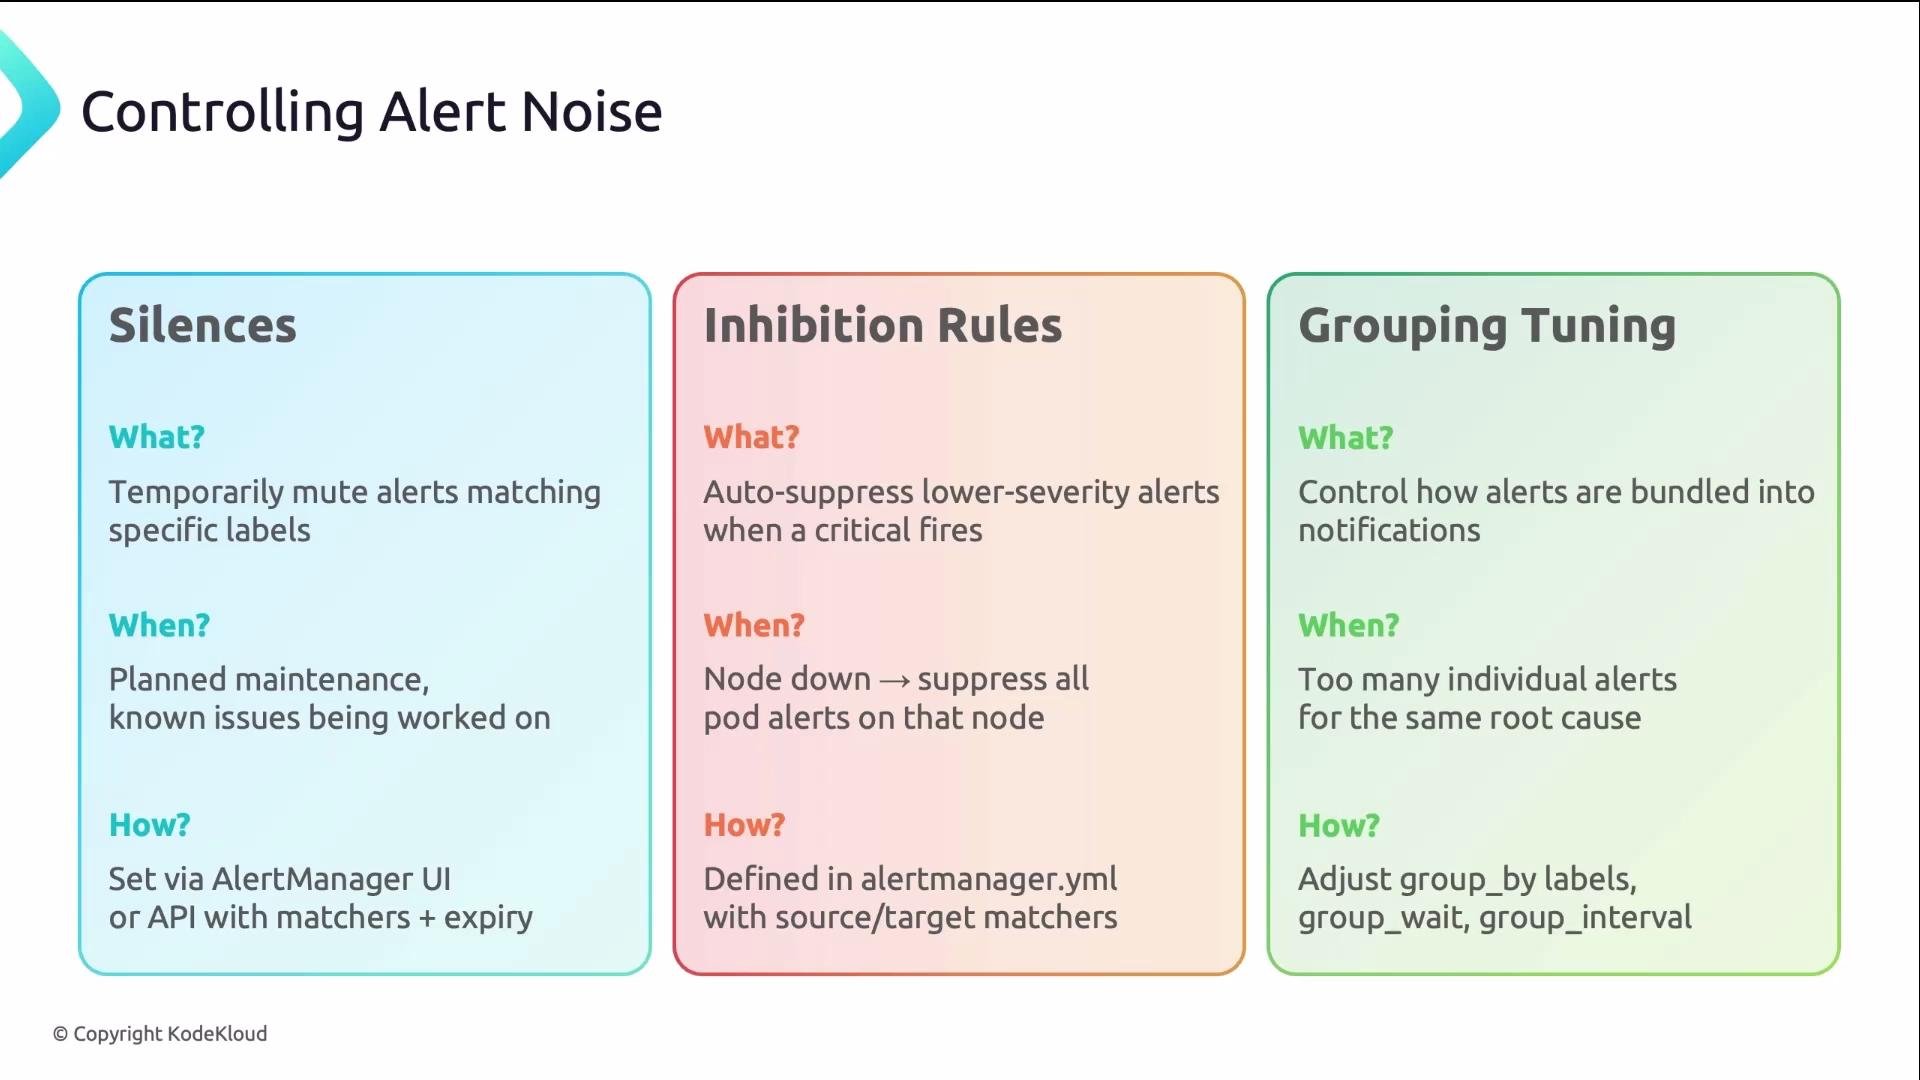
* Silences: temporary, manual mutes for expected noisy events (maintenance windows). Create via the Alertmanager UI or API.
* Inhibition rules: automatically suppress lower-priority alerts when a higher-priority alert is firing (e.g., inhibit pod alerts when node-level `NodeDown` is firing).
* Group tuning: control which labels are used in `group_by`. Group broadly (`alertname`) to reduce messages, or add `namespace`/`instance` for finer granularity.
* Rate limits & repeat tuning: use `group_interval` and `repeat_interval` to reduce frequent repeats.
* Review rules periodically: remove stale rules and tune noisy rules; schedule quarterly reviews.
Alerting rules — anatomy and example
An alert rule contains a few essential fields:
* `alert`: logical name for the alert (used in routing and grouping).
* `expr`: PromQL expression that evaluates to true/false or returns series.
* `for`: debounce duration — how long the condition must hold before transitioning from `pending` to `firing`.
* `labels`: routing and metadata (e.g., `severity`, `team`).
* `annotations`: human-readable context such as `summary`, `description`, and `runbook_url`.
Canonical example:
```yaml theme={null}
groups:
- name: platform-alerts
rules:
- alert: HighErrorRate
expr: |
rate(http_requests_total{code=~"5.."}[5m]) > 1
for: 5m
labels:
severity: critical
annotations:
summary: "High 5xx rate"
description: "Cluster-wide 5xx error rate is above 1 req/s for 5 minutes."
runbook_url: "https://runbooks.example.com/high-5xx-rate"
```
Quick reference table for rule fields
| Field | Purpose | Example |
| ------------- | ----------------------------------------------- | ---------------------------- |
| `alert` | Logical identifier used by Alertmanager and UIs | `HighErrorRate` |
| `expr` | PromQL expression that triggers the rule | See code block above |
| `for` | Debounce window to avoid transient spikes | `5m` |
| `labels` | Used for routing and filtering in Alertmanager | `severity: critical` |
| `annotations` | Human-readable context and runbook links | `runbook_url: "https://..."` |
Choose `for` to filter transient spikes without delaying legitimate incidents. Typical ranges are 2–10 minutes depending on metric volatility and operational tolerance.
Prometheus alert states
Prometheus manages three states for each alert rule instance:
* `inactive`: the expression currently evaluates to false.
* `pending`: the expression is true but the `for` duration has not elapsed; no notification yet.
* `firing`: the condition held for the `for` period; Prometheus sends the alert to Alertmanager.
Alertmanager: routing, grouping, and delivery
Alertmanager receives firing alerts and handles the rest: grouping, deduplication, inhibition, and delivery to configured receivers. Routing is evaluated as a first-match tree — order matters.
Example Alertmanager configuration:
```yaml theme={null}
route:
receiver: default-slack
group_by: [alertname, namespace]
group_wait: 30s
group_interval: 5m
repeat_interval: 3h
routes:
- match:
severity: critical
receiver: pagerduty-oncall
- match:
team: payments
receiver: payments-slack
receivers:
- name: default-slack
slack_configs:
- channel: "#alerts"
- name: pagerduty-oncall
pagerduty_configs:
- service_key: ""
- name: payments-slack
slack_configs:
- channel: "#payments"
```
Alertmanager routing fields explained
| Field | Meaning |
| ----------------- | ------------------------------------------------------------------------------------------------------------------------------------------------------------- |
| `receiver` | Default fallback receiver when no child route matches |
| `group_by` | Labels used to bundle alerts into single notifications (e.g., `alertname`, `namespace`) — use backticked lists in configs: `group_by: [alertname, namespace]` |
| `group_wait` | Delay before sending the first notification for a group (typical: `30s`) |
| `group_interval` | Minimum time between notifications for the same group (typical: `5m`) |
| `repeat_interval` | How often to repeat unresolved alerts (e.g., `3h`) |
| `routes` | Child routes evaluated top-to-bottom; the first matching child is used |
Alertmanager routing is first-match. Place your most critical or specific routes near the top. If a single alert matches multiple child routes, only the first match applies.
Techniques to avoid alert fatigue
If alerts become noise, teams learn to ignore them. Use these controls to keep signal high and noise low:
* Silences: temporary, manual mutes for expected noisy events (maintenance windows). Create via the Alertmanager UI or API.
* Inhibition rules: automatically suppress lower-priority alerts when a higher-priority alert is firing (e.g., inhibit pod alerts when node-level `NodeDown` is firing).
* Group tuning: control which labels are used in `group_by`. Group broadly (`alertname`) to reduce messages, or add `namespace`/`instance` for finer granularity.
* Rate limits & repeat tuning: use `group_interval` and `repeat_interval` to reduce frequent repeats.
* Review rules periodically: remove stale rules and tune noisy rules; schedule quarterly reviews.
 Alert lifecycle — end to end
Follow an alert from evaluation to resolution:
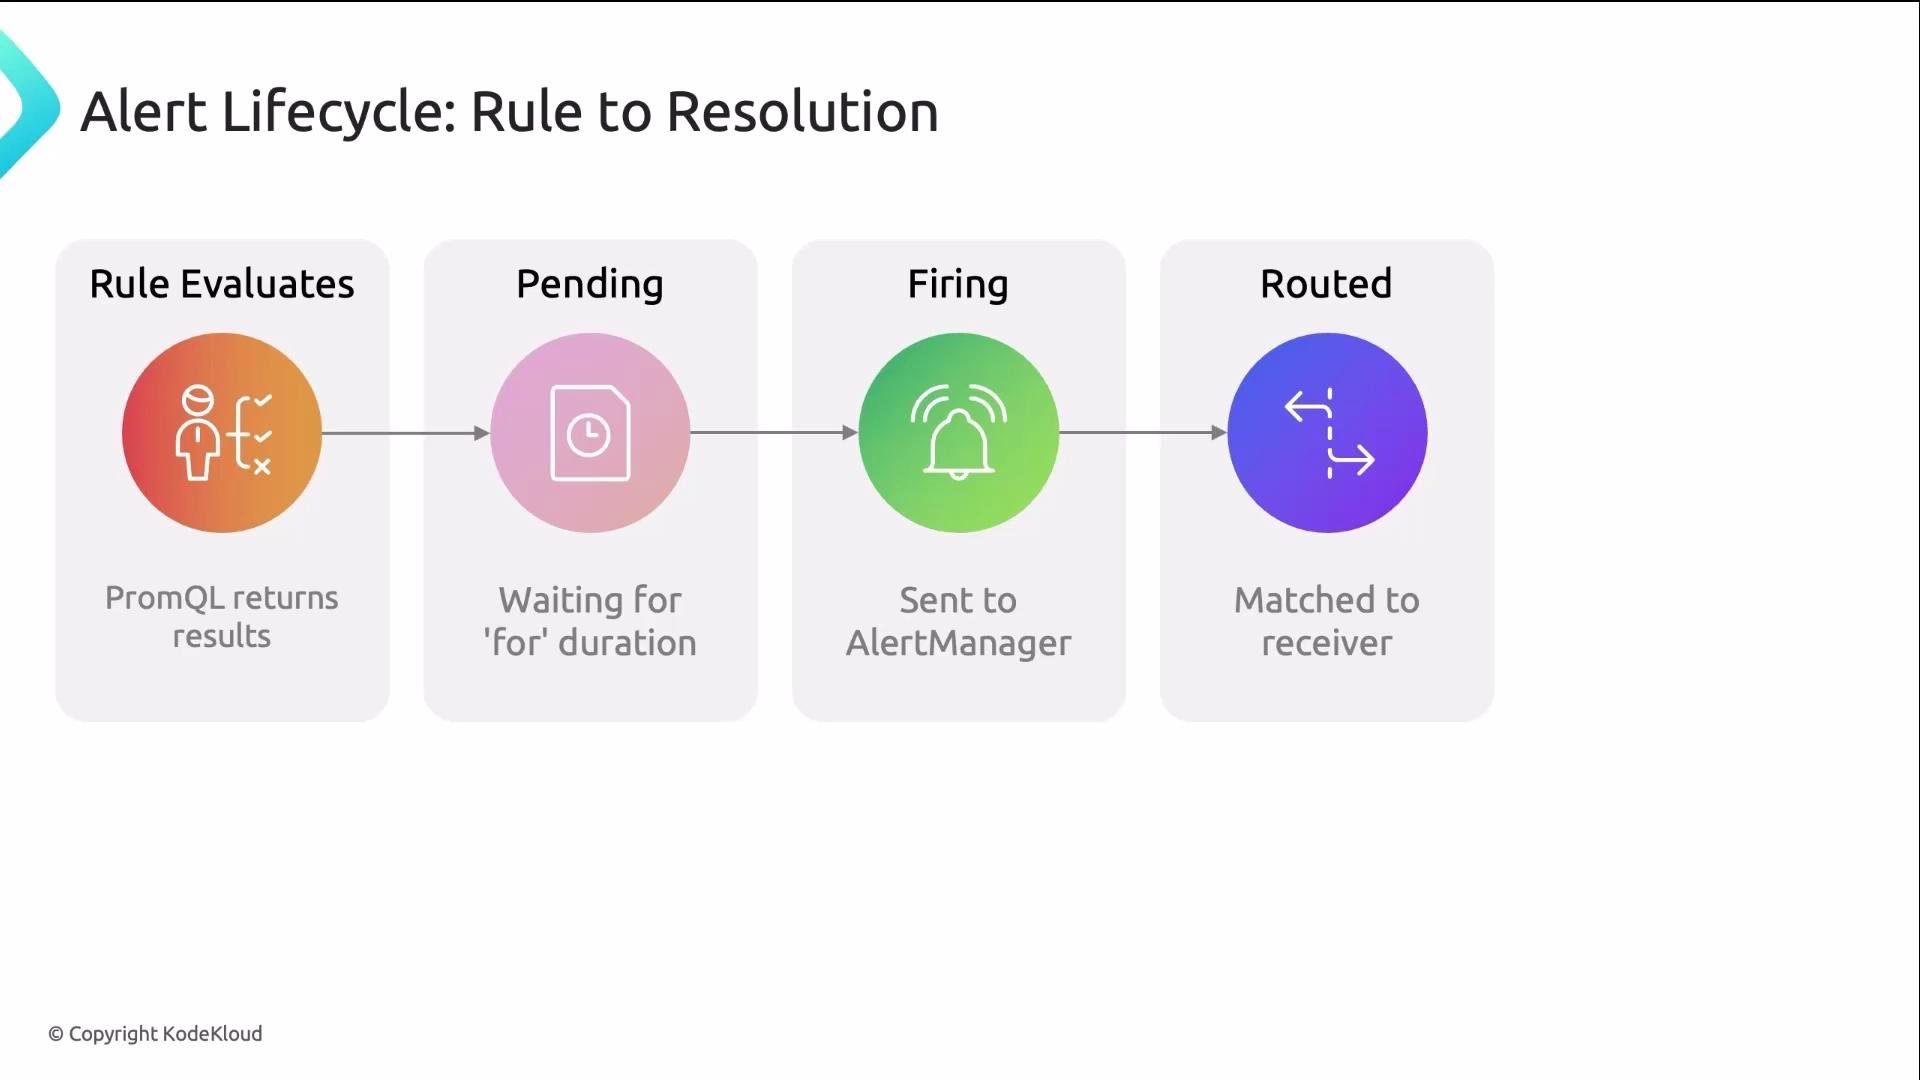
1. Prometheus evaluates the alerting rule (PromQL returns series).
2. If the expression is true but the `for` window hasn't elapsed, the alert goes to `pending`. If it resolves during this time, no notification is sent.
3. If the condition persists for the `for` duration, the alert transitions to `firing`. Prometheus pushes the firing alert to Alertmanager.
4. Alertmanager groups incoming alerts per `group_by`, applies inhibition/deduplication rules, and matches routing rules to select receivers.
5. Receivers (PagerDuty, Slack, email) get the notification. When Prometheus reports the alert resolved, Alertmanager sends a resolved/update notification.
Alert lifecycle — end to end
Follow an alert from evaluation to resolution:
1. Prometheus evaluates the alerting rule (PromQL returns series).
2. If the expression is true but the `for` window hasn't elapsed, the alert goes to `pending`. If it resolves during this time, no notification is sent.
3. If the condition persists for the `for` duration, the alert transitions to `firing`. Prometheus pushes the firing alert to Alertmanager.
4. Alertmanager groups incoming alerts per `group_by`, applies inhibition/deduplication rules, and matches routing rules to select receivers.
5. Receivers (PagerDuty, Slack, email) get the notification. When Prometheus reports the alert resolved, Alertmanager sends a resolved/update notification.
 Best practices checklist
* Alert on user-facing symptoms (latency, error rate), not only on low-level causes (CPU, disk). Symptoms directly correlate to customer impact.
* Add `runbook_url` and clear `annotations` so on-call engineers can act quickly.
* Use `for` windows in the 2–10 minute range depending on metric noise and business risk.
* Place critical routes first in Alertmanager to ensure correct delivery.
* Group alerts thoughtfully: too coarse → insufficient detail; too fine → too many notifications.
* Regularly review alert rule effectiveness and prune or fix rules that never fire or always fire.
Recap — what you should remember
* Prometheus evaluates rules and decides when alerts should fire.
* Alertmanager deduplicates, groups, inhibits, routes, and delivers notifications.
* Alerts include `expr`, `for`, `labels`, and `annotations`.
* Alertmanager routing is first-match; ordering and grouping choices are significant.
* Use silences, inhibition rules, and careful grouping to manage noise and preserve on-call trust.
Further reading and references
* Prometheus docs: [https://prometheus.io/docs/](https://prometheus.io/docs/)
* Alertmanager docs: [https://prometheus.io/docs/alerting/latest/alertmanager/](https://prometheus.io/docs/alerting/latest/alertmanager/)
* PromQL reference: [https://prometheus.io/docs/prometheus/latest/querying/basics/](https://prometheus.io/docs/prometheus/latest/querying/basics/)
* Best practices for alerting (PagerDuty): [https://www.pagerduty.com/blog/alerting-best-practices/](https://www.pagerduty.com/blog/alerting-best-practices/)
This lesson covered the end-to-end alerting flow and practical guidance for implementing reliable, actionable alerts.
Best practices checklist
* Alert on user-facing symptoms (latency, error rate), not only on low-level causes (CPU, disk). Symptoms directly correlate to customer impact.
* Add `runbook_url` and clear `annotations` so on-call engineers can act quickly.
* Use `for` windows in the 2–10 minute range depending on metric noise and business risk.
* Place critical routes first in Alertmanager to ensure correct delivery.
* Group alerts thoughtfully: too coarse → insufficient detail; too fine → too many notifications.
* Regularly review alert rule effectiveness and prune or fix rules that never fire or always fire.
Recap — what you should remember
* Prometheus evaluates rules and decides when alerts should fire.
* Alertmanager deduplicates, groups, inhibits, routes, and delivers notifications.
* Alerts include `expr`, `for`, `labels`, and `annotations`.
* Alertmanager routing is first-match; ordering and grouping choices are significant.
* Use silences, inhibition rules, and careful grouping to manage noise and preserve on-call trust.
Further reading and references
* Prometheus docs: [https://prometheus.io/docs/](https://prometheus.io/docs/)
* Alertmanager docs: [https://prometheus.io/docs/alerting/latest/alertmanager/](https://prometheus.io/docs/alerting/latest/alertmanager/)
* PromQL reference: [https://prometheus.io/docs/prometheus/latest/querying/basics/](https://prometheus.io/docs/prometheus/latest/querying/basics/)
* Best practices for alerting (PagerDuty): [https://www.pagerduty.com/blog/alerting-best-practices/](https://www.pagerduty.com/blog/alerting-best-practices/)
This lesson covered the end-to-end alerting flow and practical guidance for implementing reliable, actionable alerts.