> ## Documentation Index
> Fetch the complete documentation index at: https://notes.kodekloud.com/llms.txt
> Use this file to discover all available pages before exploring further.
# Trace Visualization and Root Cause Analysis
> Practical guide to using Jaeger traces and OpenTelemetry to read waterfalls, identify latency patterns, follow a triage workflow, inspect spans, and correlate traces with logs and metrics.
This lesson assumes you already understand traces, spans, OpenTelemetry, and Jaeger. Here we make those concepts practical: how to read a Jaeger waterfall, spot latency patterns, and follow a repeatable triage workflow that takes you from “something is slow” to “this is exactly why.”
 ## Core skill: reading the waterfall
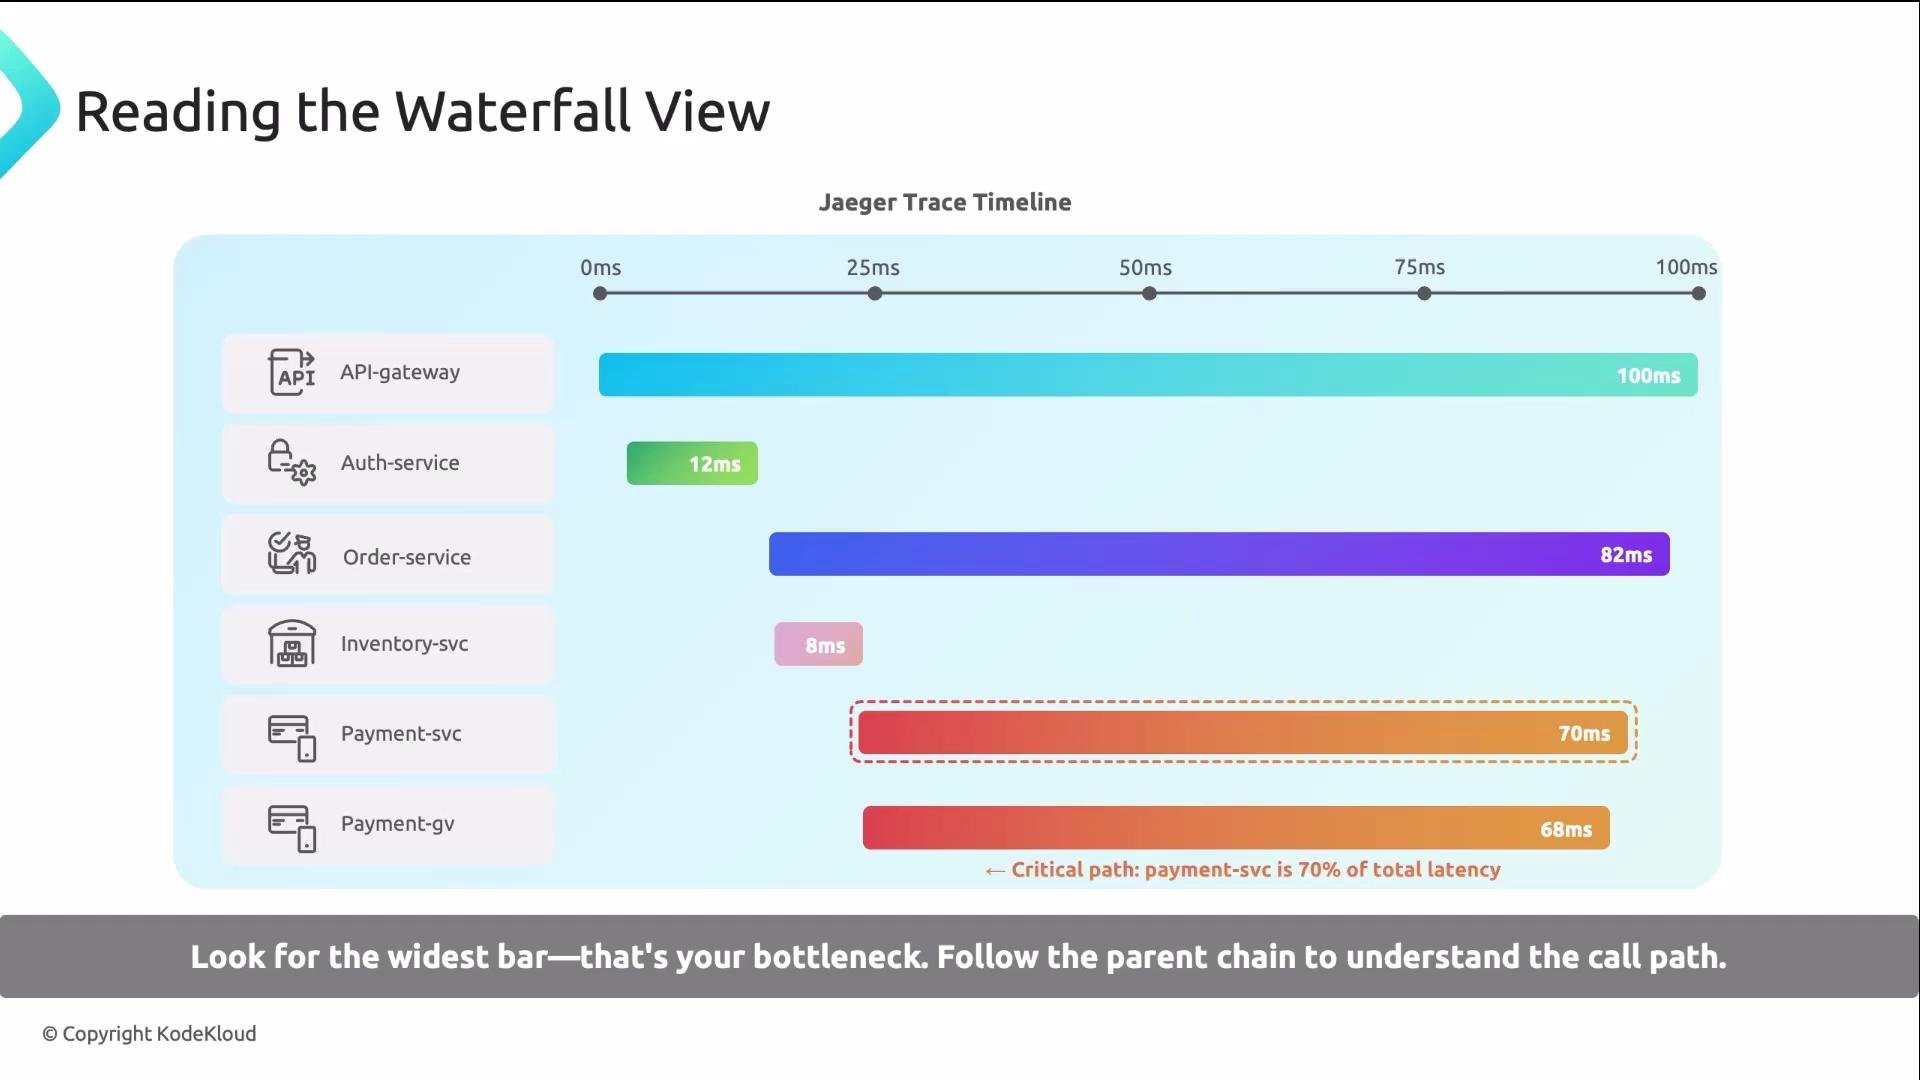
The waterfall (timeline) view is your primary diagnostic tool. Each row is a span; each bar shows when the operation started and how long it ran. Read it like this:
* Start at the root span (top).
* Find the widest child span — that’s the current critical path.
* Drill into that child and repeat until you find the operation that dominates latency.
Example: an API gateway span lasts 100 ms. Inside it, `auth-service` takes 12 ms while `order-service` takes 82 ms — clearly most time is spent in the order service.
## Core skill: reading the waterfall
The waterfall (timeline) view is your primary diagnostic tool. Each row is a span; each bar shows when the operation started and how long it ran. Read it like this:
* Start at the root span (top).
* Find the widest child span — that’s the current critical path.
* Drill into that child and repeat until you find the operation that dominates latency.
Example: an API gateway span lasts 100 ms. Inside it, `auth-service` takes 12 ms while `order-service` takes 82 ms — clearly most time is spent in the order service.
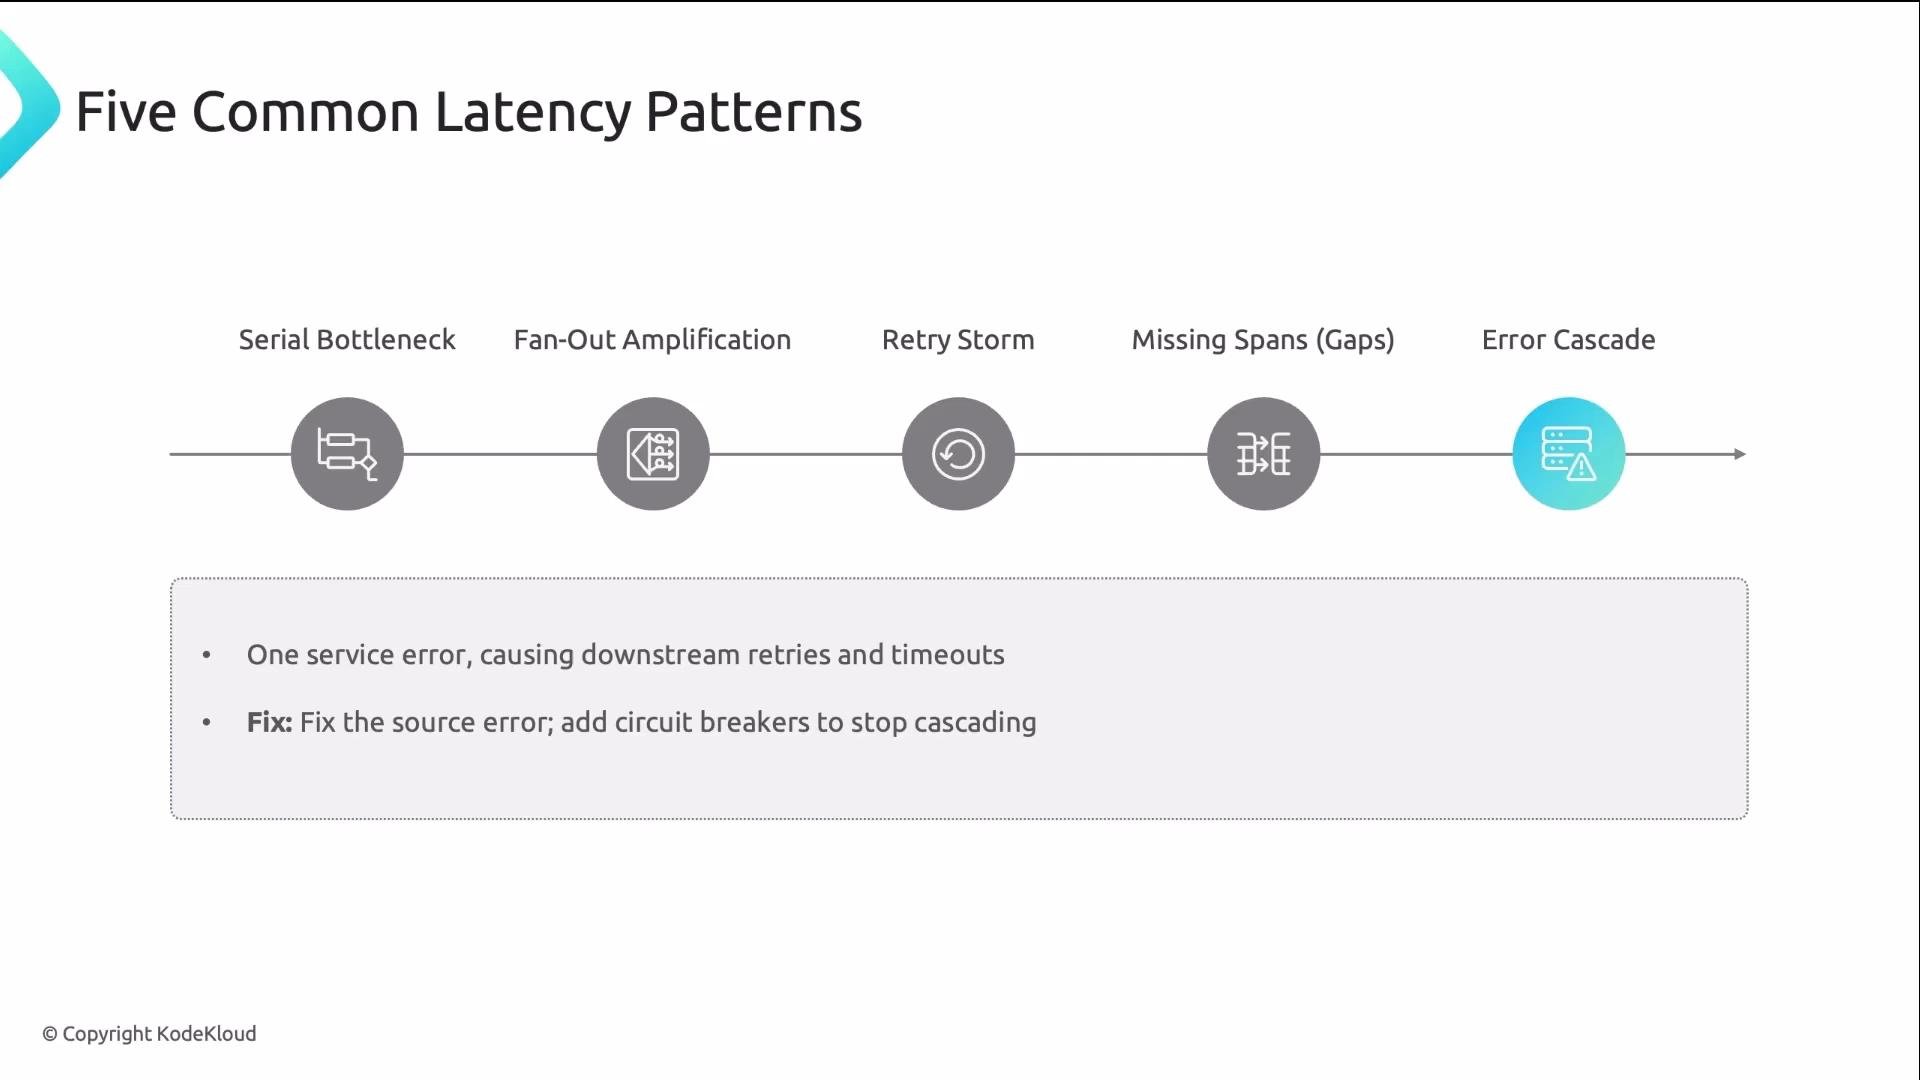
 ## Five common latency patterns
Most latency incidents fit into one of these patterns. Commit these to memory — they speed up triage.
| Pattern | Symptoms (what you see in the waterfall) | Typical fixes |
| --------------------- | ------------------------------------------------------------------------------------------- | -------------------------------------------------------------------------- |
| Serial bottleneck | One span dominates total request time (e.g., single DB query is 800 ms of a 900 ms request) | Cache results, optimize query, offload to async jobs |
| Fan-out amplification | A parent calls many children; total equals the slowest child | Add timeouts, degrade non-essential calls, use hedging or fallbacks |
| Retry storm | Repeated identical spans; retries add up to large total latency | Fix underlying failure, tune retry backoff/limits, add circuit breakers |
| Missing spans (gaps) | Parent duration > sum(child durations) — unexplained interval | Add instrumentation, capture queue/wait events, log connection/dns timings |
| Error cascade | Failures propagate and cause upstream retries or failures | Fix root cause, add timeouts/circuit breakers, graceful degradation |
After the next section on the first three patterns, see the illustrated example below.
1. Serial bottleneck\
One span dominates the timeline. Example: a DB call is 800 ms in a 900 ms request. Fixes: caching, asynchronous processing, or optimizing the slow operation.
2. Fan-out amplification\
A service issues many parallel calls. The slowest child determines total latency. Fixes: set timeouts, degrade functionality, add fallbacks.
3. Retry storm\
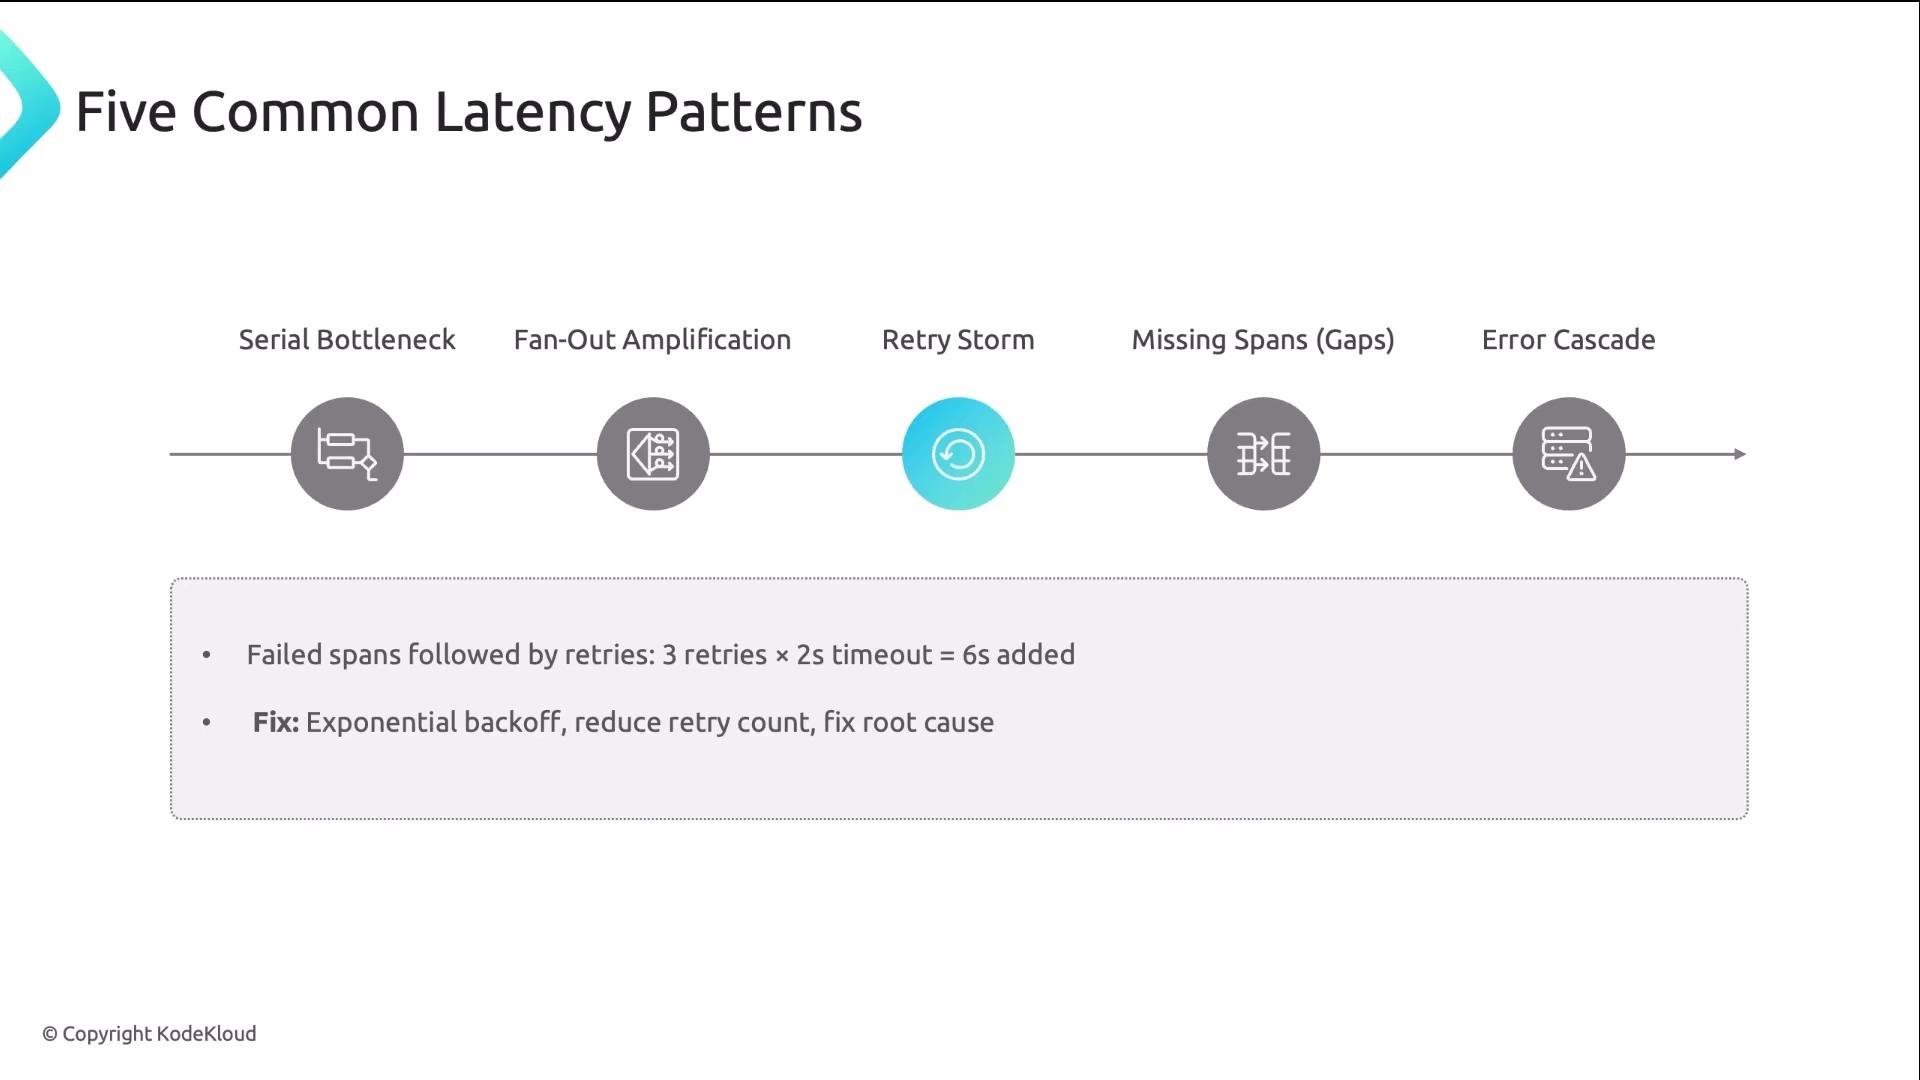
A failed call is retried multiple times. Each retry consumes its timeout — three retries with 2 s timeouts add 6 s to latency. Fixes: address the root failure, implement exponential backoff, limit retries, add circuit breakers.
## Five common latency patterns
Most latency incidents fit into one of these patterns. Commit these to memory — they speed up triage.
| Pattern | Symptoms (what you see in the waterfall) | Typical fixes |
| --------------------- | ------------------------------------------------------------------------------------------- | -------------------------------------------------------------------------- |
| Serial bottleneck | One span dominates total request time (e.g., single DB query is 800 ms of a 900 ms request) | Cache results, optimize query, offload to async jobs |
| Fan-out amplification | A parent calls many children; total equals the slowest child | Add timeouts, degrade non-essential calls, use hedging or fallbacks |
| Retry storm | Repeated identical spans; retries add up to large total latency | Fix underlying failure, tune retry backoff/limits, add circuit breakers |
| Missing spans (gaps) | Parent duration > sum(child durations) — unexplained interval | Add instrumentation, capture queue/wait events, log connection/dns timings |
| Error cascade | Failures propagate and cause upstream retries or failures | Fix root cause, add timeouts/circuit breakers, graceful degradation |
After the next section on the first three patterns, see the illustrated example below.
1. Serial bottleneck\
One span dominates the timeline. Example: a DB call is 800 ms in a 900 ms request. Fixes: caching, asynchronous processing, or optimizing the slow operation.
2. Fan-out amplification\
A service issues many parallel calls. The slowest child determines total latency. Fixes: set timeouts, degrade functionality, add fallbacks.
3. Retry storm\
A failed call is retried multiple times. Each retry consumes its timeout — three retries with 2 s timeouts add 6 s to latency. Fixes: address the root failure, implement exponential backoff, limit retries, add circuit breakers.
 4. Missing spans (gaps)\
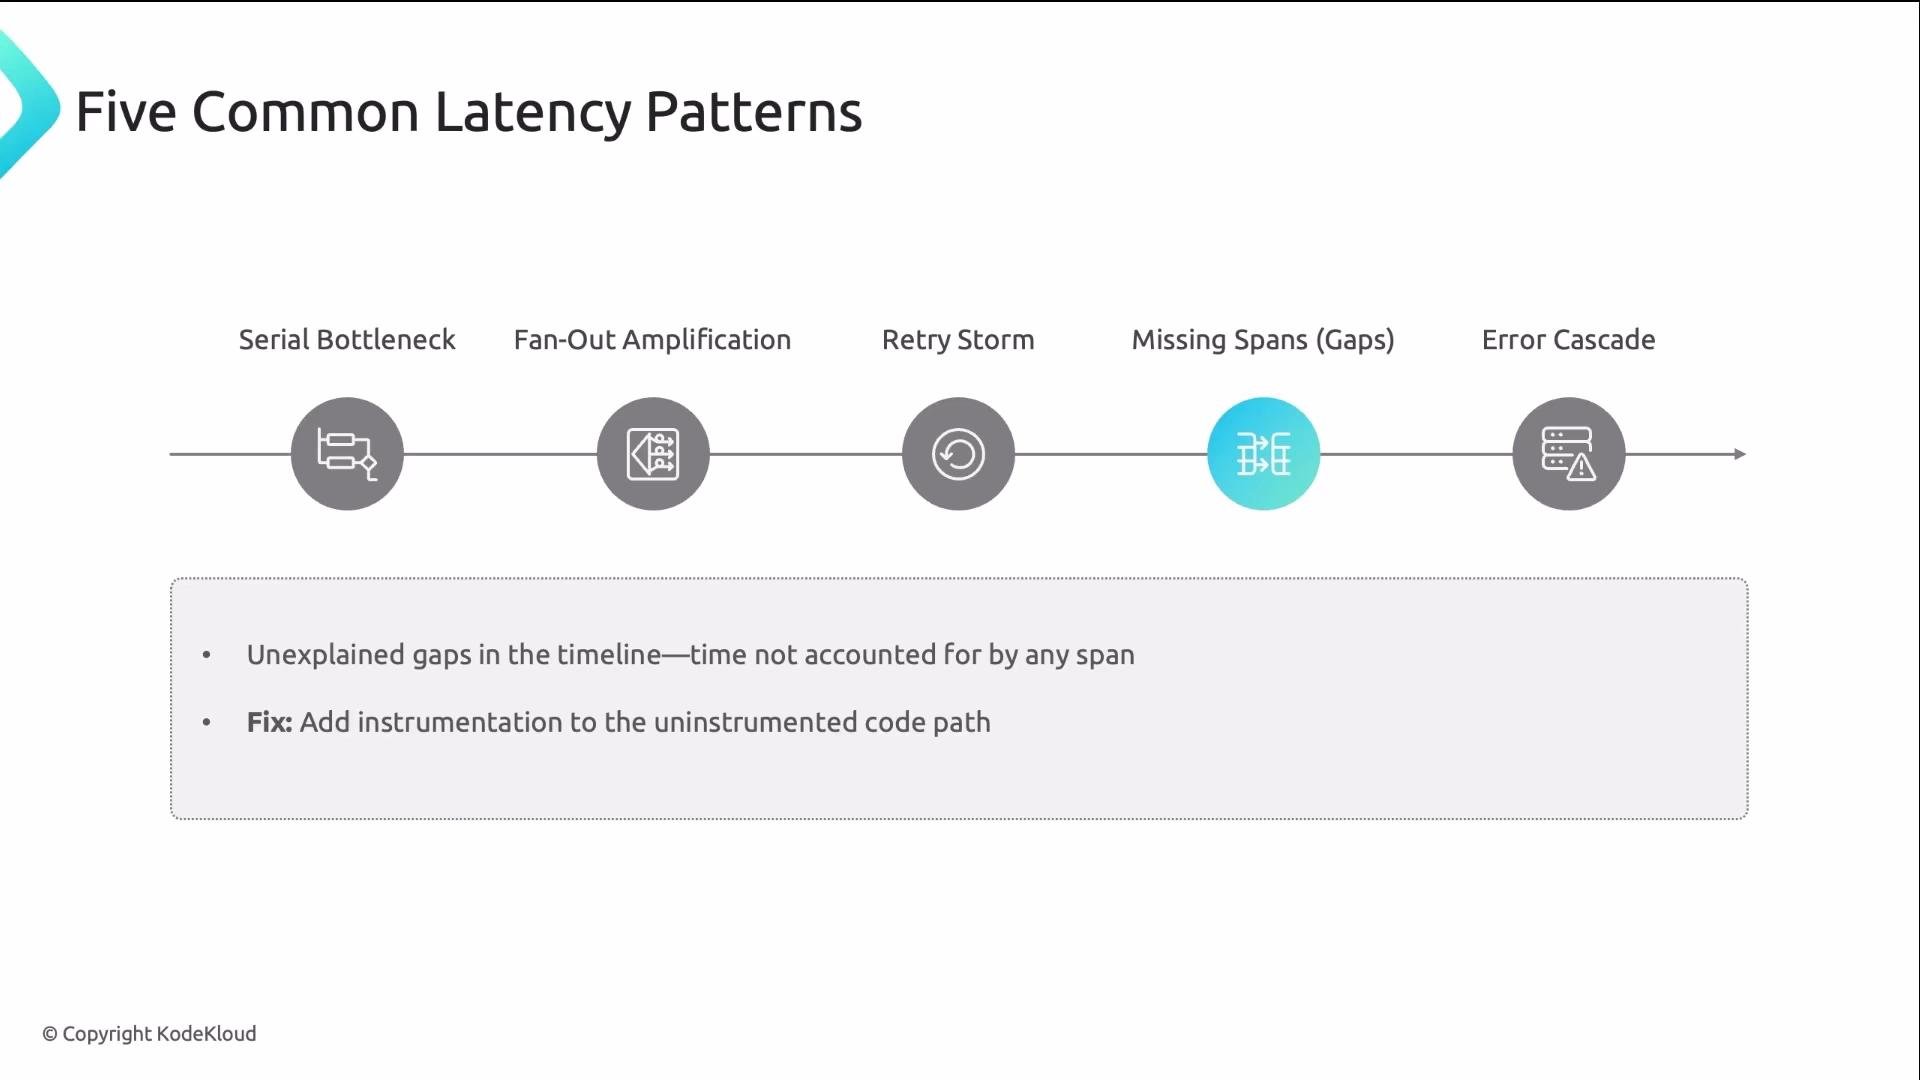
The parent span duration is longer than the sum of child spans. Example: parent shows 500 ms but children add to 200 ms — the remaining 300 ms is usually uninstrumented work (queue wait, DNS lookup, connection pool wait). Fix: add instrumentation or capture timing for the missing operations.
4. Missing spans (gaps)\
The parent span duration is longer than the sum of child spans. Example: parent shows 500 ms but children add to 200 ms — the remaining 300 ms is usually uninstrumented work (queue wait, DNS lookup, connection pool wait). Fix: add instrumentation or capture timing for the missing operations.
 5. Error cascade\
One service fails, its caller retries, and upstream callers retry — a tree of failures. Fix the root error and add circuit breakers, timeouts, and graceful degradation to stop the cascade.
5. Error cascade\
One service fails, its caller retries, and upstream callers retry — a tree of failures. Fix the root error and add circuit breakers, timeouts, and graceful degradation to stop the cascade.
 ## A systematic triage workflow
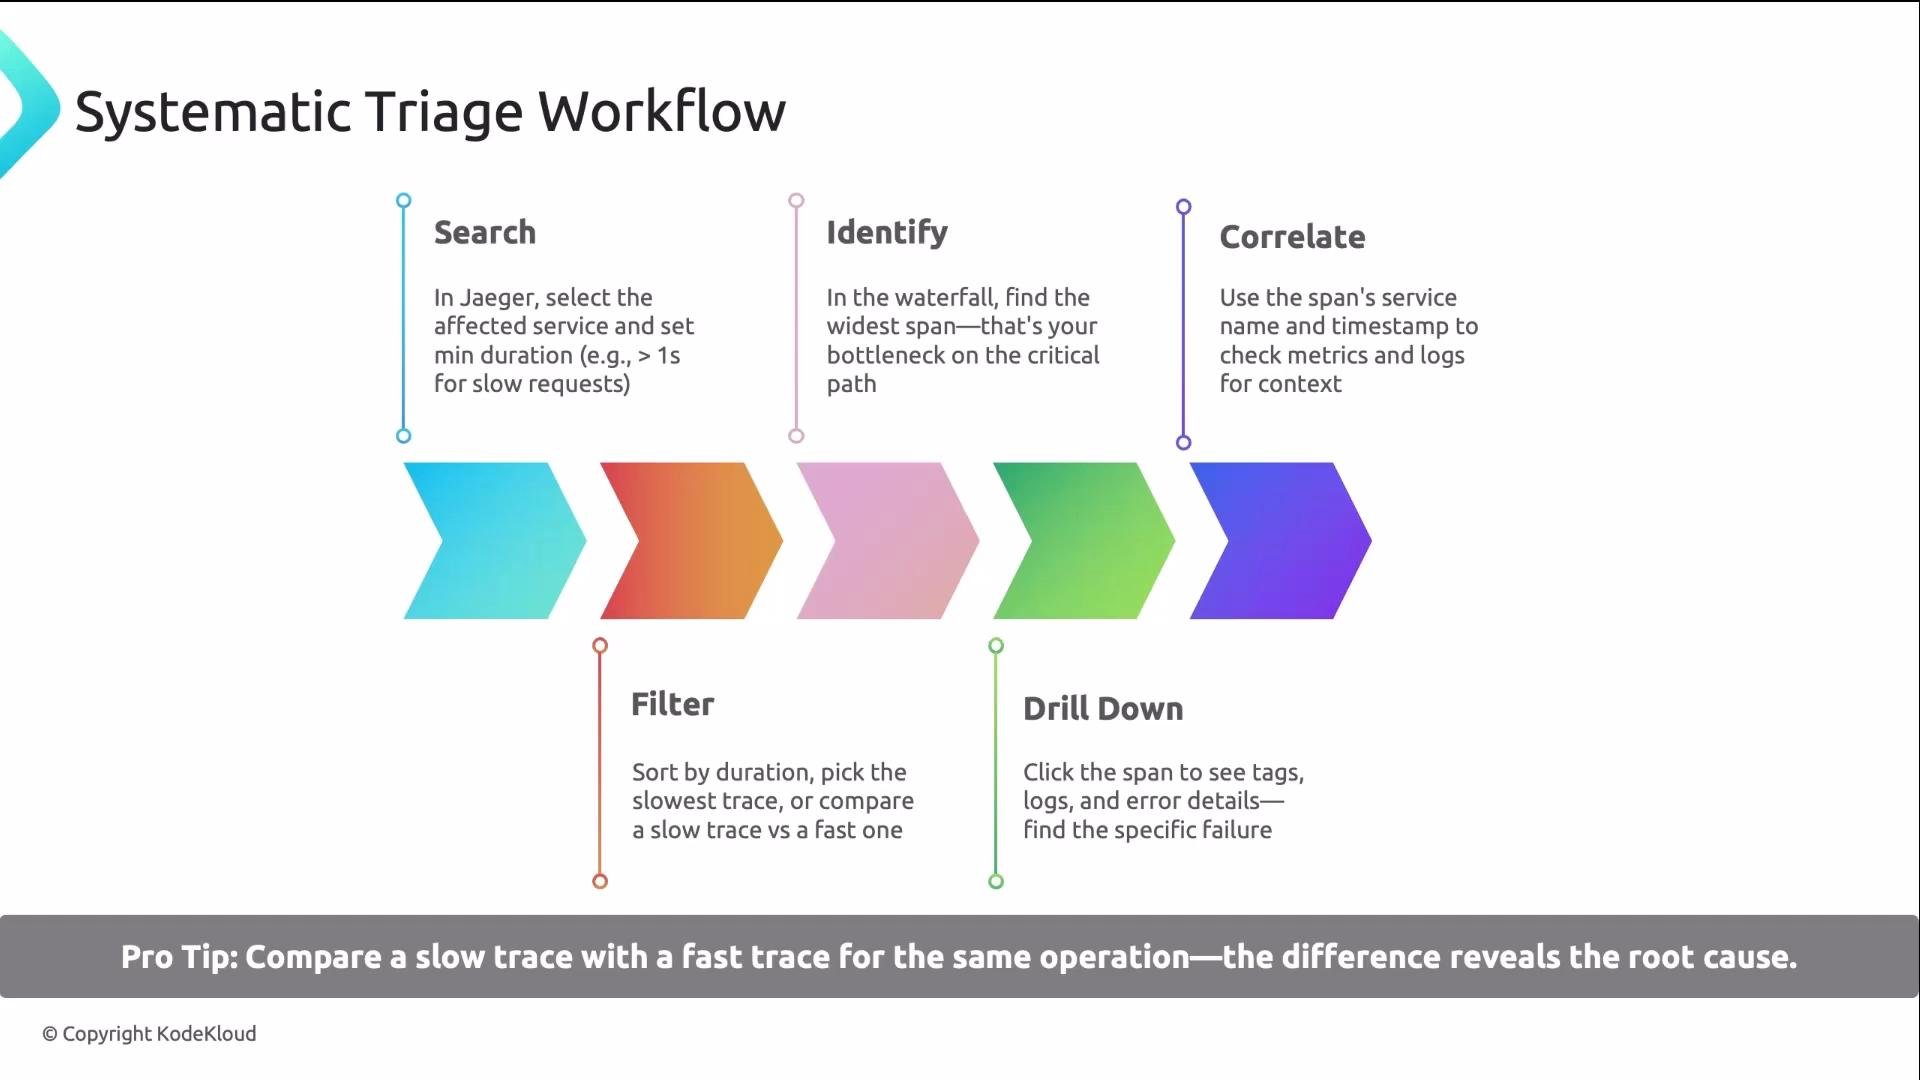
Use a repeatable process rather than guessing. This workflow takes you from a symptom to a concrete root cause.
1. Search and filter
* Open Jaeger, select the relevant service and operation.
* Set a minimum duration filter so you only see slow traces (e.g., `> 1s`).
* Use tags to narrow results, for example: `http.status_code = 500`.
2. Sort and pick
* Sort traces by duration and pick the slowest trace.
* When possible, find a corresponding fast trace for the same operation and compare them.
3. Identify and drill down
* In the waterfall, find the widest span and click it.
* Inspect the span’s tags, logs/events, and process info.
* Follow the critical path: at each level, pick the widest child.
4. Correlate with metrics and logs
* Use the service name, pod/host, and timestamp from the span to search metrics (Prometheus/Grafana) and logs (ELK/Loki) for that instance.
* Look for CPU, memory, thread/connection pool saturation, GC pauses, or network errors at the same timestamp.
Pro tip: always compare a slow and a fast trace of the same operation — the delta usually points to the root cause.
## A systematic triage workflow
Use a repeatable process rather than guessing. This workflow takes you from a symptom to a concrete root cause.
1. Search and filter
* Open Jaeger, select the relevant service and operation.
* Set a minimum duration filter so you only see slow traces (e.g., `> 1s`).
* Use tags to narrow results, for example: `http.status_code = 500`.
2. Sort and pick
* Sort traces by duration and pick the slowest trace.
* When possible, find a corresponding fast trace for the same operation and compare them.
3. Identify and drill down
* In the waterfall, find the widest span and click it.
* Inspect the span’s tags, logs/events, and process info.
* Follow the critical path: at each level, pick the widest child.
4. Correlate with metrics and logs
* Use the service name, pod/host, and timestamp from the span to search metrics (Prometheus/Grafana) and logs (ELK/Loki) for that instance.
* Look for CPU, memory, thread/connection pool saturation, GC pauses, or network errors at the same timestamp.
Pro tip: always compare a slow and a fast trace of the same operation — the delta usually points to the root cause.
 ## Span details: what to look for
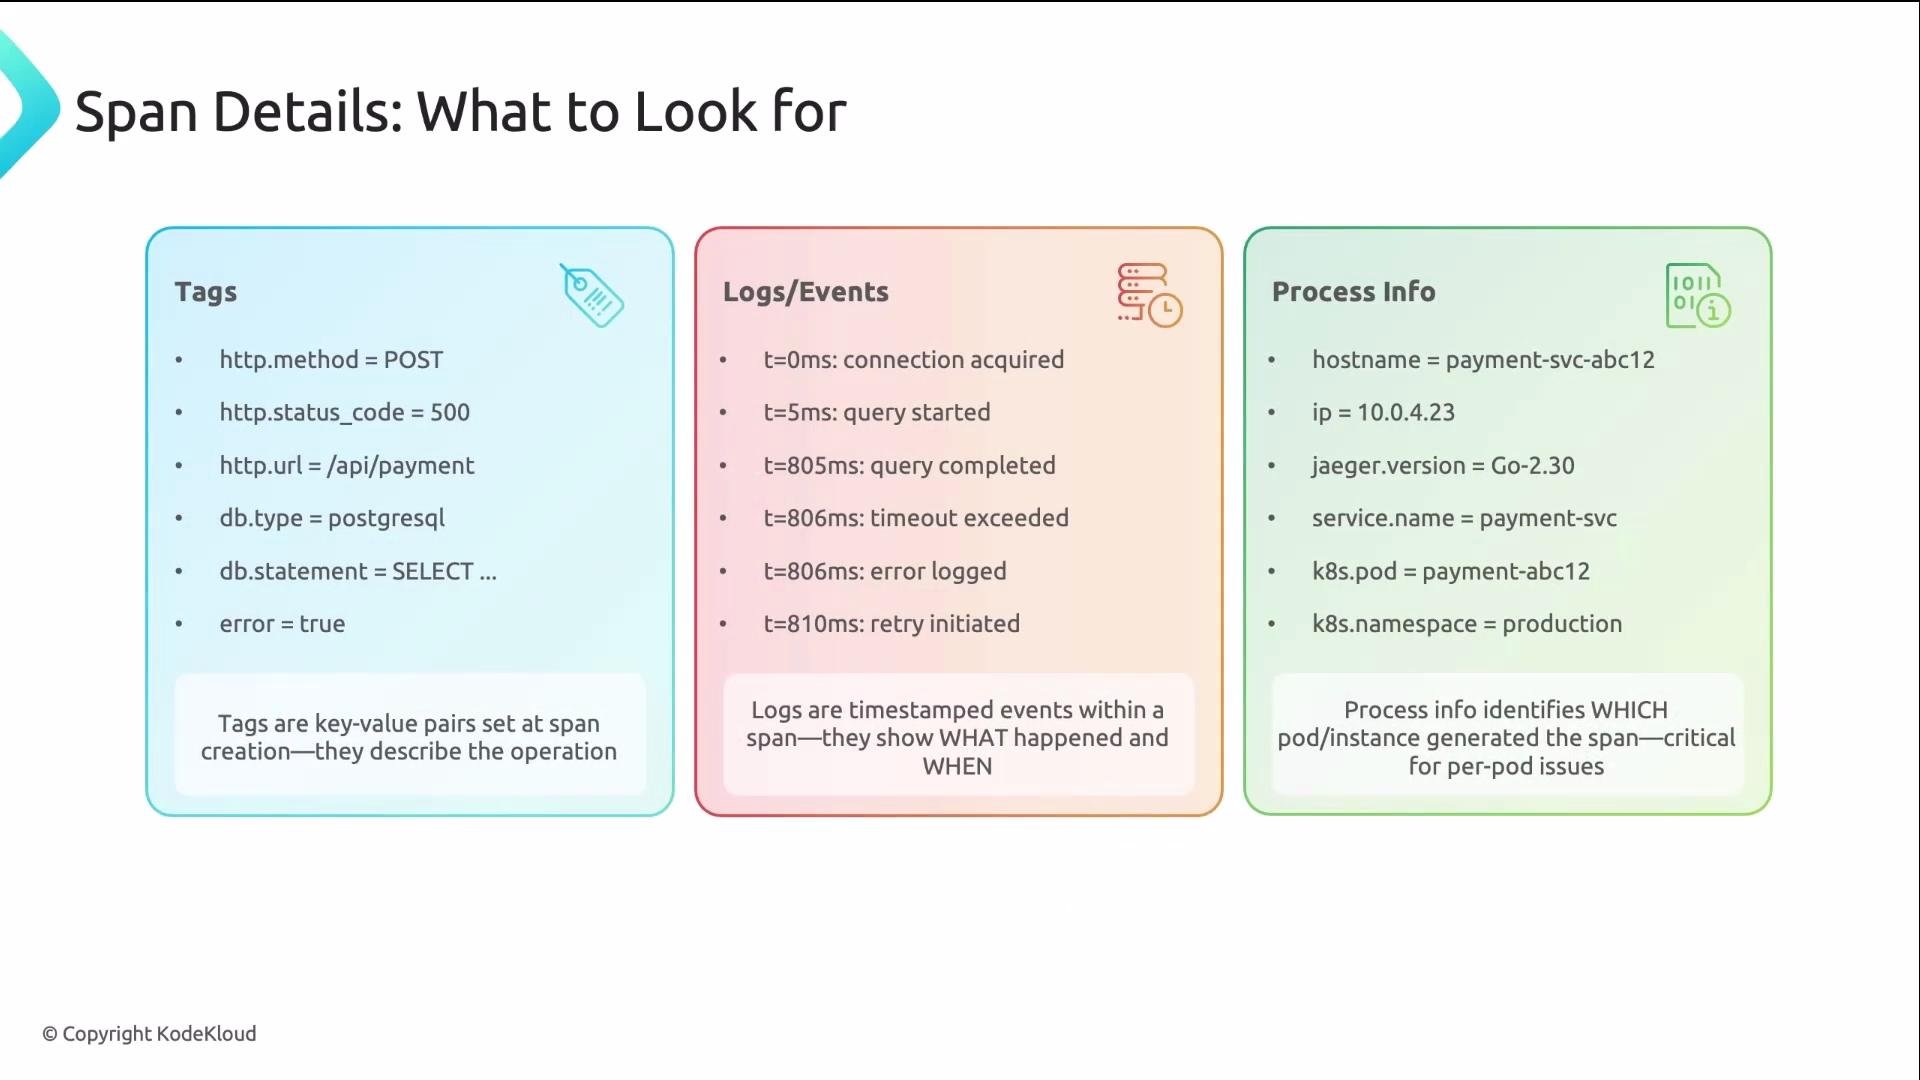
When you click a span in Jaeger, examine these sections — they tell you “why,” not just “where”:
* Tags — e.g., `http.method`, `http.status_code`, `db.statement`. These describe the request and its outcome.
* Logs / events — timestamped internal events like `connection acquired at 0 ms` or `query started at 5 ms`. These reveal timing inside the span.
* Process information — hostname, pod name, namespace; these identify which instance emitted the span so you can correlate logs/metrics.
The waterfall shows where the problem is; span details show why it happened.
## Span details: what to look for
When you click a span in Jaeger, examine these sections — they tell you “why,” not just “where”:
* Tags — e.g., `http.method`, `http.status_code`, `db.statement`. These describe the request and its outcome.
* Logs / events — timestamped internal events like `connection acquired at 0 ms` or `query started at 5 ms`. These reveal timing inside the span.
* Process information — hostname, pod name, namespace; these identify which instance emitted the span so you can correlate logs/metrics.
The waterfall shows where the problem is; span details show why it happened.
 ## Practical tips that save time
* Set a minimum duration when searching to avoid triaging healthy traces. Example: `duration > 1s` or `> 500ms` depending on your SLA.
* Use tag filters to focus on errors: `http.status_code = 500`.
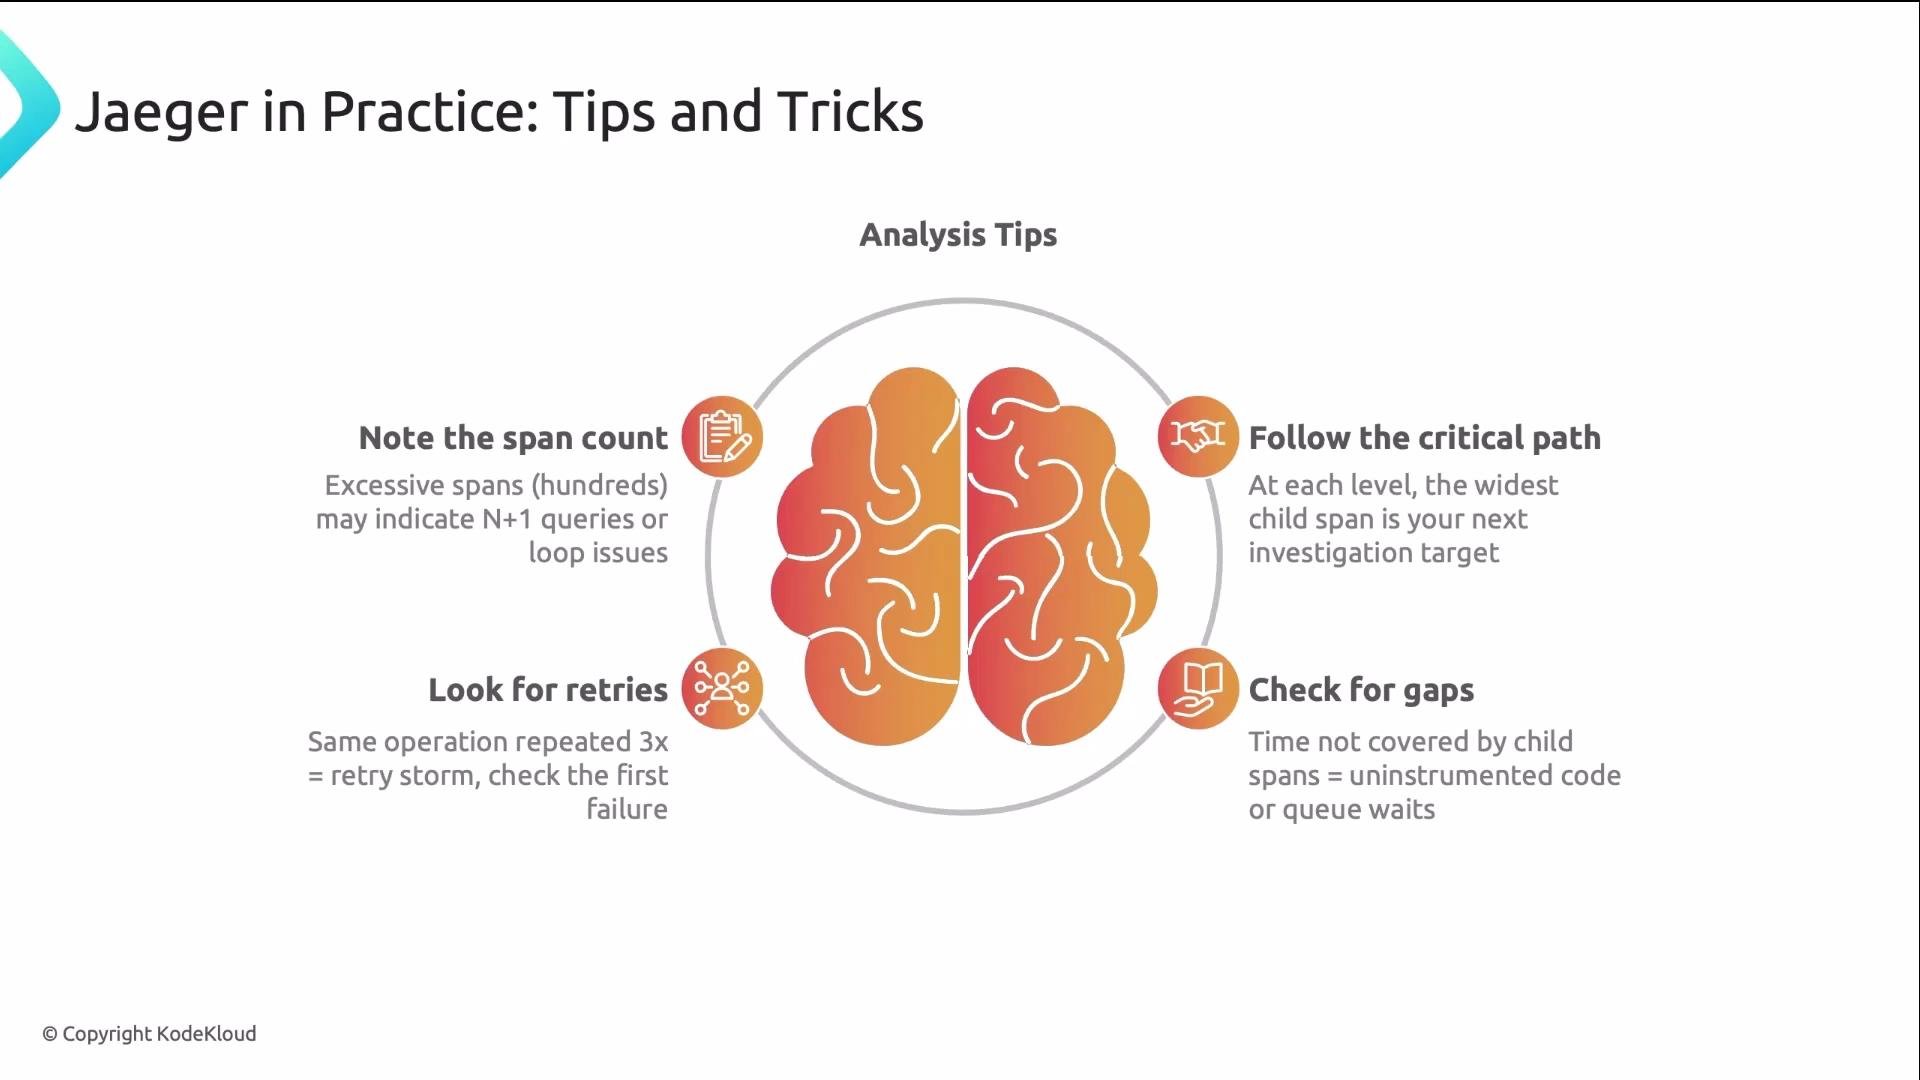
* At each level of the waterfall, follow the widest child (the critical path).
* Watch for gaps: if children don’t add up to the parent, instrument the missing interval (queue, DNS, connection pool).
* Repeated adjacent spans usually indicate retries; inspect the first failure event and the retry policy.
## Practical tips that save time
* Set a minimum duration when searching to avoid triaging healthy traces. Example: `duration > 1s` or `> 500ms` depending on your SLA.
* Use tag filters to focus on errors: `http.status_code = 500`.
* At each level of the waterfall, follow the widest child (the critical path).
* Watch for gaps: if children don’t add up to the parent, instrument the missing interval (queue, DNS, connection pool).
* Repeated adjacent spans usually indicate retries; inspect the first failure event and the retry policy.
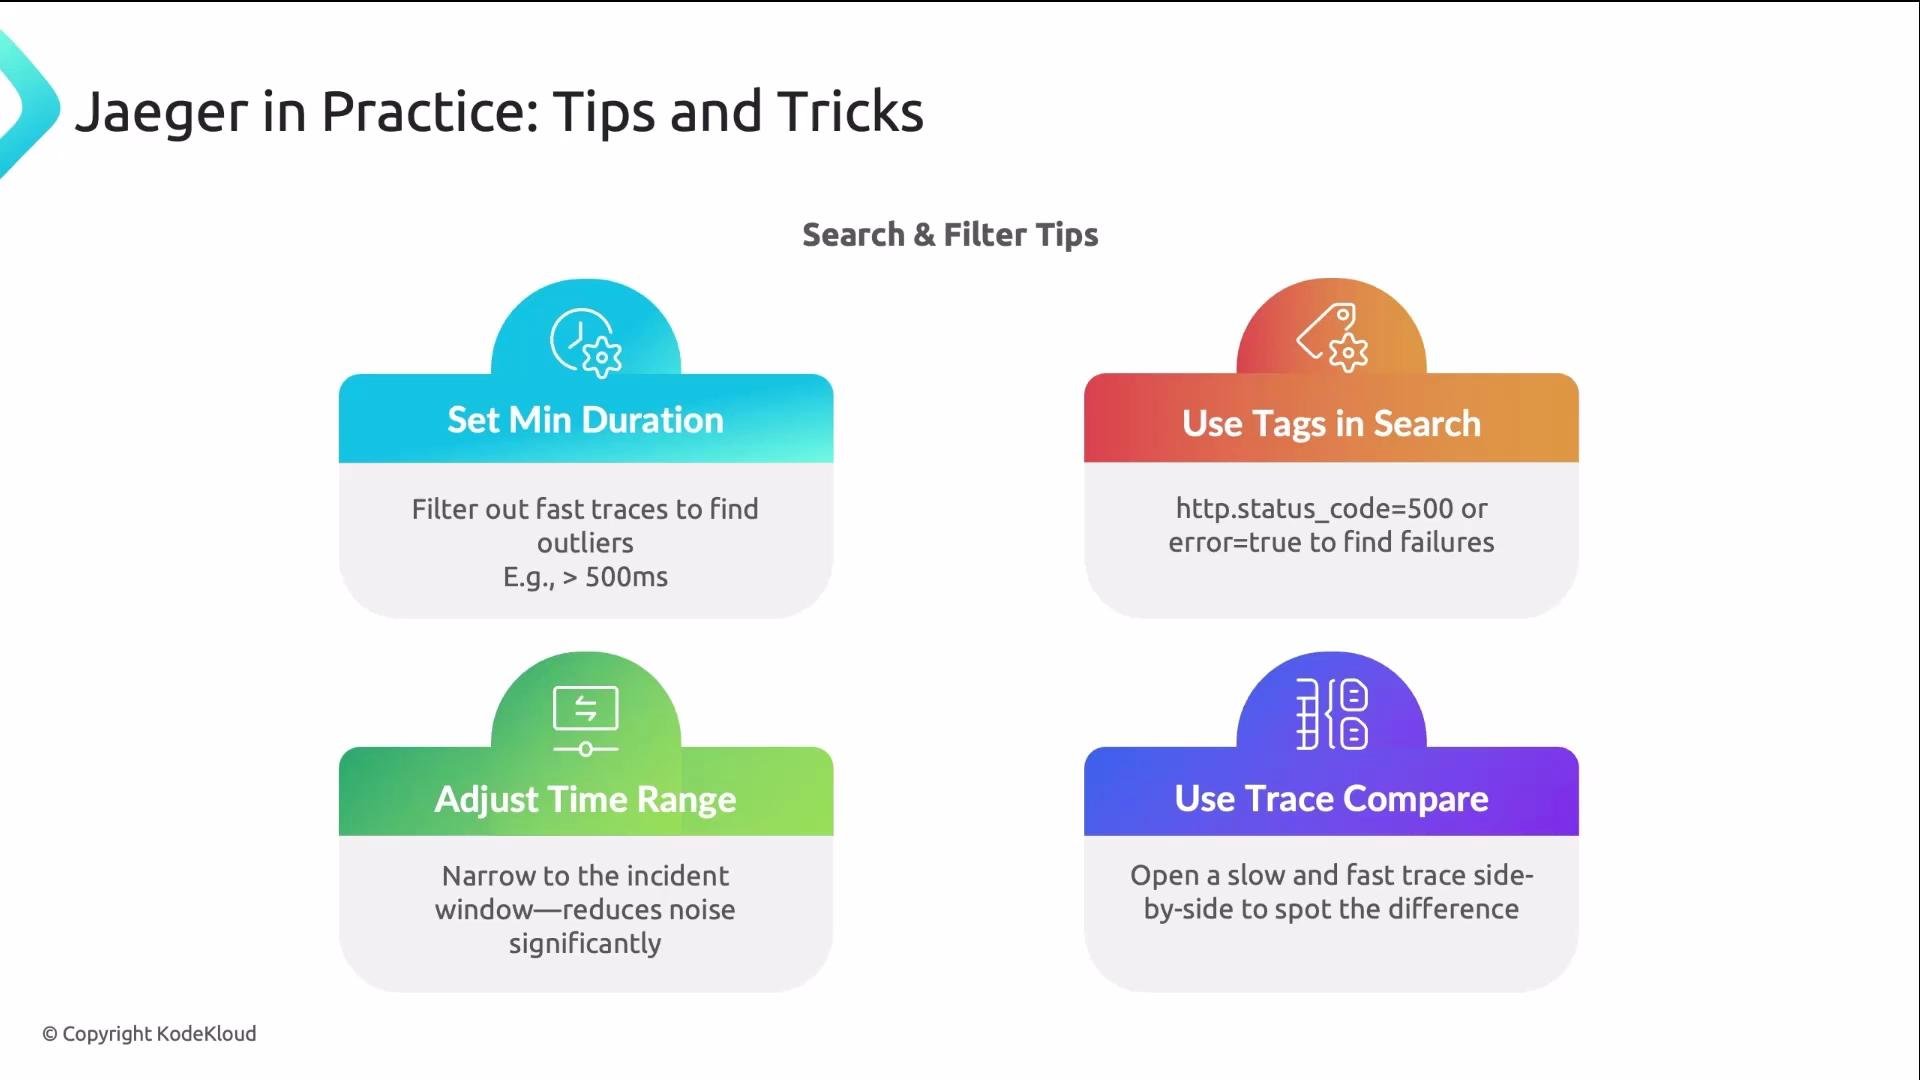 Compare a slow trace with a fast trace of the same operation — the difference is often the quickest path to the root cause.
 If spans are missing (gaps), don’t assume the slow child is the cause — the uninstrumented interval might be the true source. Add instrumentation before concluding.
## Quick checklist for live triage
* Did you filter by duration and tags?
* Did you compare slow vs fast traces?
* Did you follow the critical path to the widest spans?
* Did you inspect tags, events, and the process that emitted the span?
* Did you correlate with metrics/logs for the same timestamp and instance?
## Wrap-up
* The waterfall is your primary diagnostic tool: find the widest bar and follow it.
* Remember the five latency patterns — they cover almost every issue you’ll encounter.
* Use the triage workflow (search, filter, identify, drill down, correlate) instead of ad hoc guessing.
* Span tags, logs/events, and process details point you to the next action and the fix.
## Links and references
* Jaeger documentation: [https://www.jaegertracing.io/docs/](https://www.jaegertracing.io/docs/)
* OpenTelemetry: [https://opentelemetry.io/](https://opentelemetry.io/)
* Distributed tracing best practices: [https://opentelemetry.io/docs/concepts/best-practices/](https://opentelemetry.io/docs/concepts/best-practices/)
If spans are missing (gaps), don’t assume the slow child is the cause — the uninstrumented interval might be the true source. Add instrumentation before concluding.
## Quick checklist for live triage
* Did you filter by duration and tags?
* Did you compare slow vs fast traces?
* Did you follow the critical path to the widest spans?
* Did you inspect tags, events, and the process that emitted the span?
* Did you correlate with metrics/logs for the same timestamp and instance?
## Wrap-up
* The waterfall is your primary diagnostic tool: find the widest bar and follow it.
* Remember the five latency patterns — they cover almost every issue you’ll encounter.
* Use the triage workflow (search, filter, identify, drill down, correlate) instead of ad hoc guessing.
* Span tags, logs/events, and process details point you to the next action and the fix.
## Links and references
* Jaeger documentation: [https://www.jaegertracing.io/docs/](https://www.jaegertracing.io/docs/)
* OpenTelemetry: [https://opentelemetry.io/](https://opentelemetry.io/)
* Distributed tracing best practices: [https://opentelemetry.io/docs/concepts/best-practices/](https://opentelemetry.io/docs/concepts/best-practices/)