> ## Documentation Index
> Fetch the complete documentation index at: https://notes.kodekloud.com/llms.txt
> Use this file to discover all available pages before exploring further.
# Visualization and Dashboards Turning Data into Insight
> How to connect Grafana to Prometheus and design dashboards and panels for rapid triage, monitoring, and visualization best practices
This lesson assumes metrics are collected by Prometheus and alerts are handled by Alertmanager. Here we focus on the visualization layer: Grafana. Dashboards are how you triage incidents, spot trends, and communicate platform health.
 Grafana converts time series into context-rich visuals so teams answer operational questions quickly. In this lesson you will learn how to connect Grafana to Prometheus, pick appropriate panel types, and structure dashboards optimized for quick triage.
 Why this matters
Imagine a flash sale where latency spikes. An engineer manually queries Prometheus in the UI — each PromQL run takes time and context is missing. A colleague opens a pre-built Grafana dashboard and finds the root cause in under two minutes: a downstream payment service exhausted its connection pool. After that incident, Grafana dashboards became the mandatory first stop. Mean time to identify dropped from twenty minutes to under three.
What raw metrics look like:
```plaintext theme={null}
container_cpu_usage_seconds_total{container="web"} 4521.38
container_cpu_usage_seconds_total{container="db"} 1893.21
container_memory_usage_bytes{container="web"} 238901248
http_requests_total{code="200"} 1482901
http_requests_total{code="500"} 4291
kube_pod_status_phase{phase="Running"} 84
... 99,994 more time series
```
Raw metrics are essential but hard to interpret quickly. Grafana transforms those series into panels and dashboards that answer common questions like:
* Is the platform healthy?
* Which services have increasing error rates?
* Are we approaching resource limits?
How Grafana works
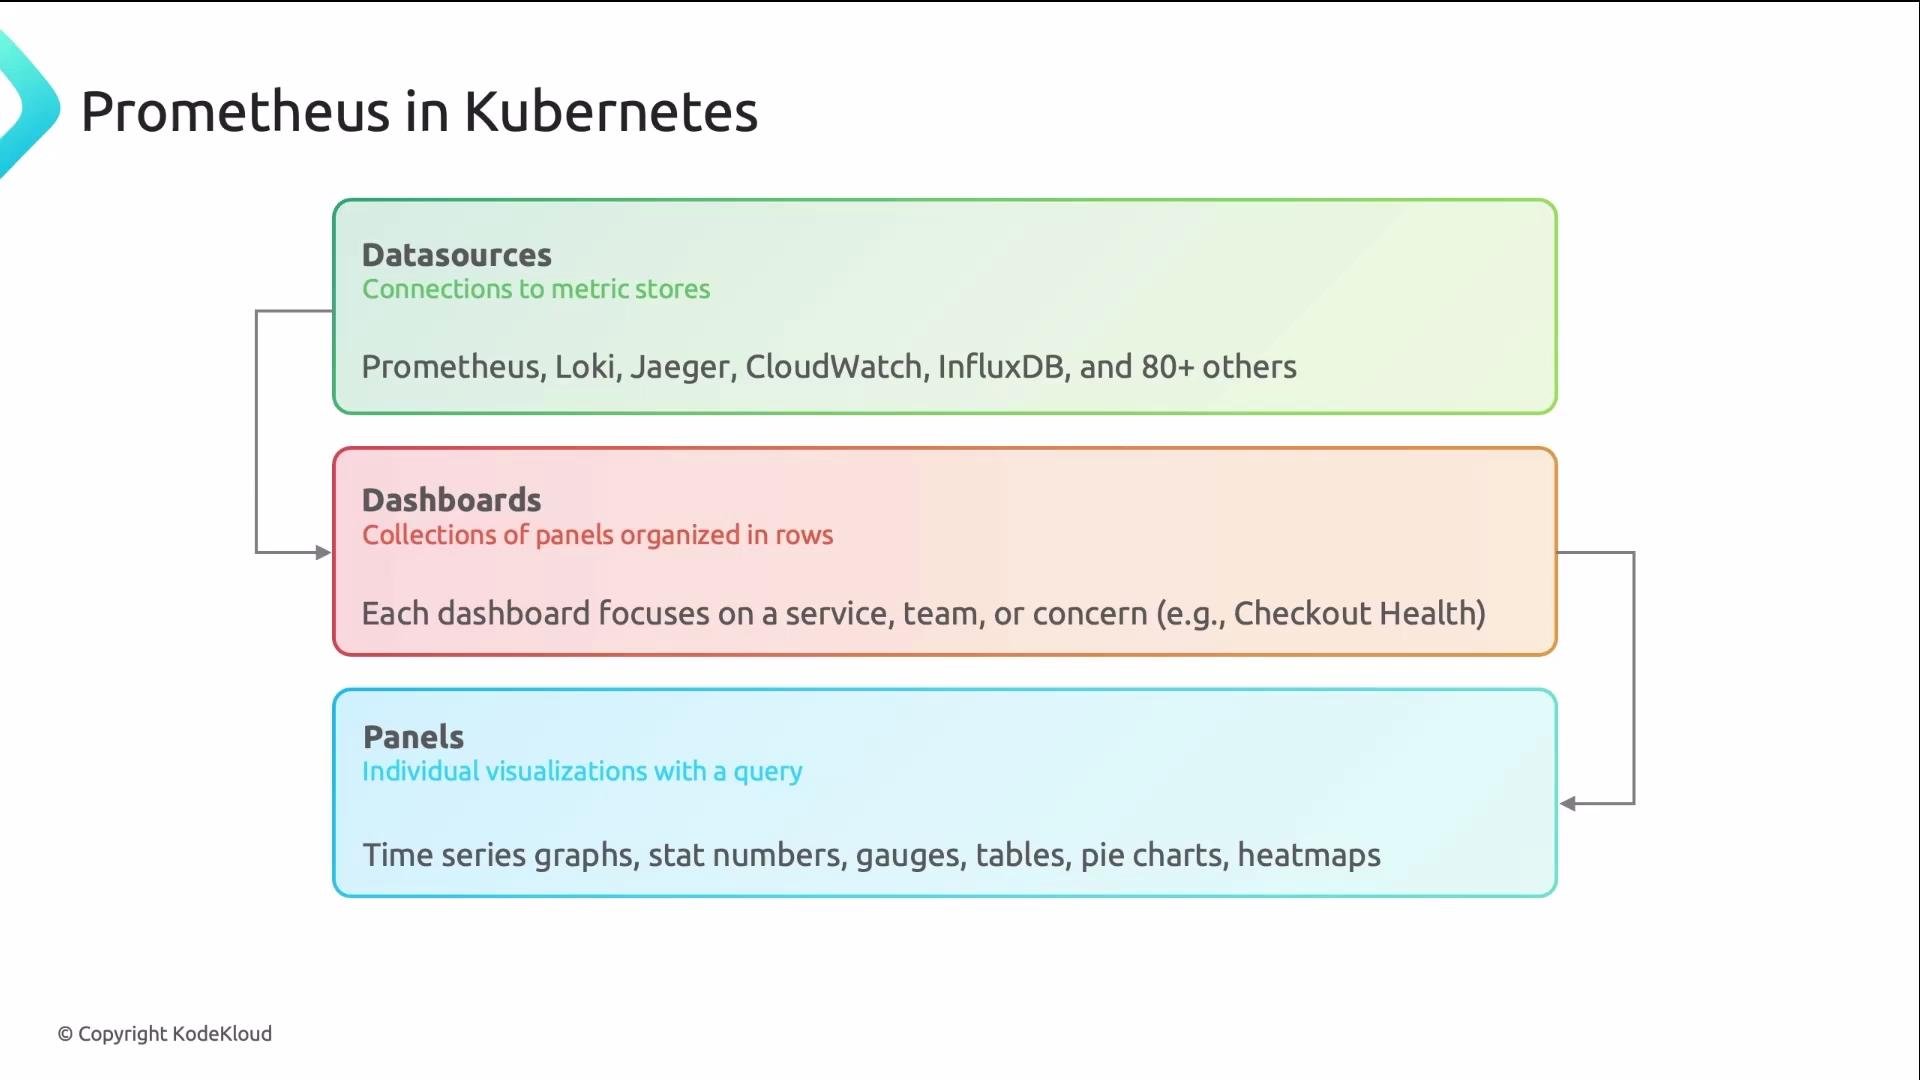
Grafana is organized into three layers:
| Layer | Purpose | Examples |
| ------------ | --------------------------------------------------- | ------------------------------------------------------ |
| Data sources | Connectors to metric stores | `Prometheus`, `CloudWatch` |
| Dashboards | Collections of panels organized to answer a concern | Service overview dashboards, cluster health dashboards |
| Panels | Individual visualizations driven by queries | Time series graphs, stat/gauge panels, tables |
Why this matters
Imagine a flash sale where latency spikes. An engineer manually queries Prometheus in the UI — each PromQL run takes time and context is missing. A colleague opens a pre-built Grafana dashboard and finds the root cause in under two minutes: a downstream payment service exhausted its connection pool. After that incident, Grafana dashboards became the mandatory first stop. Mean time to identify dropped from twenty minutes to under three.
What raw metrics look like:
```plaintext theme={null}
container_cpu_usage_seconds_total{container="web"} 4521.38
container_cpu_usage_seconds_total{container="db"} 1893.21
container_memory_usage_bytes{container="web"} 238901248
http_requests_total{code="200"} 1482901
http_requests_total{code="500"} 4291
kube_pod_status_phase{phase="Running"} 84
... 99,994 more time series
```
Raw metrics are essential but hard to interpret quickly. Grafana transforms those series into panels and dashboards that answer common questions like:
* Is the platform healthy?
* Which services have increasing error rates?
* Are we approaching resource limits?
How Grafana works
Grafana is organized into three layers:
| Layer | Purpose | Examples |
| ------------ | --------------------------------------------------- | ------------------------------------------------------ |
| Data sources | Connectors to metric stores | `Prometheus`, `CloudWatch` |
| Dashboards | Collections of panels organized to answer a concern | Service overview dashboards, cluster health dashboards |
| Panels | Individual visualizations driven by queries | Time series graphs, stat/gauge panels, tables |
 Connecting Grafana to Prometheus
Step-by-step: configure the Prometheus data source in Grafana and verify connectivity.
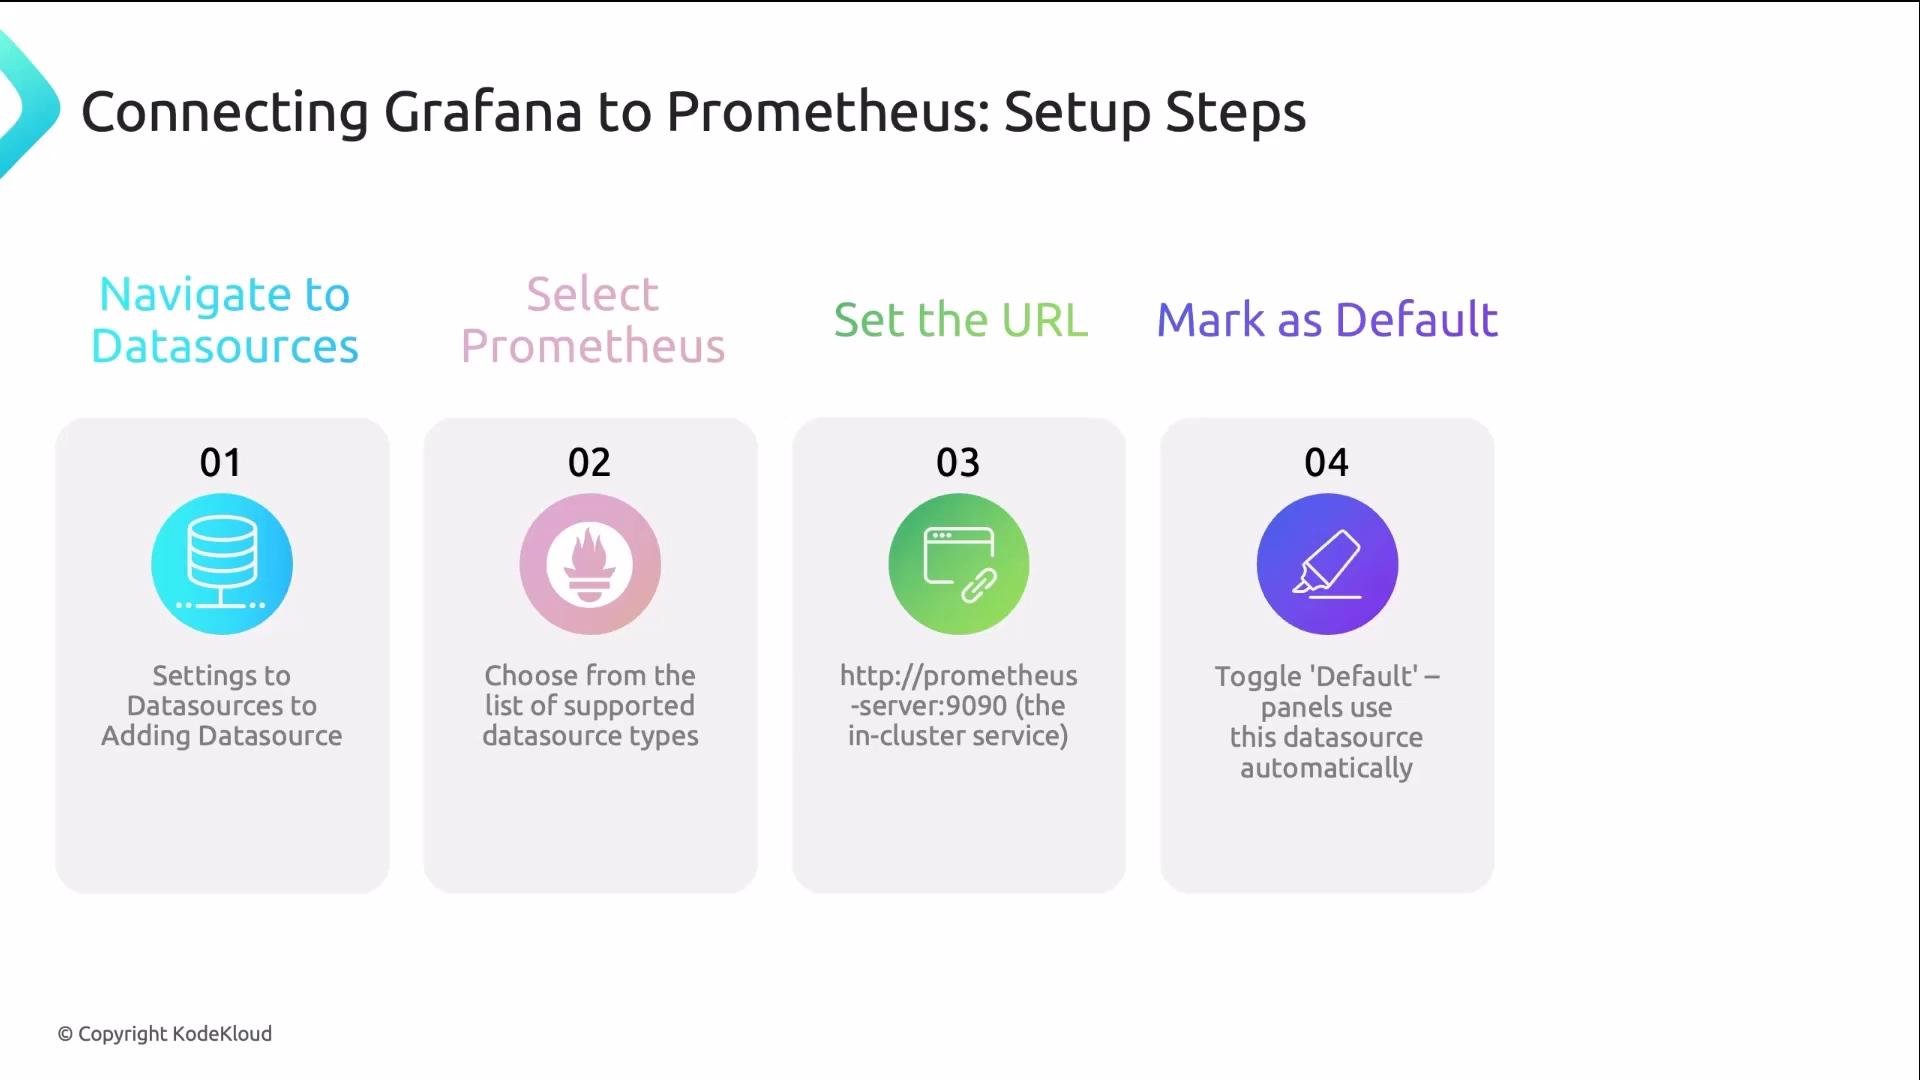
1. Grafana → Settings → Data sources → Add data source.
2. Select "Prometheus".
3. Set the URL to the in-cluster Prometheus service, for example `http://prometheus:9090`. Do not use `localhost` unless Grafana runs on the same host as Prometheus.
4. Toggle `isDefault` (or "Default") if you want new panels to use this data source automatically.
5. Click Save & Test.
If you need to confirm service names in Kubernetes:
```bash theme={null}
kubectl get svc
```
Connecting Grafana to Prometheus
Step-by-step: configure the Prometheus data source in Grafana and verify connectivity.
1. Grafana → Settings → Data sources → Add data source.
2. Select "Prometheus".
3. Set the URL to the in-cluster Prometheus service, for example `http://prometheus:9090`. Do not use `localhost` unless Grafana runs on the same host as Prometheus.
4. Toggle `isDefault` (or "Default") if you want new panels to use this data source automatically.
5. Click Save & Test.
If you need to confirm service names in Kubernetes:
```bash theme={null}
kubectl get svc
```
 Make sure the Prometheus URL is reachable from the Grafana pod. If Grafana cannot reach the service, check Kubernetes network policies, the service name, and the service port (Prometheus default is `9090`).
Example provisioning YAML (for automated provisioning in Grafana):
```yaml theme={null}
apiVersion: 1
datasources:
- name: Prometheus
type: prometheus
url: http://prometheus:9090
isDefault: true
```
Common pitfalls
| Problem | How to diagnose/fix |
| ------------- | ----------------------------------------------------------------- |
| Wrong URL | Verify the service name and port: `kubectl get svc` |
| Port mismatch | Confirm Prometheus is listening on `9090` or your custom port |
| Not default | Toggle `isDefault` so panels use the Prometheus source by default |
Choosing the right panel for the question
Match visualization to intent:
| Panel type | When to use | Example query |
| ----------- | ----------------------------------------- | --------------------------------------------------- |
| Time series | Trends and correlations over time | `rate(http_requests_total[5m])` |
| Stat | Single summary numbers (QPS, error count) | `sum(rate(http_requests_total[1m]))` |
| Gauge | Current utilization (CPU%, memory%) | `node_memory_usage_bytes / node_memory_total_bytes` |
| Table | Detailed lists and metadata | `topk(10, container_memory_usage_bytes)` |
| Pie chart | Distribution across categories | `sum by(status)(http_requests_total)` |
Common PromQL examples
```promql theme={null}
# Requests per second (5-minute rate)
rate(http_requests_total[5m])
# Number of healthy scrape targets (up == 1)
count(up == 1)
# Memory utilization (example)
node_memory_usage_bytes / node_memory_total_bytes
# Top 10 containers by memory usage
topk(10, container_memory_usage_bytes)
```
Organizing dashboards for rapid triage
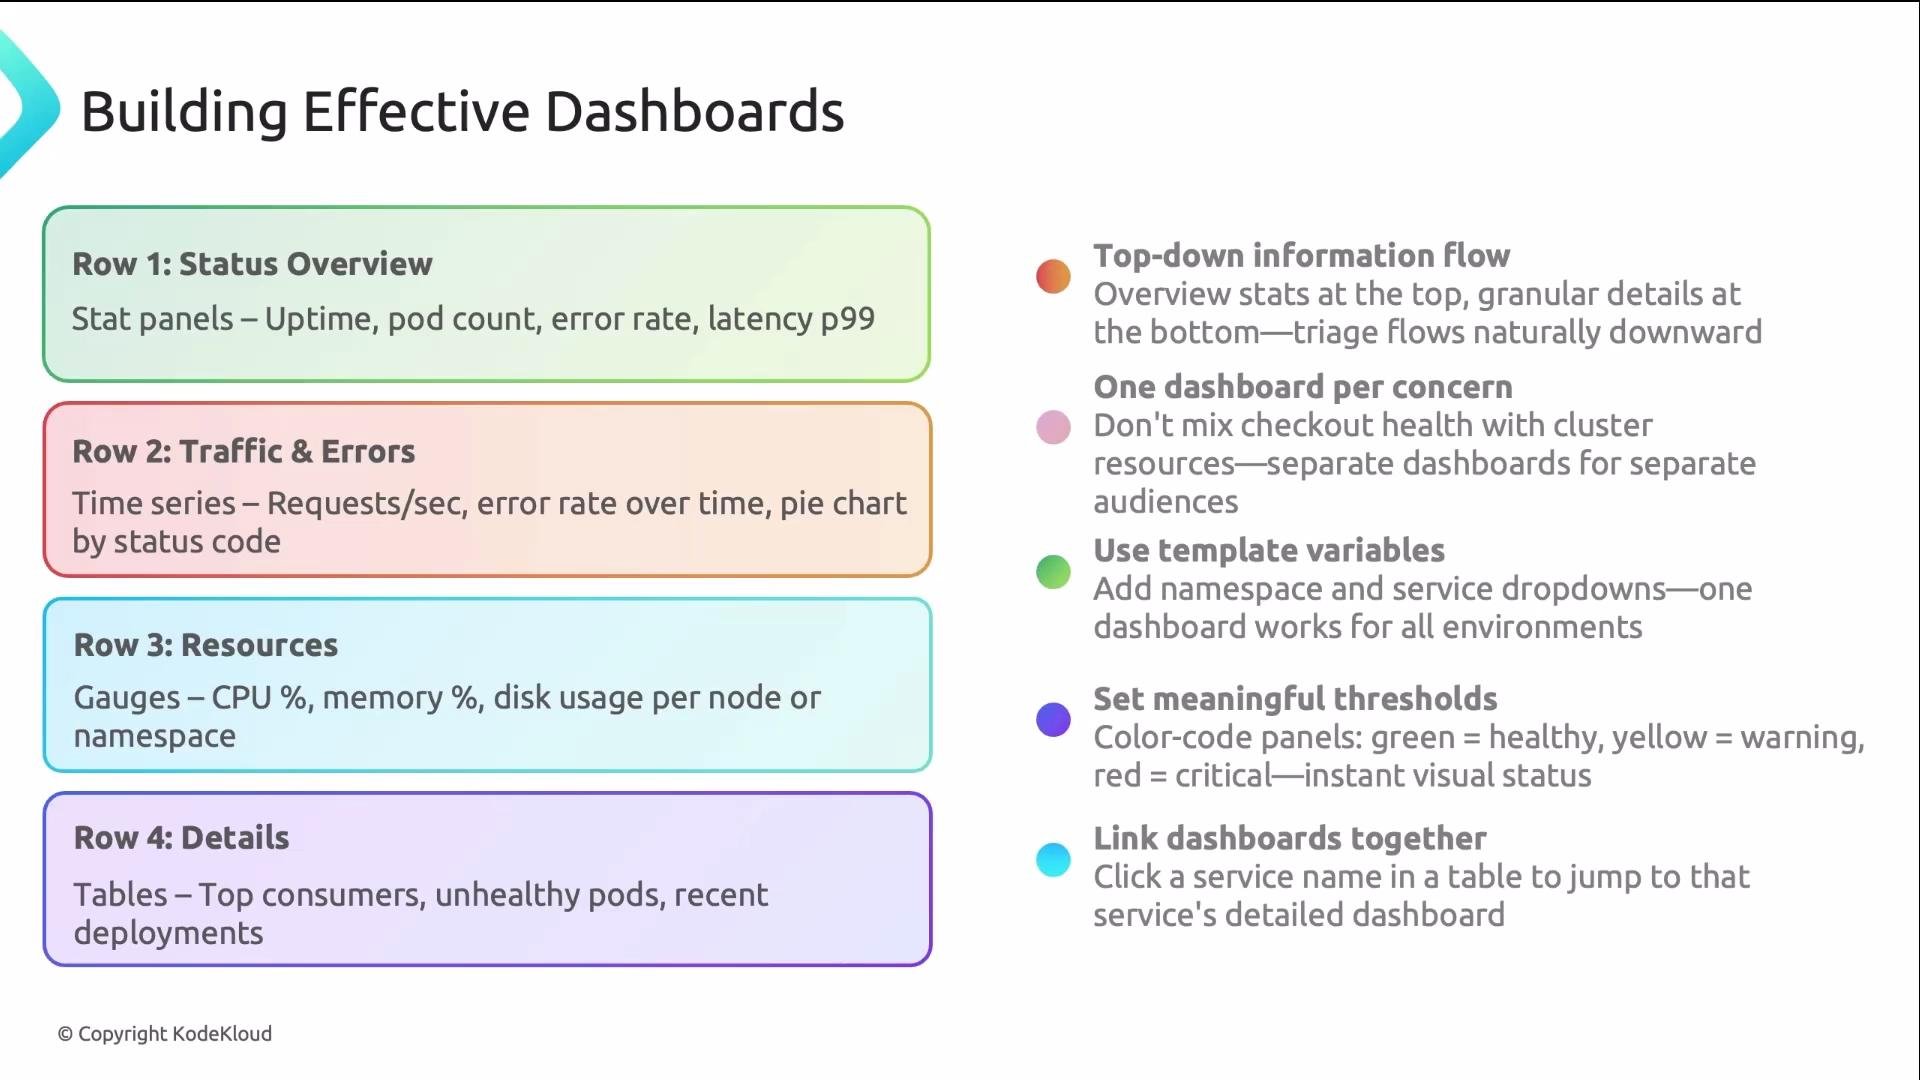
Design dashboards top-down so the most important signals are at the top and the details are at the bottom. A practical layout:
1. Status overview (first row)
* Stat panels answering "is everything broken?" — use clear color thresholds.
2. Traffic & errors (second row)
* Time series for request rate, error rate, latency; correlate with deployments.
3. Resources (third row)
* Gauges and time series for CPU, memory, disk with thresholds.
4. Details (bottom row)
* Tables and links to logs or service-specific dashboards for drill-down.
This flow mirrors triage: glance → confirm → drill in.
Make sure the Prometheus URL is reachable from the Grafana pod. If Grafana cannot reach the service, check Kubernetes network policies, the service name, and the service port (Prometheus default is `9090`).
Example provisioning YAML (for automated provisioning in Grafana):
```yaml theme={null}
apiVersion: 1
datasources:
- name: Prometheus
type: prometheus
url: http://prometheus:9090
isDefault: true
```
Common pitfalls
| Problem | How to diagnose/fix |
| ------------- | ----------------------------------------------------------------- |
| Wrong URL | Verify the service name and port: `kubectl get svc` |
| Port mismatch | Confirm Prometheus is listening on `9090` or your custom port |
| Not default | Toggle `isDefault` so panels use the Prometheus source by default |
Choosing the right panel for the question
Match visualization to intent:
| Panel type | When to use | Example query |
| ----------- | ----------------------------------------- | --------------------------------------------------- |
| Time series | Trends and correlations over time | `rate(http_requests_total[5m])` |
| Stat | Single summary numbers (QPS, error count) | `sum(rate(http_requests_total[1m]))` |
| Gauge | Current utilization (CPU%, memory%) | `node_memory_usage_bytes / node_memory_total_bytes` |
| Table | Detailed lists and metadata | `topk(10, container_memory_usage_bytes)` |
| Pie chart | Distribution across categories | `sum by(status)(http_requests_total)` |
Common PromQL examples
```promql theme={null}
# Requests per second (5-minute rate)
rate(http_requests_total[5m])
# Number of healthy scrape targets (up == 1)
count(up == 1)
# Memory utilization (example)
node_memory_usage_bytes / node_memory_total_bytes
# Top 10 containers by memory usage
topk(10, container_memory_usage_bytes)
```
Organizing dashboards for rapid triage
Design dashboards top-down so the most important signals are at the top and the details are at the bottom. A practical layout:
1. Status overview (first row)
* Stat panels answering "is everything broken?" — use clear color thresholds.
2. Traffic & errors (second row)
* Time series for request rate, error rate, latency; correlate with deployments.
3. Resources (third row)
* Gauges and time series for CPU, memory, disk with thresholds.
4. Details (bottom row)
* Tables and links to logs or service-specific dashboards for drill-down.
This flow mirrors triage: glance → confirm → drill in.
 Best practices
* Use template variables for service, namespace, and cluster so dashboards are reusable across environments.
* Set meaningful thresholds and color rules to make issues obvious.
* Link overview dashboards to service-specific dashboards for fast context switching.
* Pre-build panels for common incident questions so responders avoid creating PromQL under pressure.
* Keep panels focused: one question per panel.
Bringing it all together — quick checklist
| Step | Action |
| ---- | ----------------------------------------------------------------------------- |
| 1 | Add and verify the Prometheus data source in Grafana |
| 2 | Choose panel types that answer your operational questions |
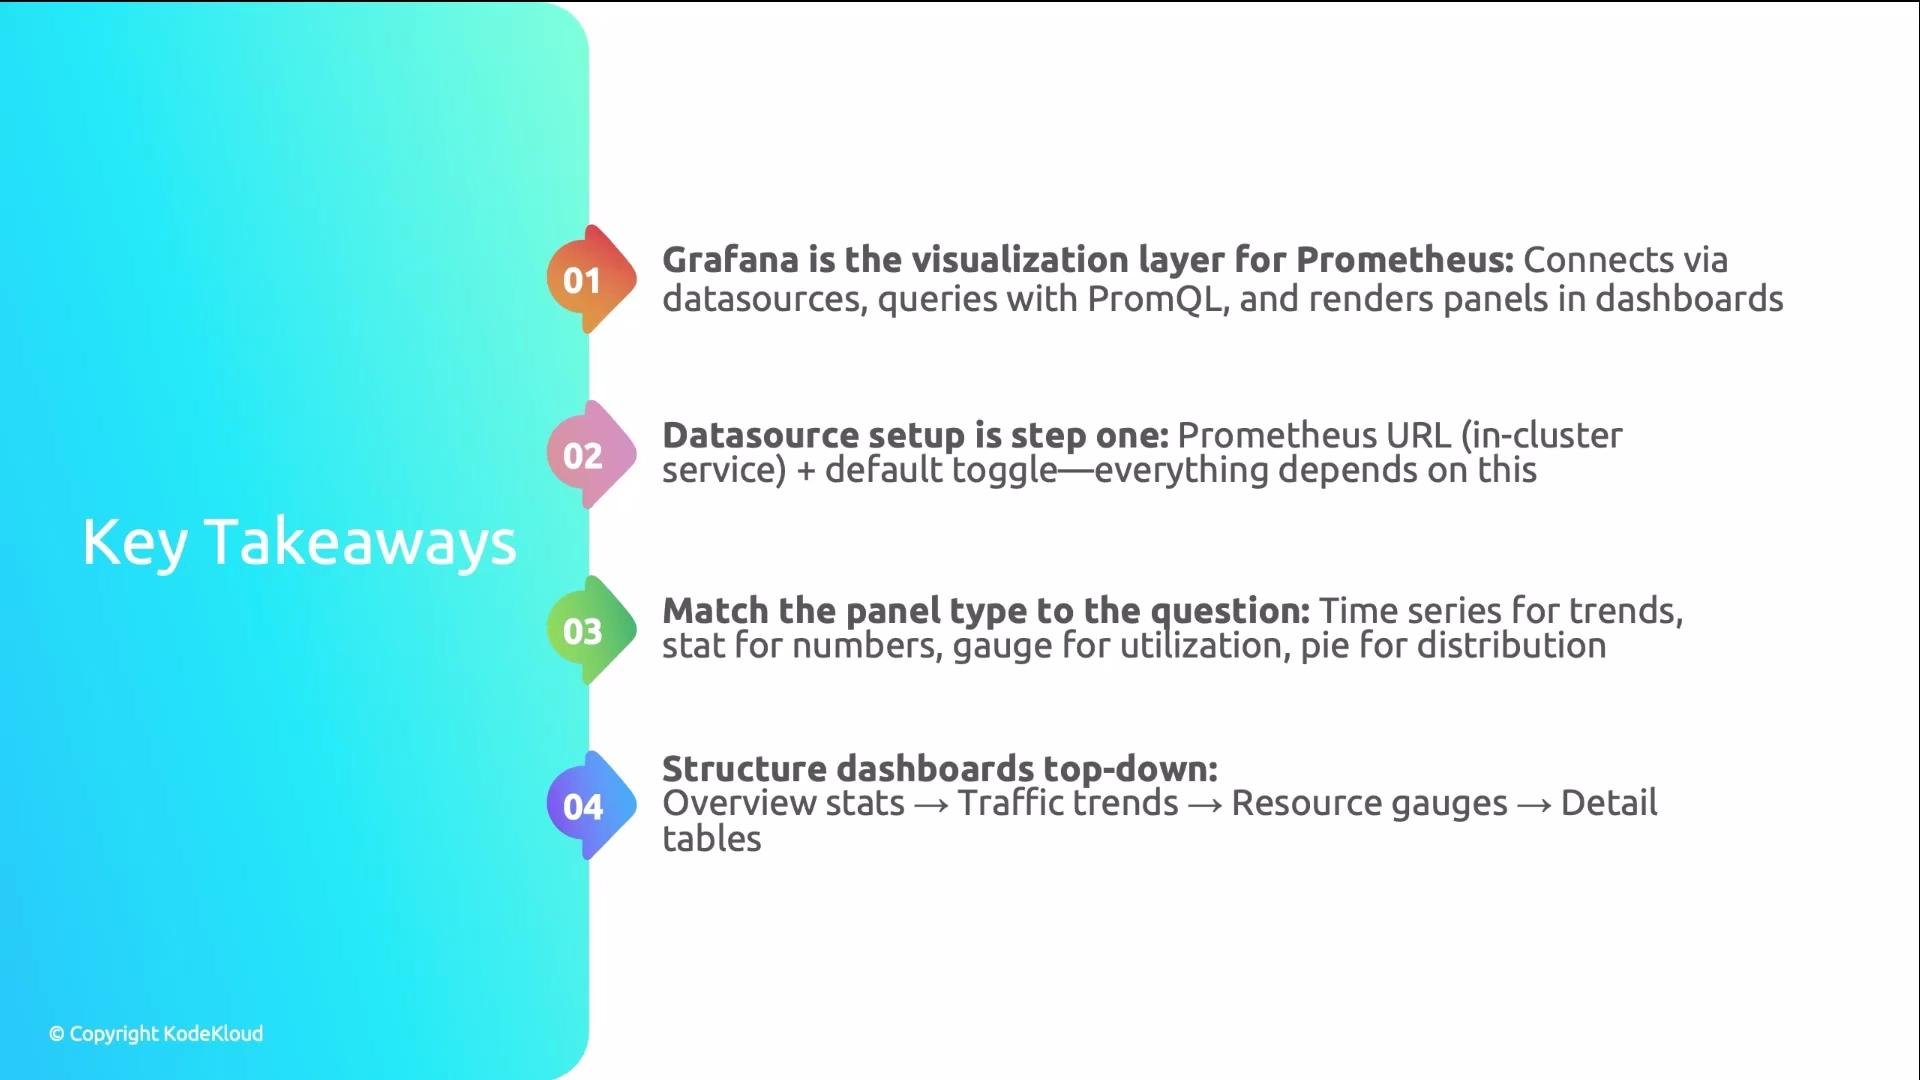
| 3 | Structure dashboards top-down: overview → trends/errors → resources → details |
| 4 | Add variables, thresholds, and dashboard links for reuse and faster triage |
Best practices
* Use template variables for service, namespace, and cluster so dashboards are reusable across environments.
* Set meaningful thresholds and color rules to make issues obvious.
* Link overview dashboards to service-specific dashboards for fast context switching.
* Pre-build panels for common incident questions so responders avoid creating PromQL under pressure.
* Keep panels focused: one question per panel.
Bringing it all together — quick checklist
| Step | Action |
| ---- | ----------------------------------------------------------------------------- |
| 1 | Add and verify the Prometheus data source in Grafana |
| 2 | Choose panel types that answer your operational questions |
| 3 | Structure dashboards top-down: overview → trends/errors → resources → details |
| 4 | Add variables, thresholds, and dashboard links for reuse and faster triage |
 Grafana visualizes metrics but does not store them long-term — ensure Prometheus retention, remote-write, or a long-term store is configured if you need extended history for investigations.