> ## Documentation Index
> Fetch the complete documentation index at: https://notes.kodekloud.com/llms.txt
> Use this file to discover all available pages before exploring further.
# Cost for Platforms What Drives Spend and How to Reduce It
> Explains Kubernetes cloud cost drivers, using OpenCost for visibility, and practical strategies to attribute, optimize, and reduce platform spending
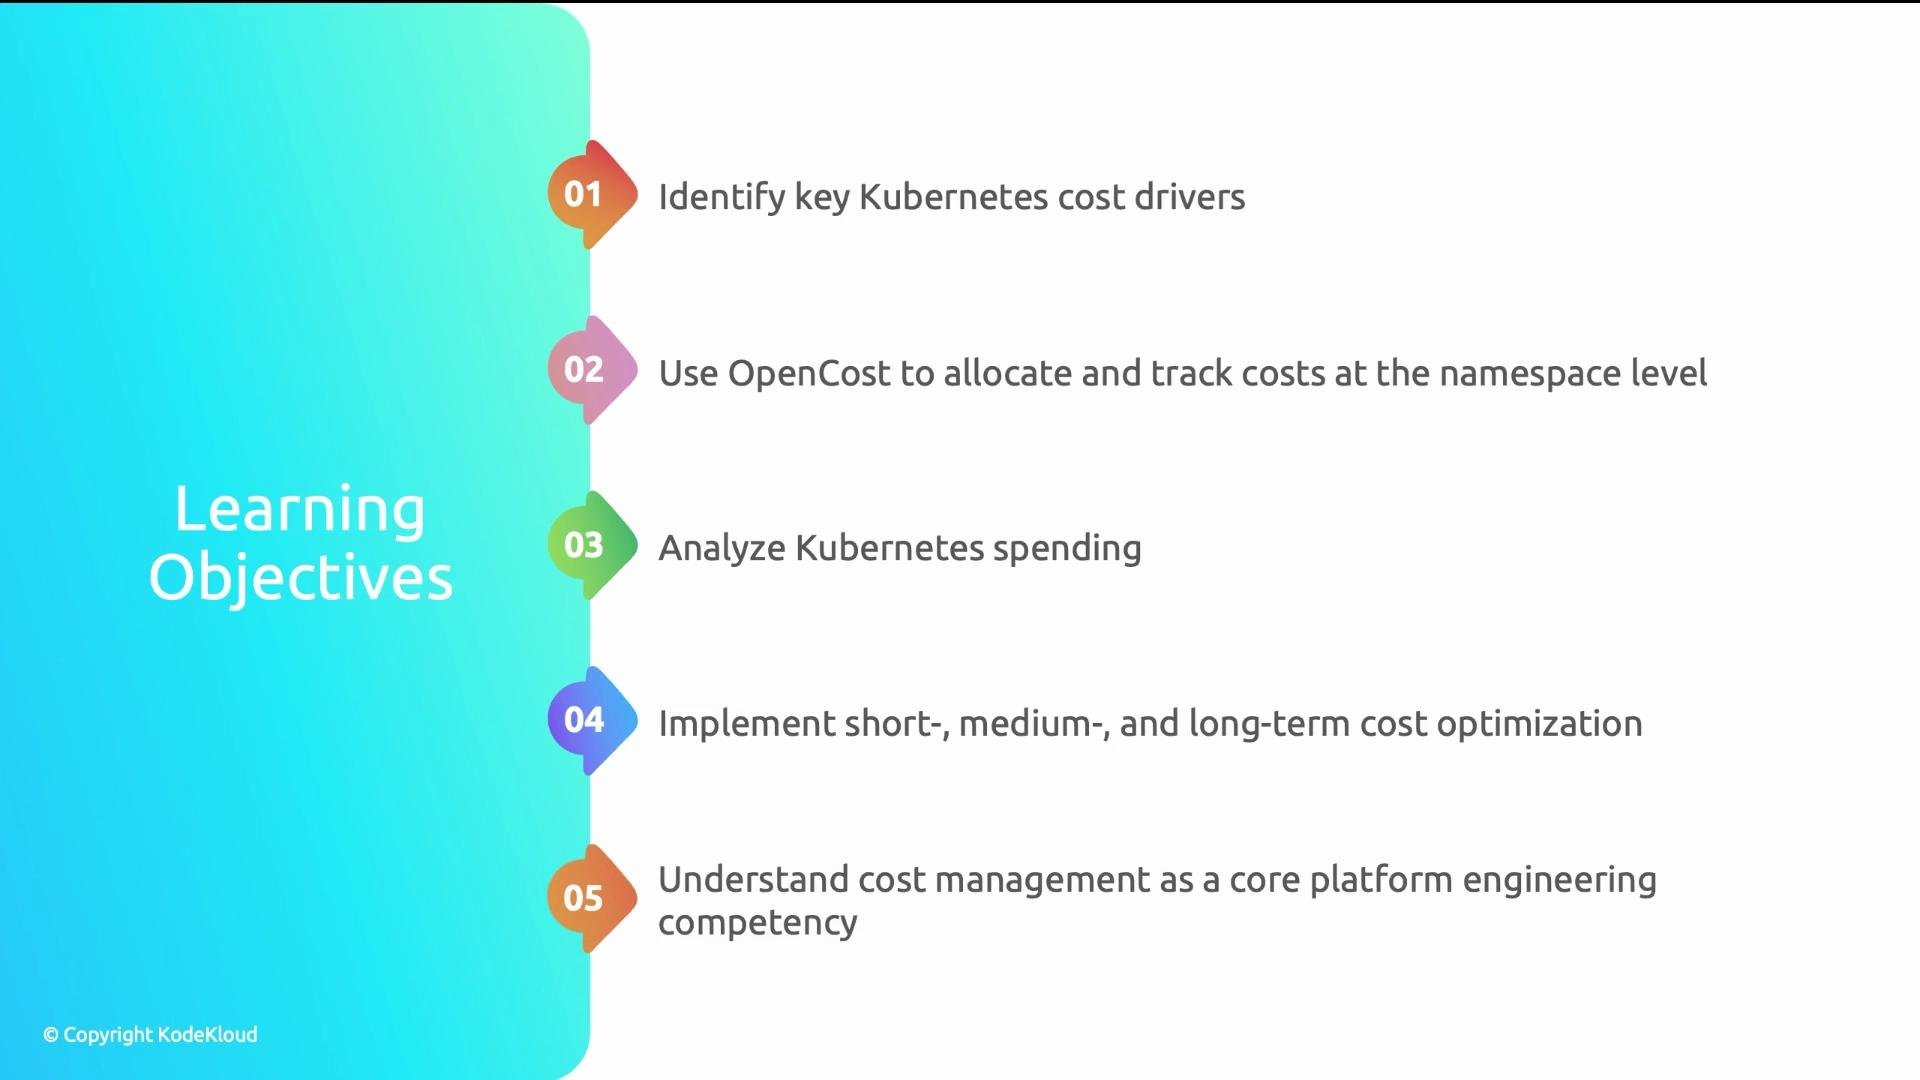
This lesson explains the financial side of running Kubernetes: what causes cloud spend, how to make that spend visible, and how to reduce it systematically. By the end you'll have a practical framework and tools to answer: Where is our cloud spend going? Who is spending it? And what can we do to reduce it?
 ## What actually drives Kubernetes costs?
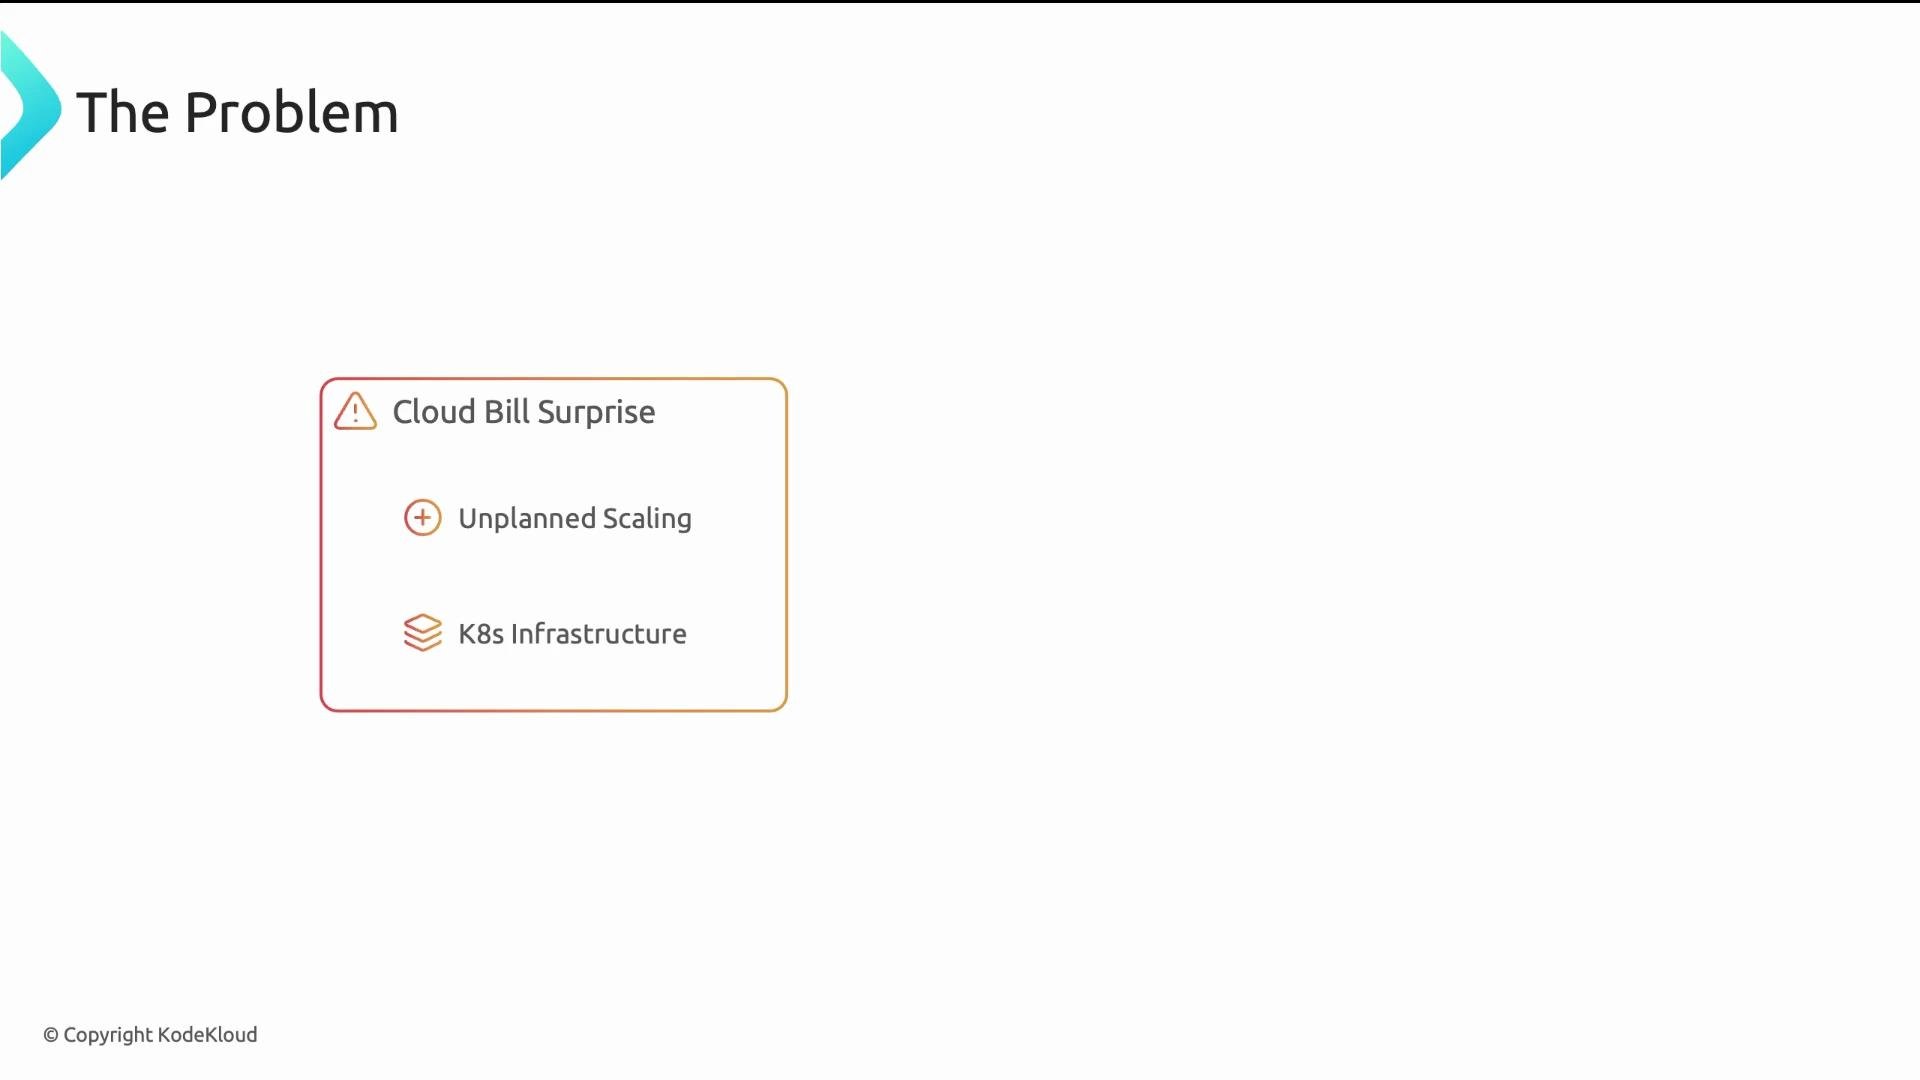
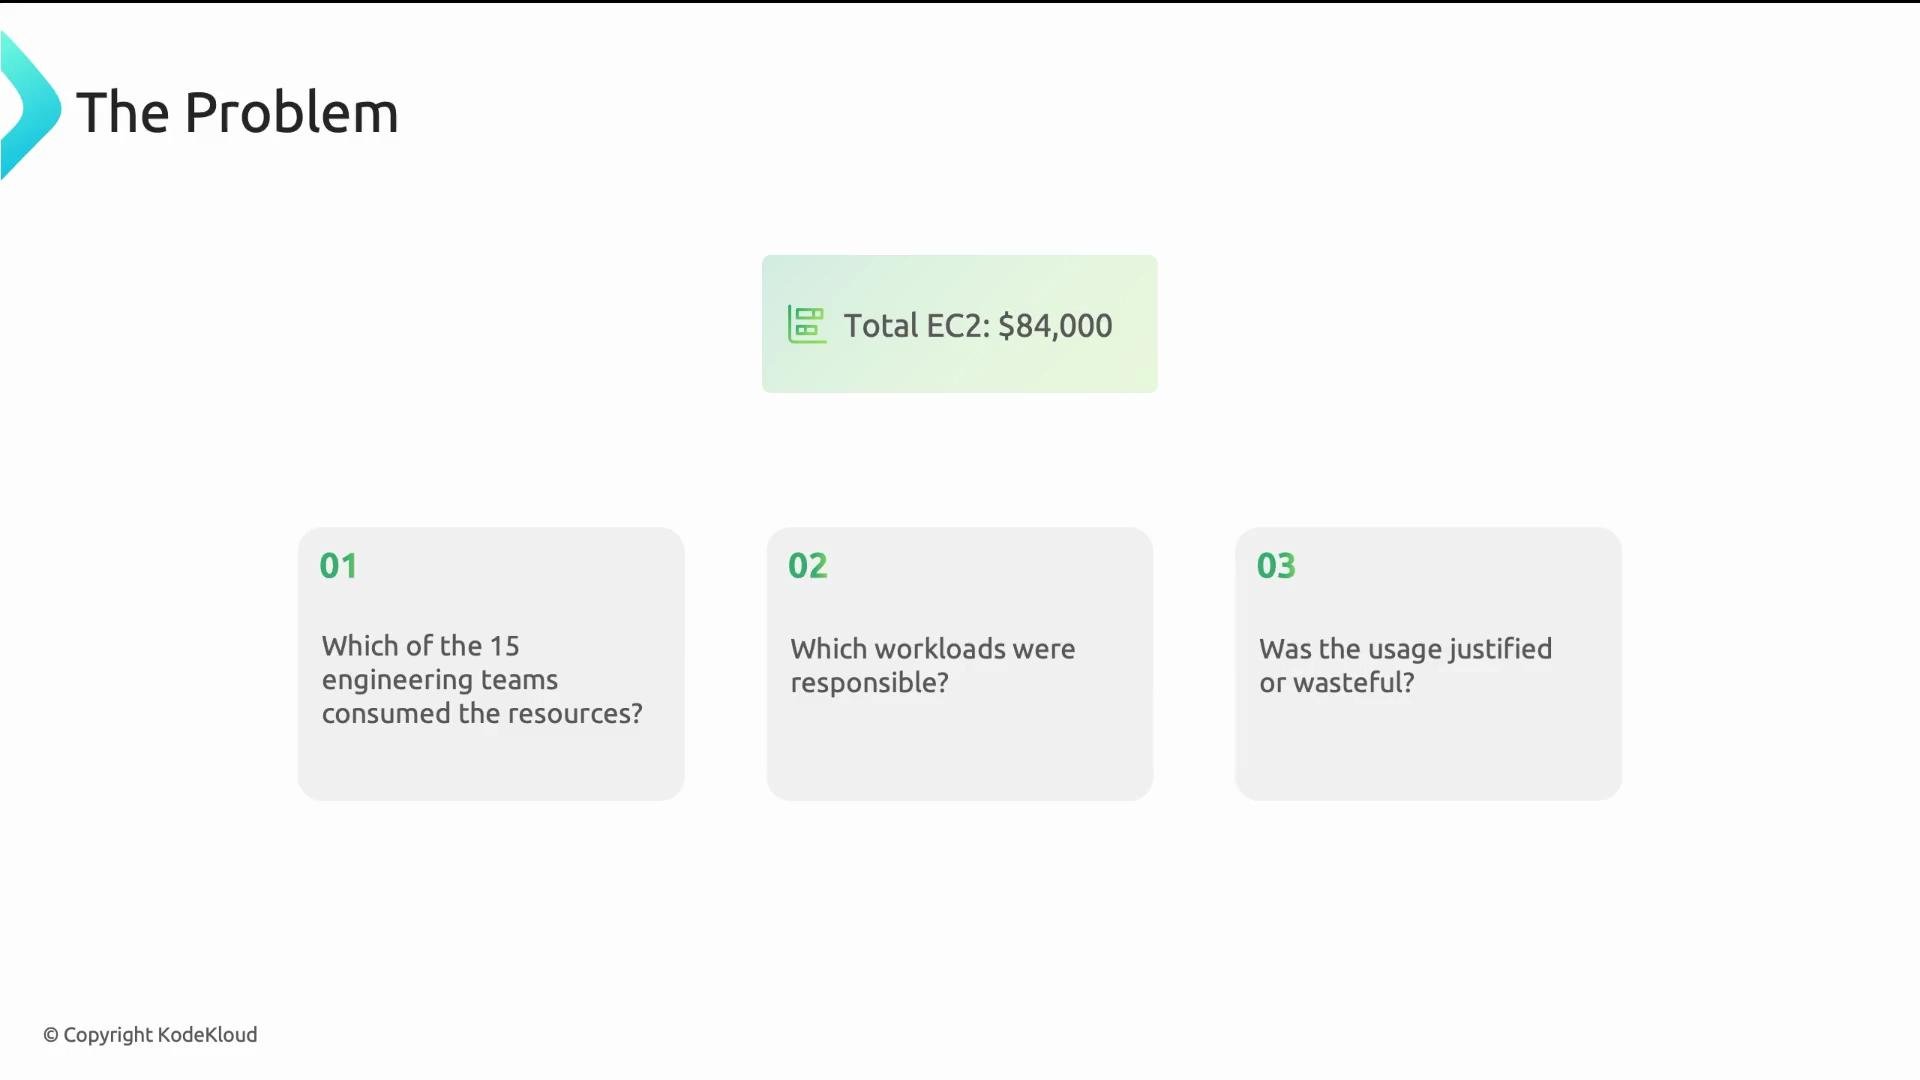
Consider this real example: a mid-sized SaaS provider saw its monthly Kubernetes cloud bill jump from $30,000 to $120,000 in a year. The cloud invoice showed a large EC2 line item, but the platform team couldn't map those dollars to namespaces, teams, or workloads — so they couldn't tell whether the spend was justified or wasteful.
## What actually drives Kubernetes costs?
Consider this real example: a mid-sized SaaS provider saw its monthly Kubernetes cloud bill jump from $30,000 to $120,000 in a year. The cloud invoice showed a large EC2 line item, but the platform team couldn't map those dollars to namespaces, teams, or workloads — so they couldn't tell whether the spend was justified or wasteful.
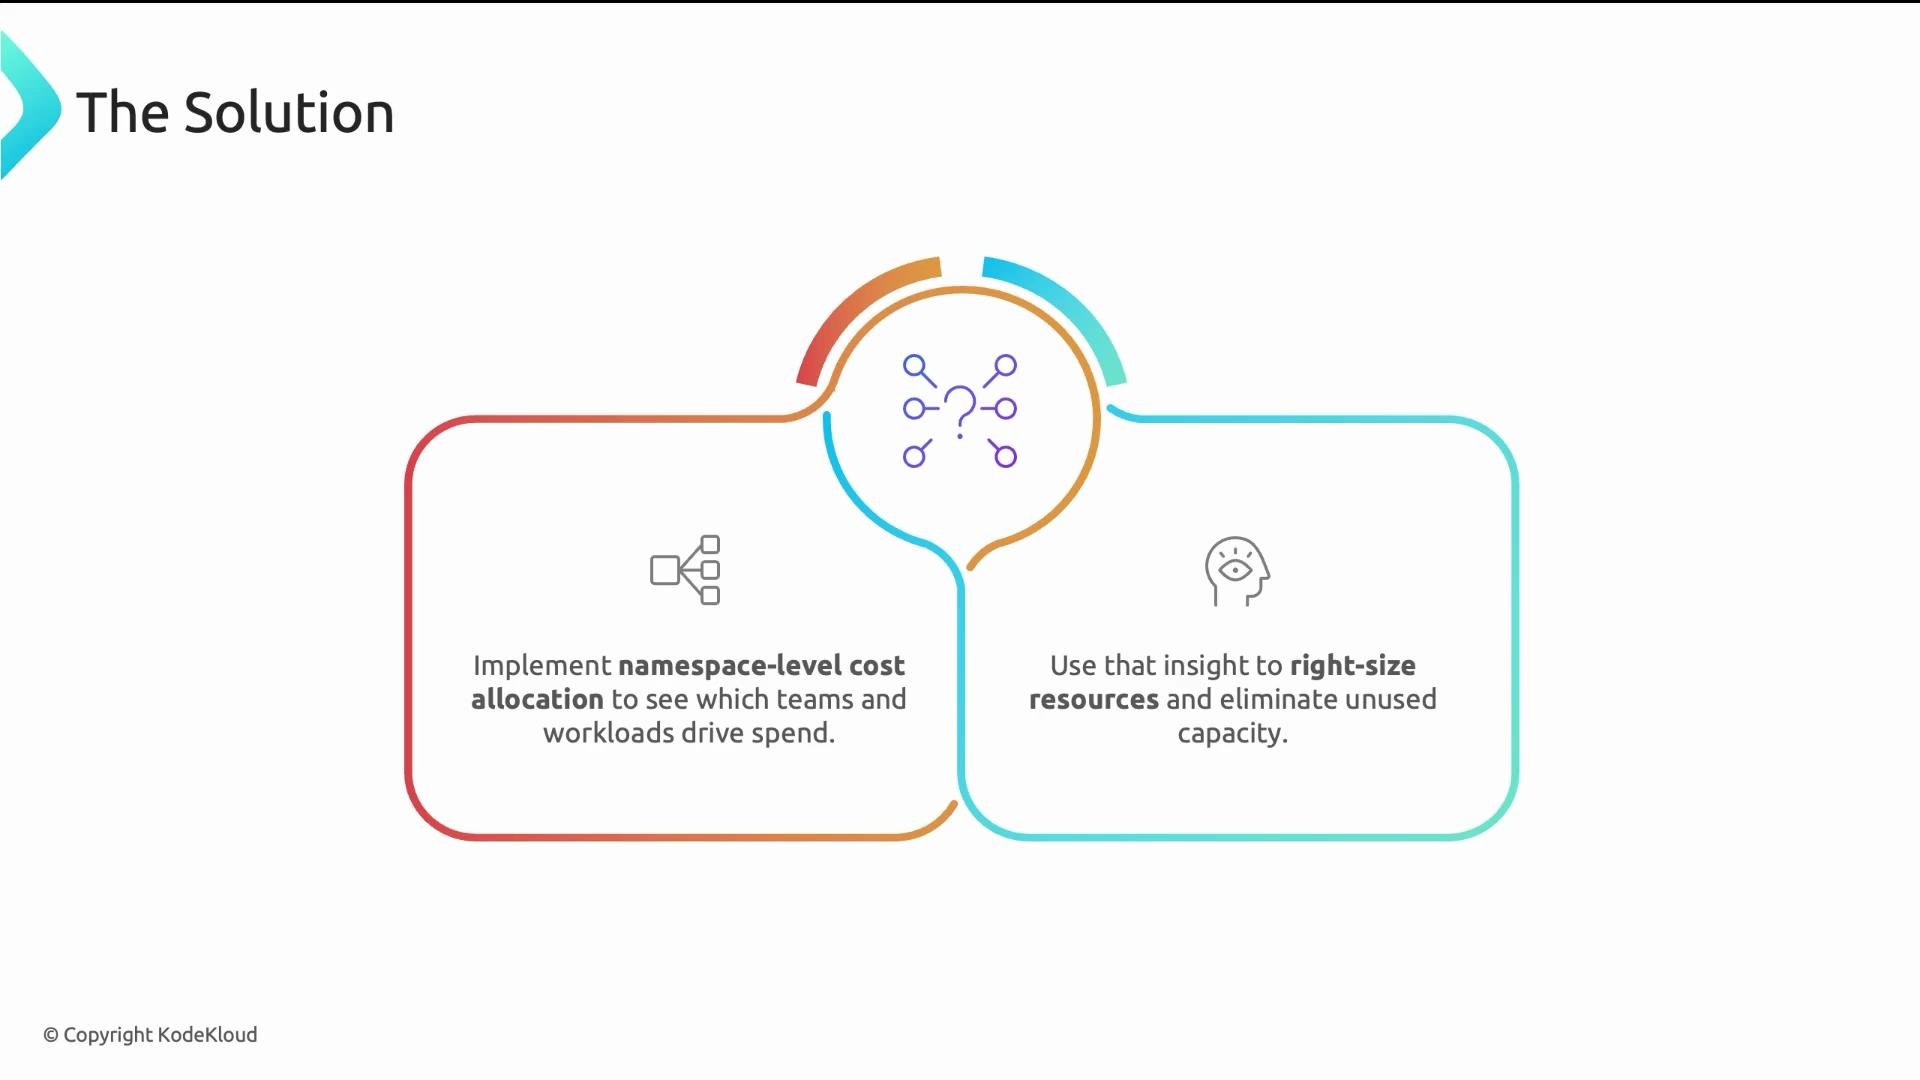
 The operational solution is to introduce namespace-level cost allocation so teams and finance can map cloud dollars to platform constructs. With that visibility you can systematically eliminate unused capacity and right-size resources where it matters most.
 ## Major cost categories (and where to focus)
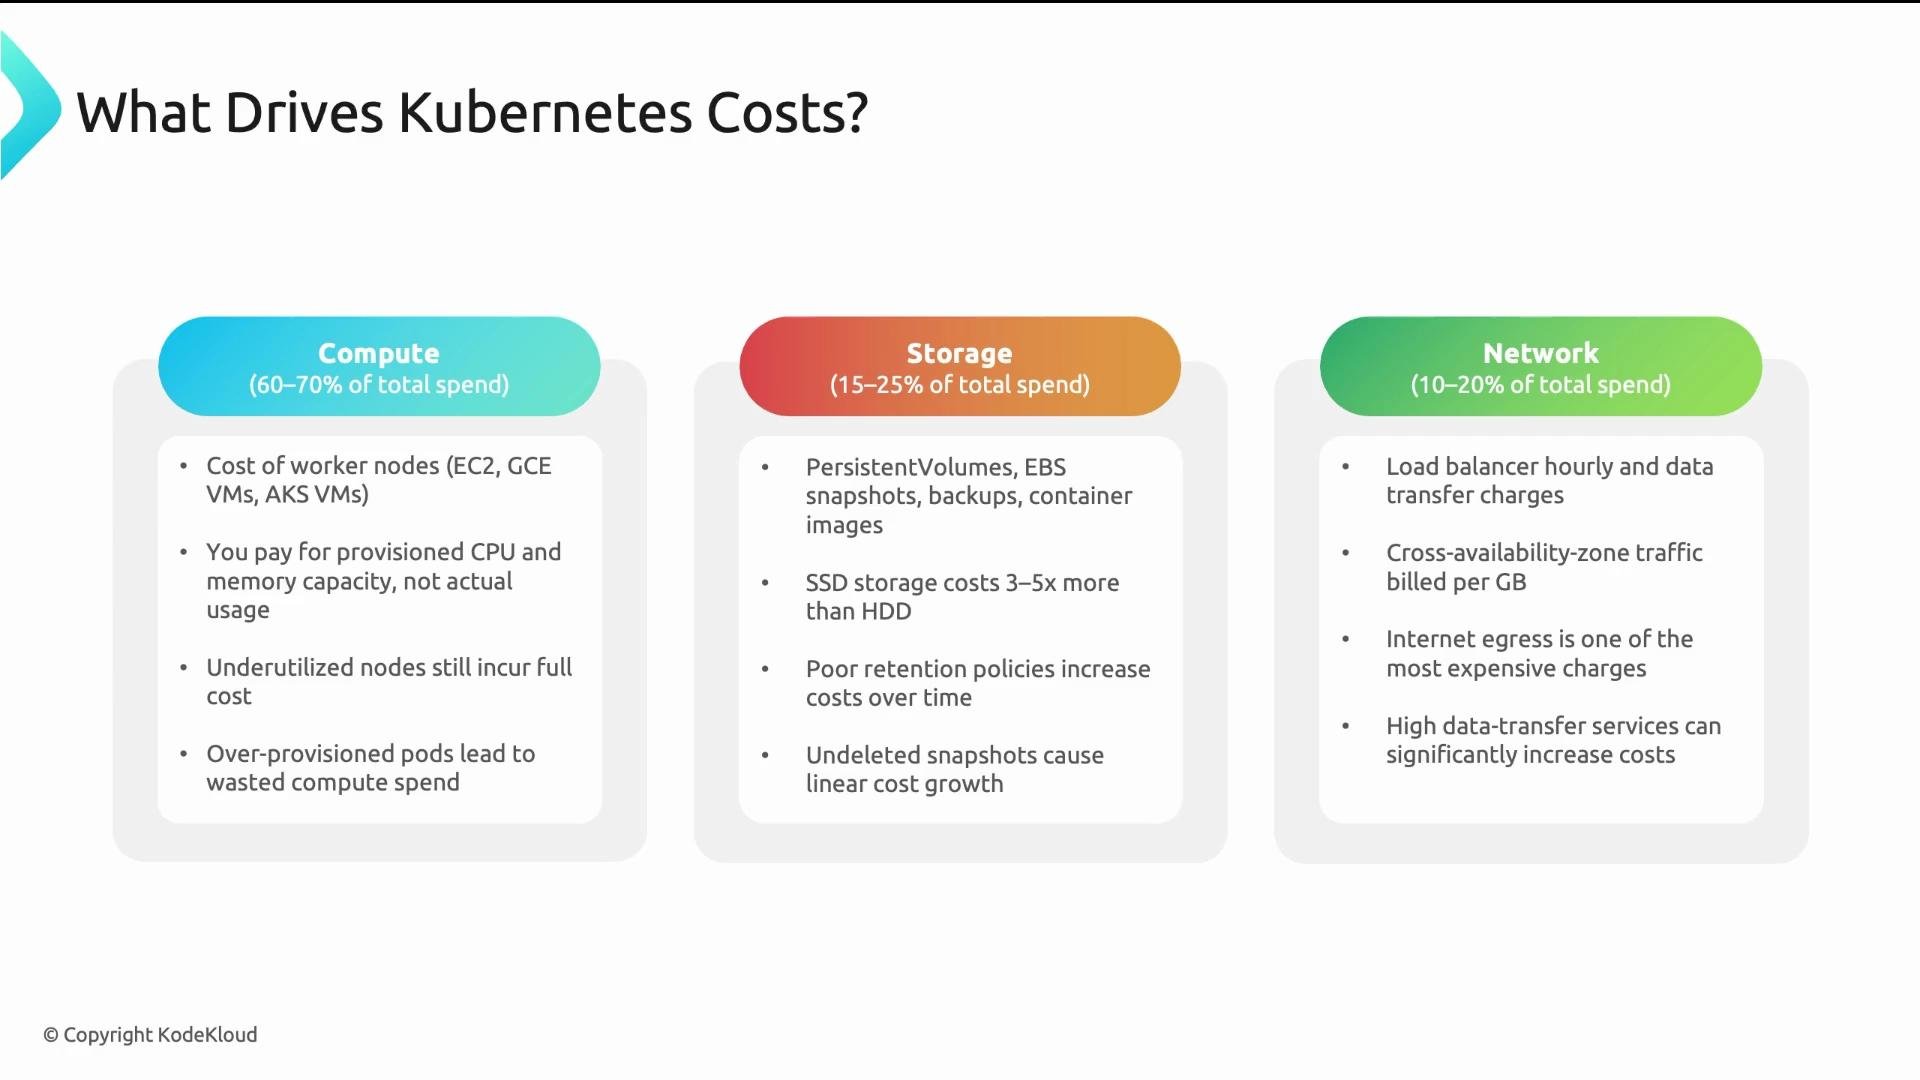
Kubernetes cloud spend generally falls into three primary categories. Prioritize efforts where dollars are concentrated to get the highest ROI.
| Category | Typical share of spend | What to focus on |
| --------------- | ---------------------: | ------------------------------------------------------------------------------------------------------------------- |
| Compute (nodes) | 60–70% | Pay-for-provisioned capacity. Address over-provisioned pods, right-size requests/limits, and use autoscaling. |
| Storage | 15–25% | Persistent volumes, snapshots, and storage class choices (SSD vs HDD). Clean up stale snapshots and unused volumes. |
| Network | 10–20% | Egress and cross-region transfer can be costly. Optimize data movement patterns and caching. |
## Major cost categories (and where to focus)
Kubernetes cloud spend generally falls into three primary categories. Prioritize efforts where dollars are concentrated to get the highest ROI.
| Category | Typical share of spend | What to focus on |
| --------------- | ---------------------: | ------------------------------------------------------------------------------------------------------------------- |
| Compute (nodes) | 60–70% | Pay-for-provisioned capacity. Address over-provisioned pods, right-size requests/limits, and use autoscaling. |
| Storage | 15–25% | Persistent volumes, snapshots, and storage class choices (SSD vs HDD). Clean up stale snapshots and unused volumes. |
| Network | 10–20% | Egress and cross-region transfer can be costly. Optimize data movement patterns and caching. |
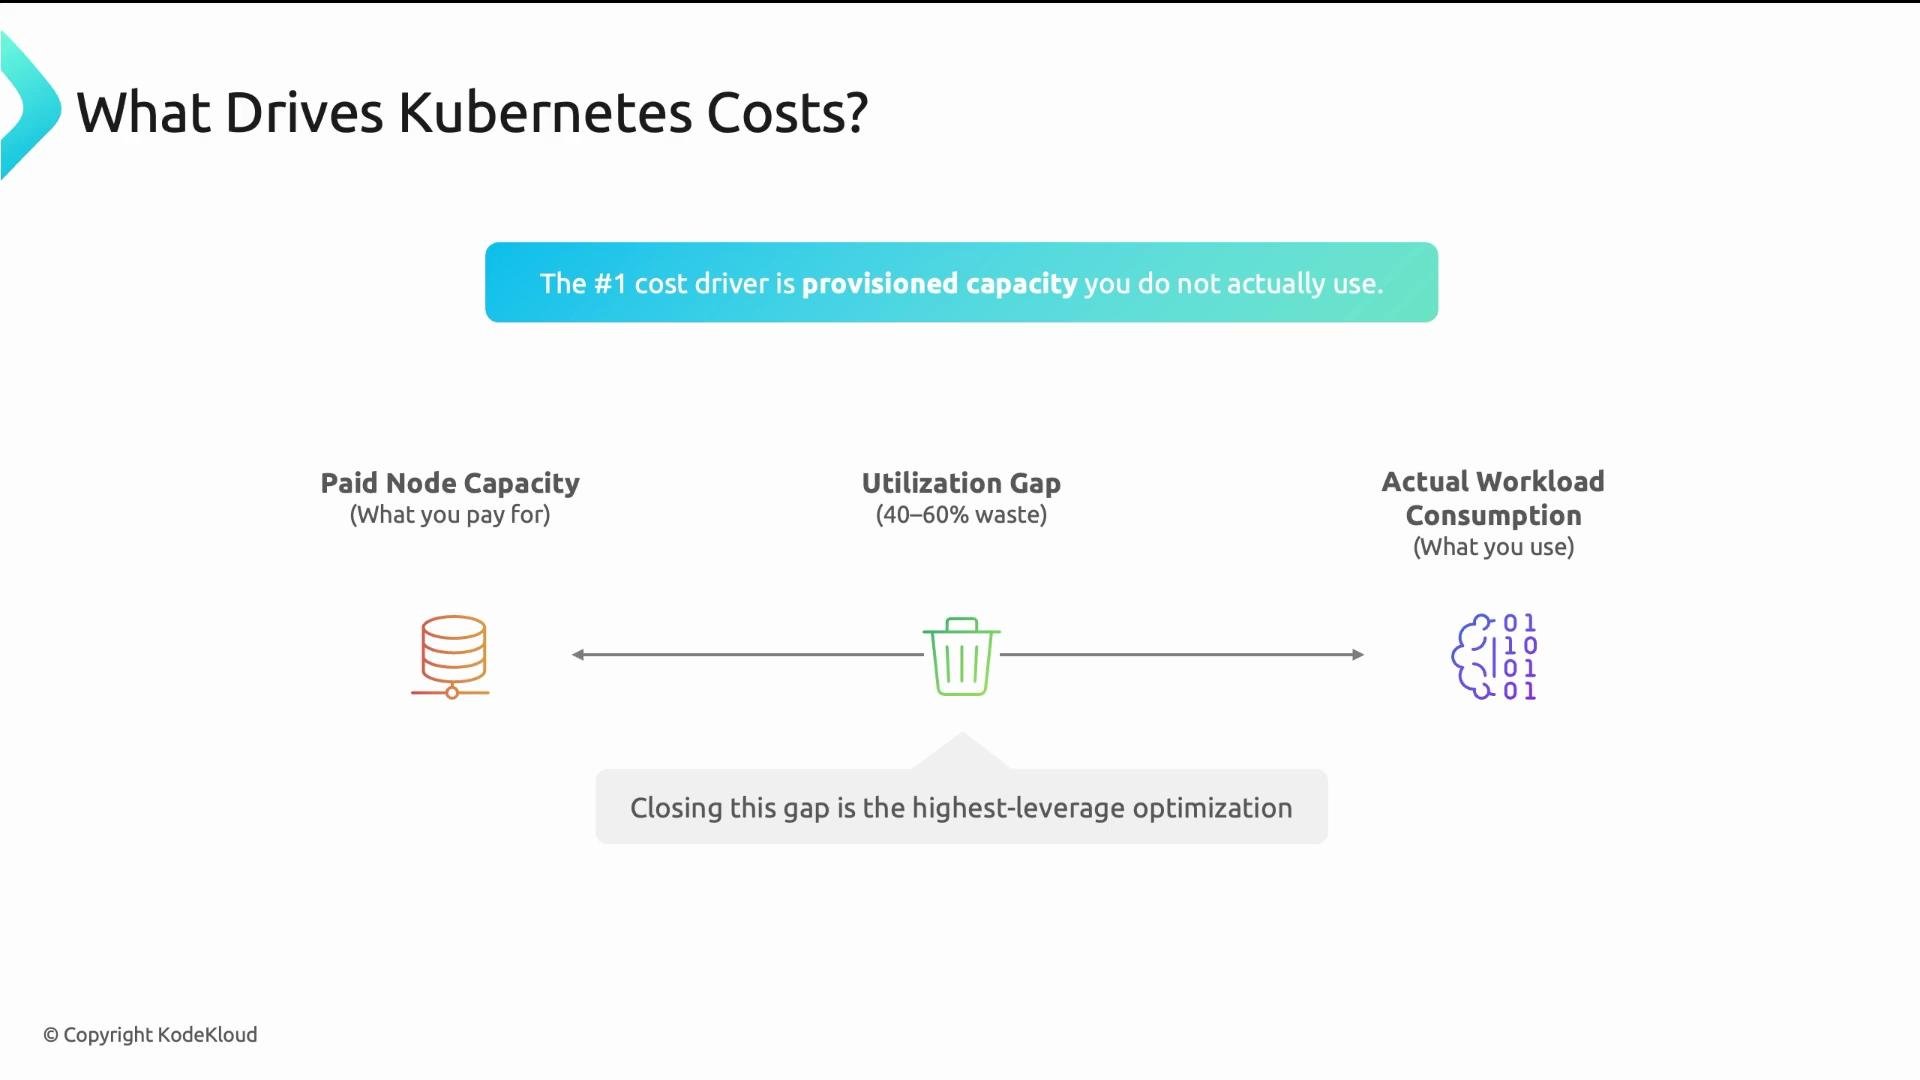
 The single largest cost driver is provisioned capacity you do not actually use — the gap between what you pay for (node capacity) and what workloads consume. In many organizations that utilization gap represents 40–60% waste. Closing that gap is the highest-leverage optimization.
 ## The visibility gap: cloud bill vs platform usage
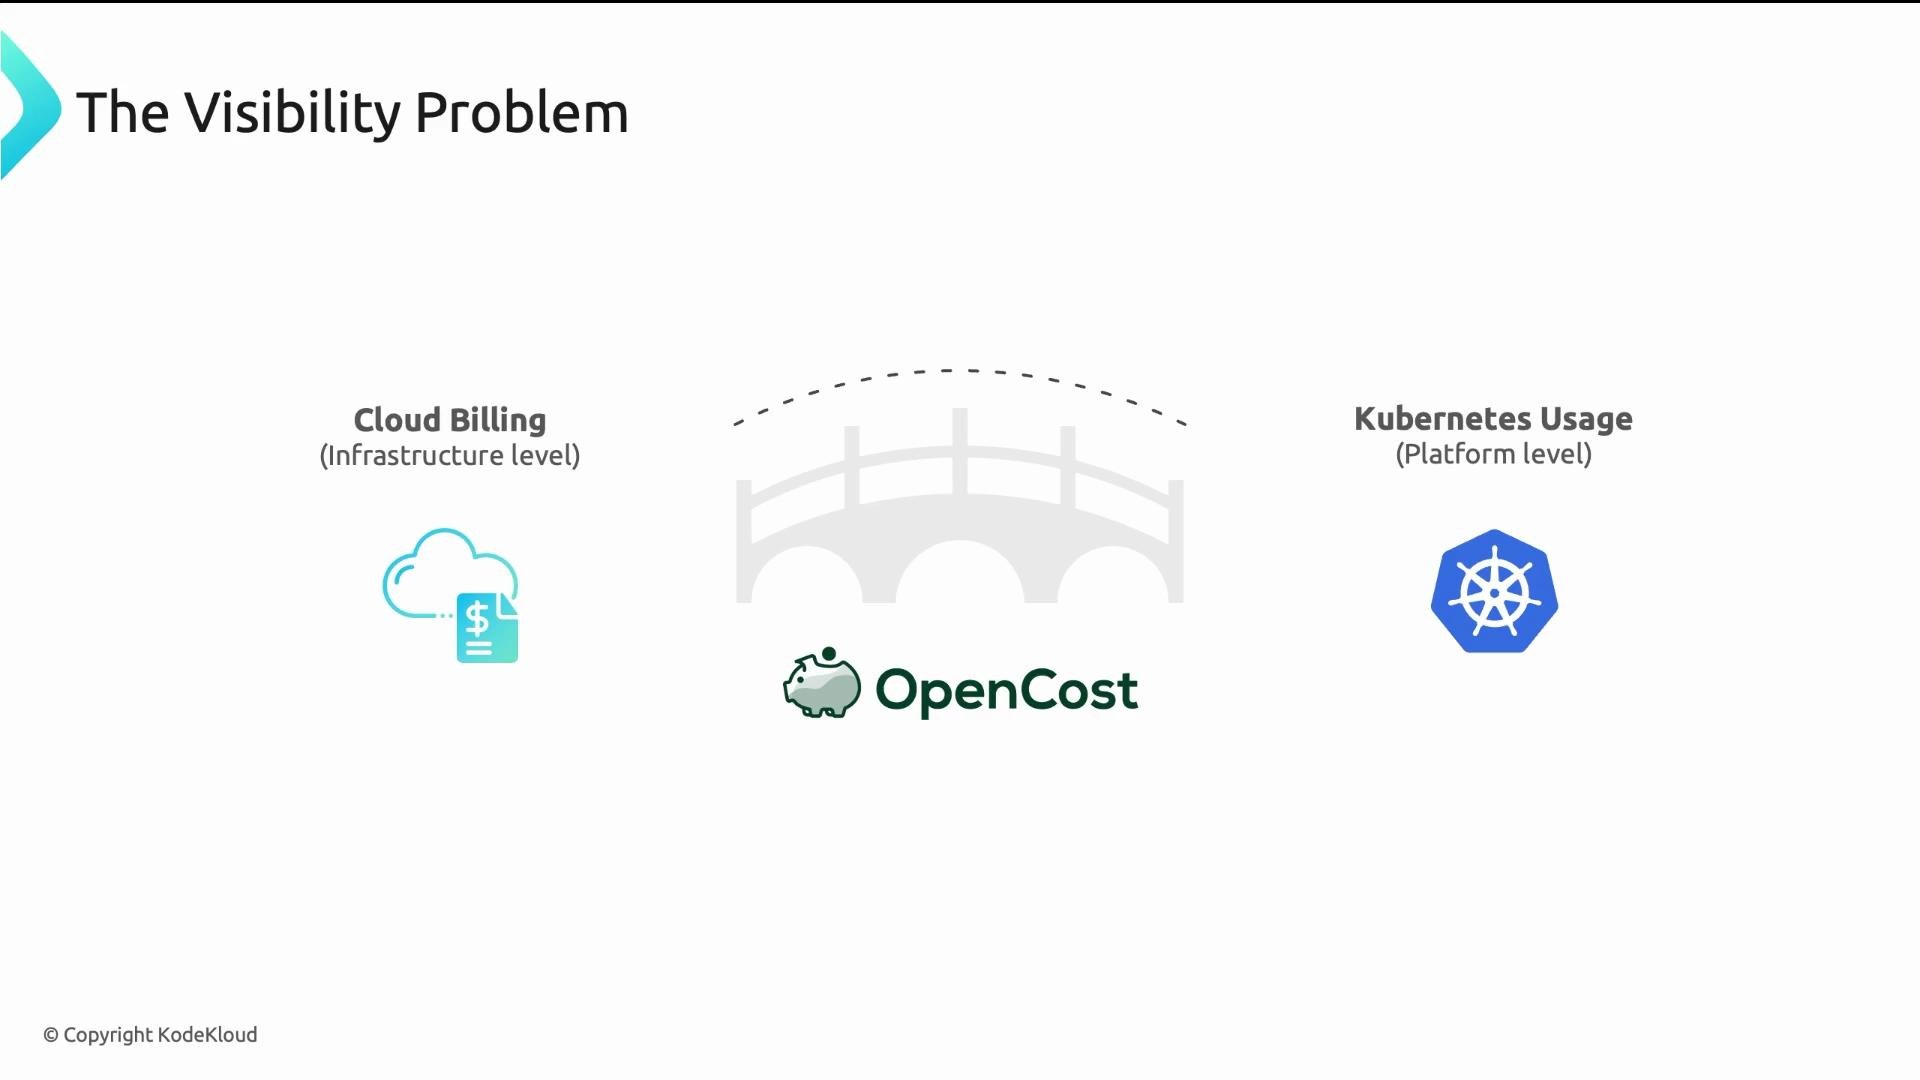
The cloud bill shows dollars by account, service, and line item — not by namespace, team, or workload. That mismatch is the visibility gap: finance sees charges, platform engineers see Kubernetes constructs, and neither can easily attribute dollars to business units.
Typical questions to answer:
| Question | Example |
| -------------------------------------- | -------------------------------------------------- |
| How much is a team costing us? | Payments team: `team=payments` |
| Which namespace wastes the most? | Look for low-efficiency namespaces in cost reports |
| Over-provisioned or under-provisioned? | Compare requested resources vs actual usage |
Bridging this gap requires a tool that understands cloud pricing and Kubernetes resource models. OpenCost is one such open-source solution.
## The visibility gap: cloud bill vs platform usage
The cloud bill shows dollars by account, service, and line item — not by namespace, team, or workload. That mismatch is the visibility gap: finance sees charges, platform engineers see Kubernetes constructs, and neither can easily attribute dollars to business units.
Typical questions to answer:
| Question | Example |
| -------------------------------------- | -------------------------------------------------- |
| How much is a team costing us? | Payments team: `team=payments` |
| Which namespace wastes the most? | Look for low-efficiency namespaces in cost reports |
| Over-provisioned or under-provisioned? | Compare requested resources vs actual usage |
Bridging this gap requires a tool that understands cloud pricing and Kubernetes resource models. OpenCost is one such open-source solution.
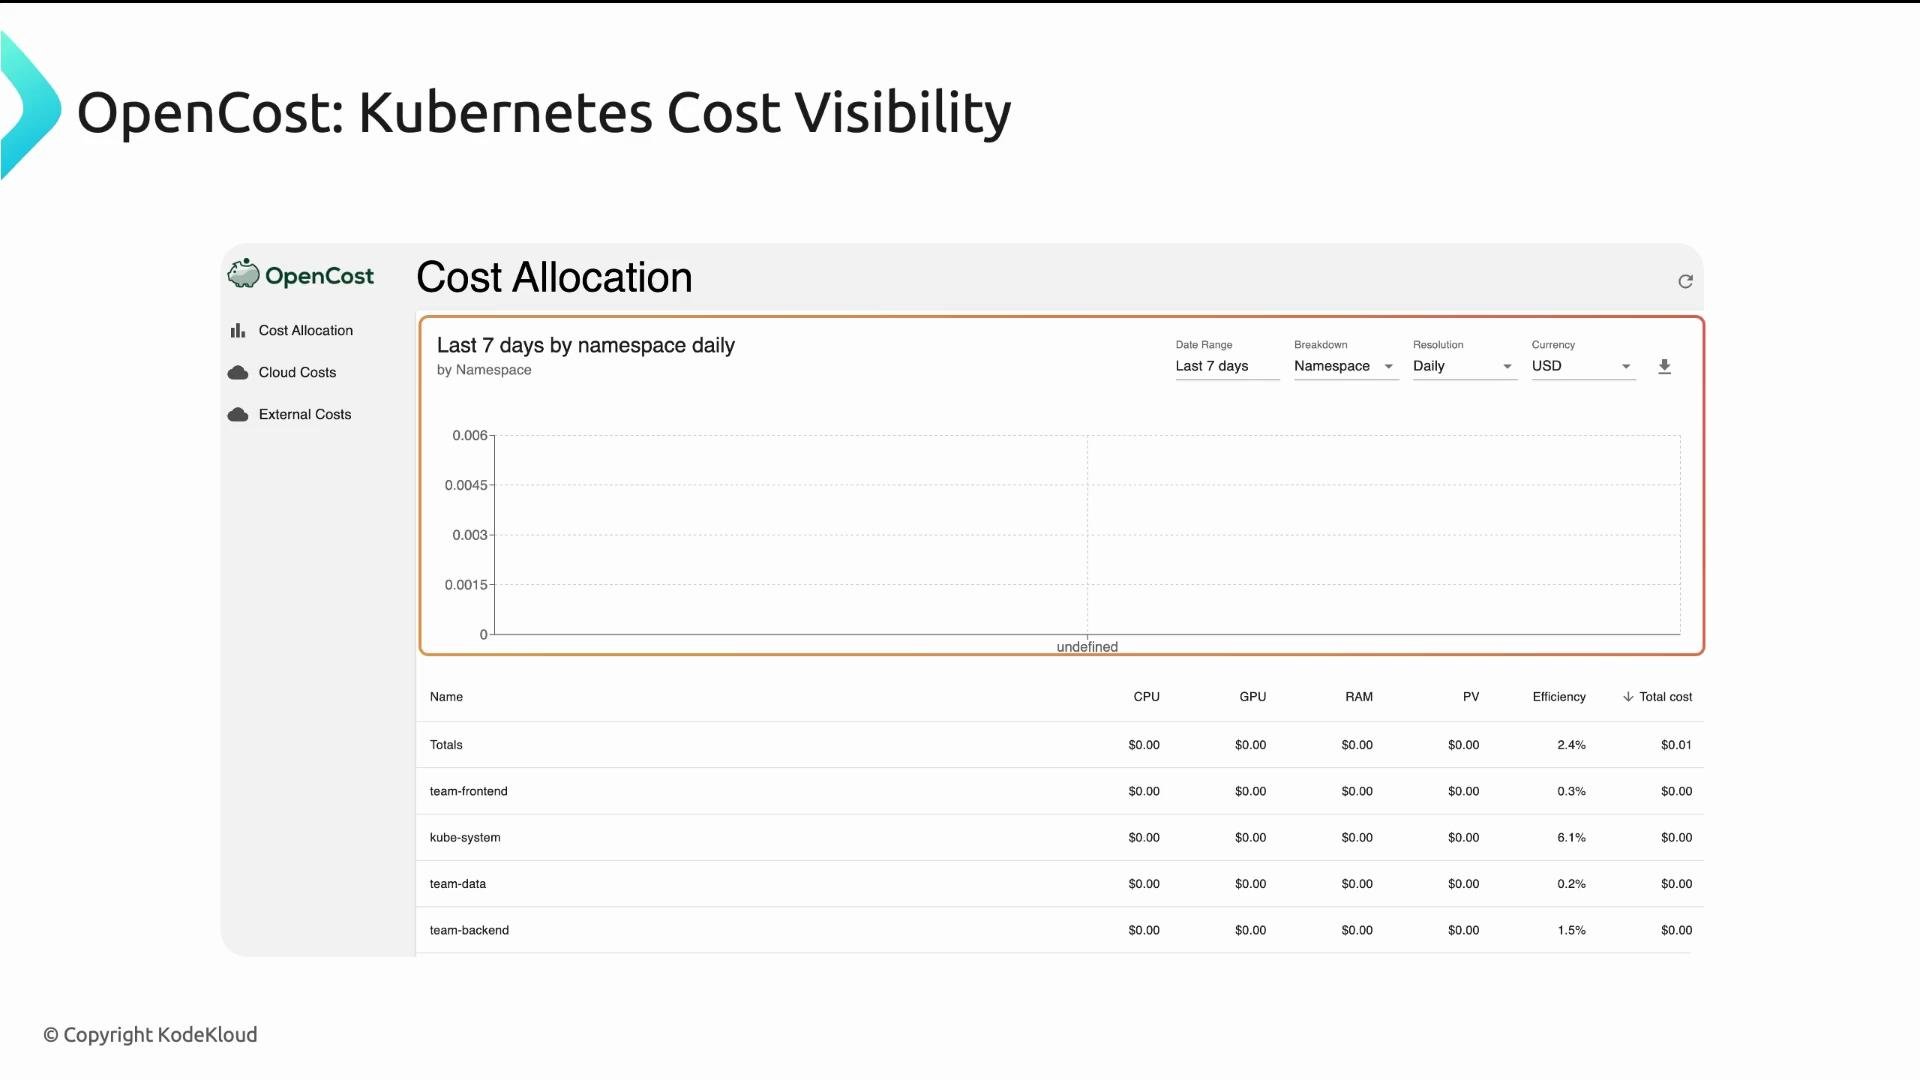
 [OpenCost](https://opencost.io) is an open-source, vendor-neutral project (CNCF incubating) that maps Kubernetes usage to cloud pricing so you can attribute dollars to namespaces, labels, and pods.
## OpenCost overview: how it works and what it provides
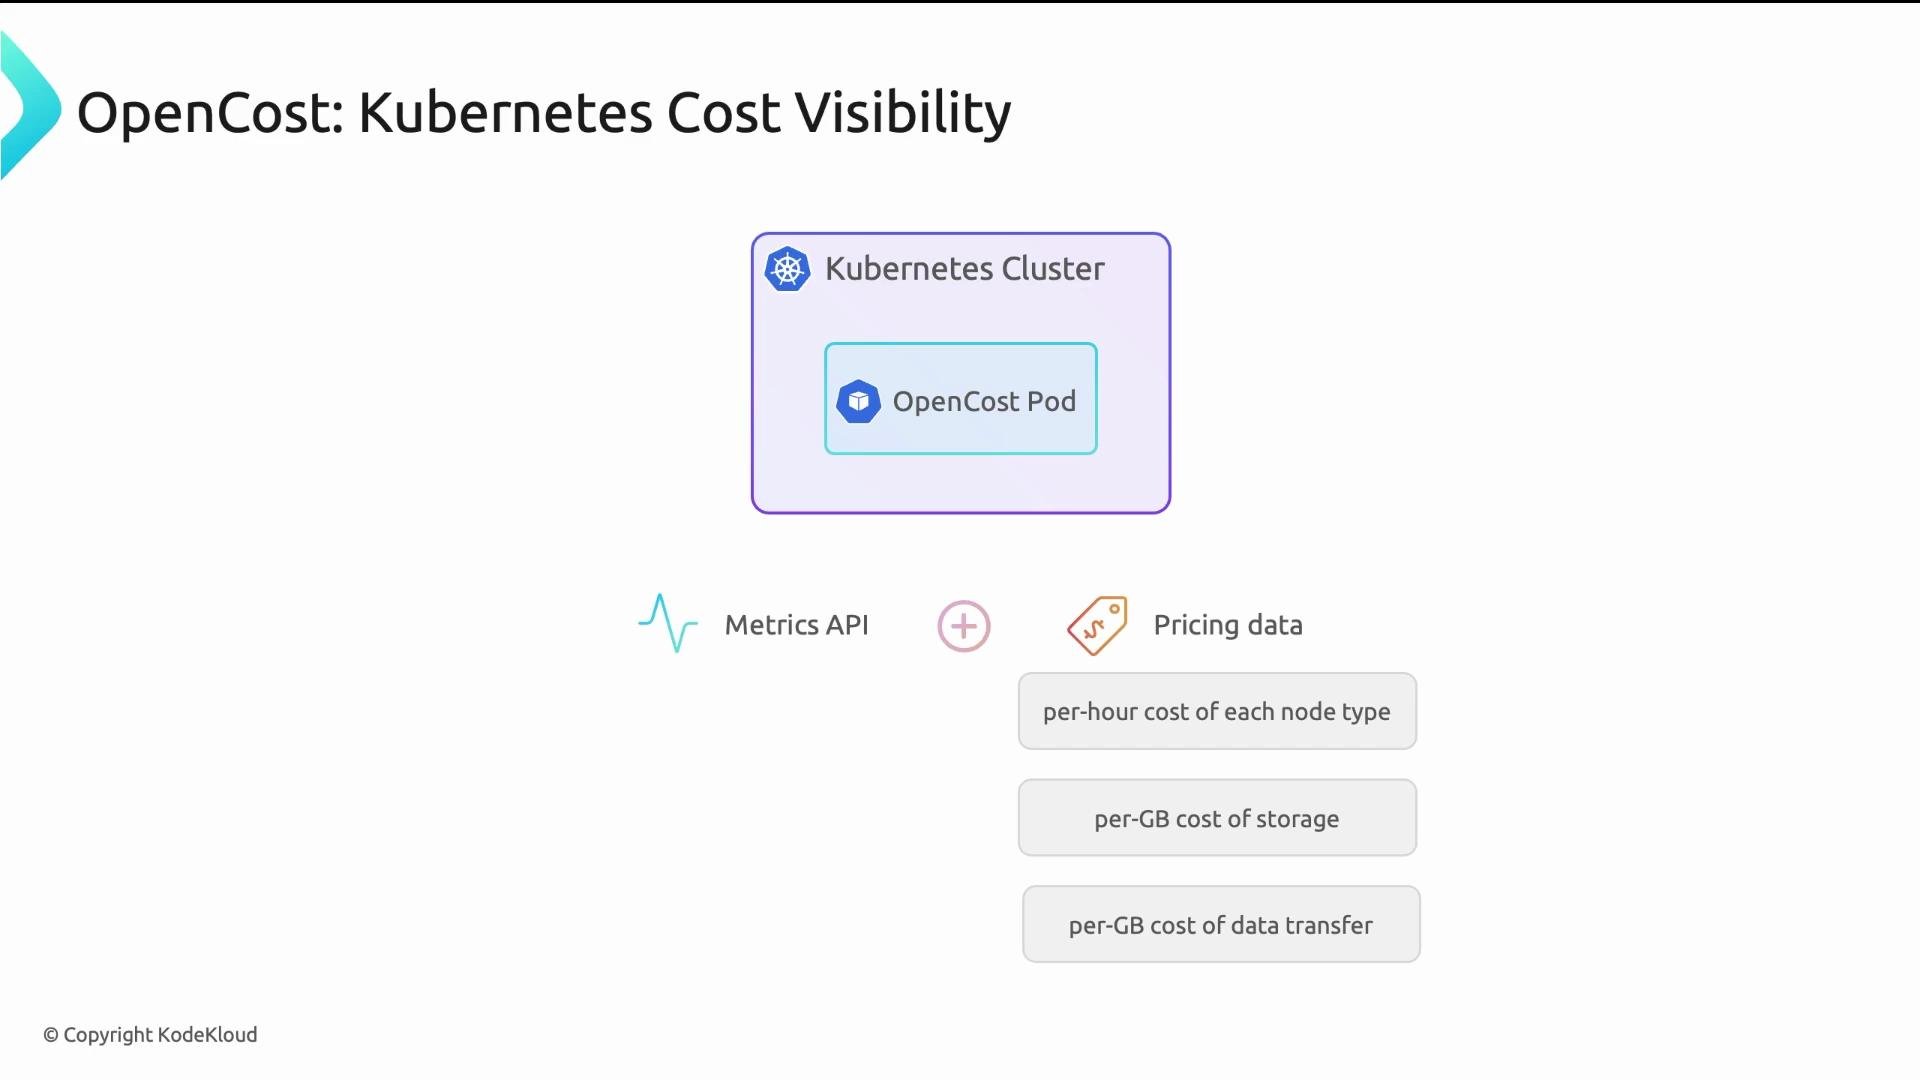
OpenCost runs inside Kubernetes as a set of pods. It scrapes usage from the Kubernetes Metrics API or Prometheus, overlays cloud pricing, and produces dollar-based allocations.
[OpenCost](https://opencost.io) is an open-source, vendor-neutral project (CNCF incubating) that maps Kubernetes usage to cloud pricing so you can attribute dollars to namespaces, labels, and pods.
## OpenCost overview: how it works and what it provides
OpenCost runs inside Kubernetes as a set of pods. It scrapes usage from the Kubernetes Metrics API or Prometheus, overlays cloud pricing, and produces dollar-based allocations.
 What OpenCost gives you (three core capabilities):
1. Cost allocation by namespace or label
* Attributes node, storage, and network costs to namespaces/labels according to pod consumption. Example: if a node costs $1,000/month and a team's pods consume 10% of that node, the team is allocated $100/month.
2. Resource-efficiency metrics
* Shows CPU/memory utilization vs requests so you can surface over-provisioned (waste) and under-provisioned (risk) workloads.
3. Real-time and historical data
* Time-series cost trends and anomaly detection (e.g., sudden spikes or month-over-month growth).
What OpenCost gives you (three core capabilities):
1. Cost allocation by namespace or label
* Attributes node, storage, and network costs to namespaces/labels according to pod consumption. Example: if a node costs $1,000/month and a team's pods consume 10% of that node, the team is allocated $100/month.
2. Resource-efficiency metrics
* Shows CPU/memory utilization vs requests so you can surface over-provisioned (waste) and under-provisioned (risk) workloads.
3. Real-time and historical data
* Time-series cost trends and anomaly detection (e.g., sudden spikes or month-over-month growth).
 ## How OpenCost calculates costs
OpenCost follows a simple three-step model to turn metrics into dollars:
1. Get cloud pricing
* Derive per-CPU-hour and per-GB-hour node costs (and storage/network rates) using cloud provider pricing.
2. Measure pod resource usage
* Collect actual CPU/memory usage. OpenCost charges the higher of the pod's request or its actual usage so both waste and risk are visible.
3. Aggregate by namespace or label
* Sum pod-level costs into namespace/label totals (for example, all pods labeled `team=payments`).
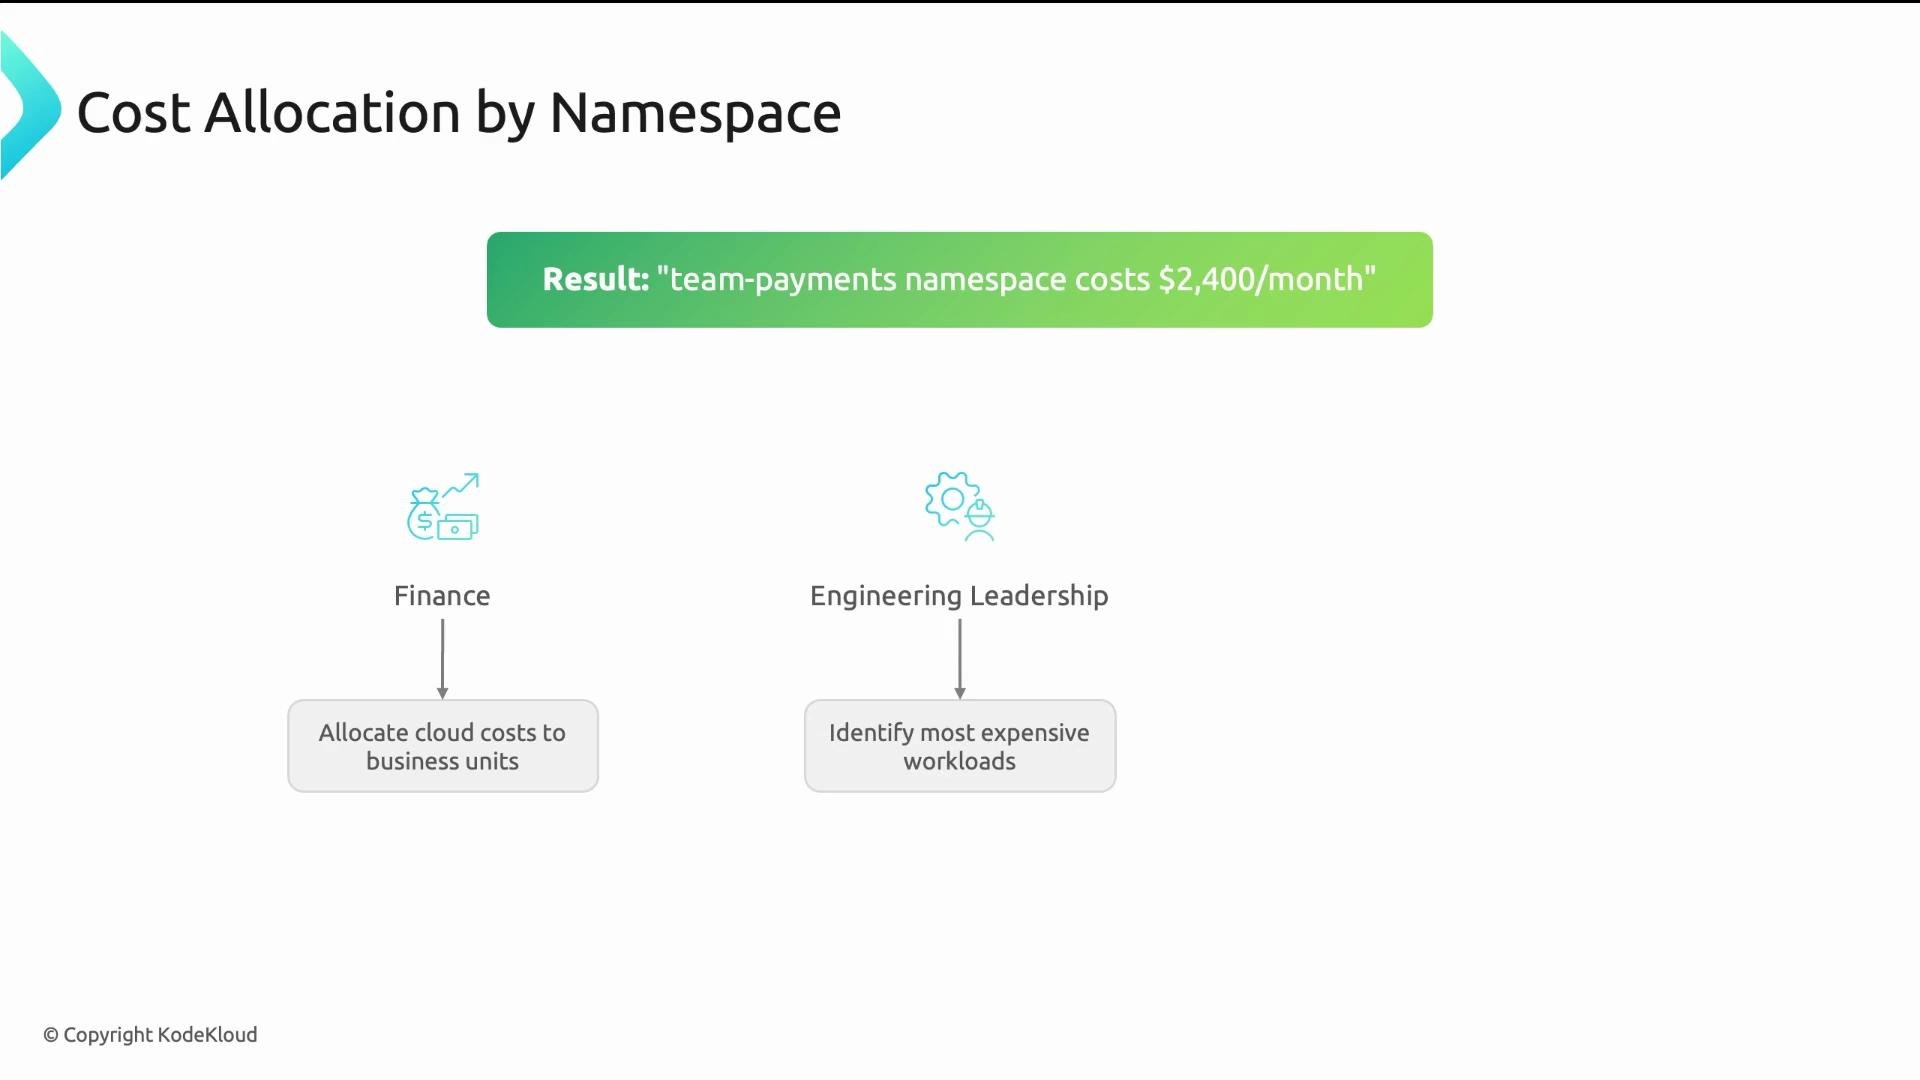
The result is a concrete allocation such as: the Payments namespace costs \$2,400/month — which closes the visibility gap and enables finance and engineering to act.
## How OpenCost calculates costs
OpenCost follows a simple three-step model to turn metrics into dollars:
1. Get cloud pricing
* Derive per-CPU-hour and per-GB-hour node costs (and storage/network rates) using cloud provider pricing.
2. Measure pod resource usage
* Collect actual CPU/memory usage. OpenCost charges the higher of the pod's request or its actual usage so both waste and risk are visible.
3. Aggregate by namespace or label
* Sum pod-level costs into namespace/label totals (for example, all pods labeled `team=payments`).
The result is a concrete allocation such as: the Payments namespace costs \$2,400/month — which closes the visibility gap and enables finance and engineering to act.
 ## Efficiency metric and the target zone
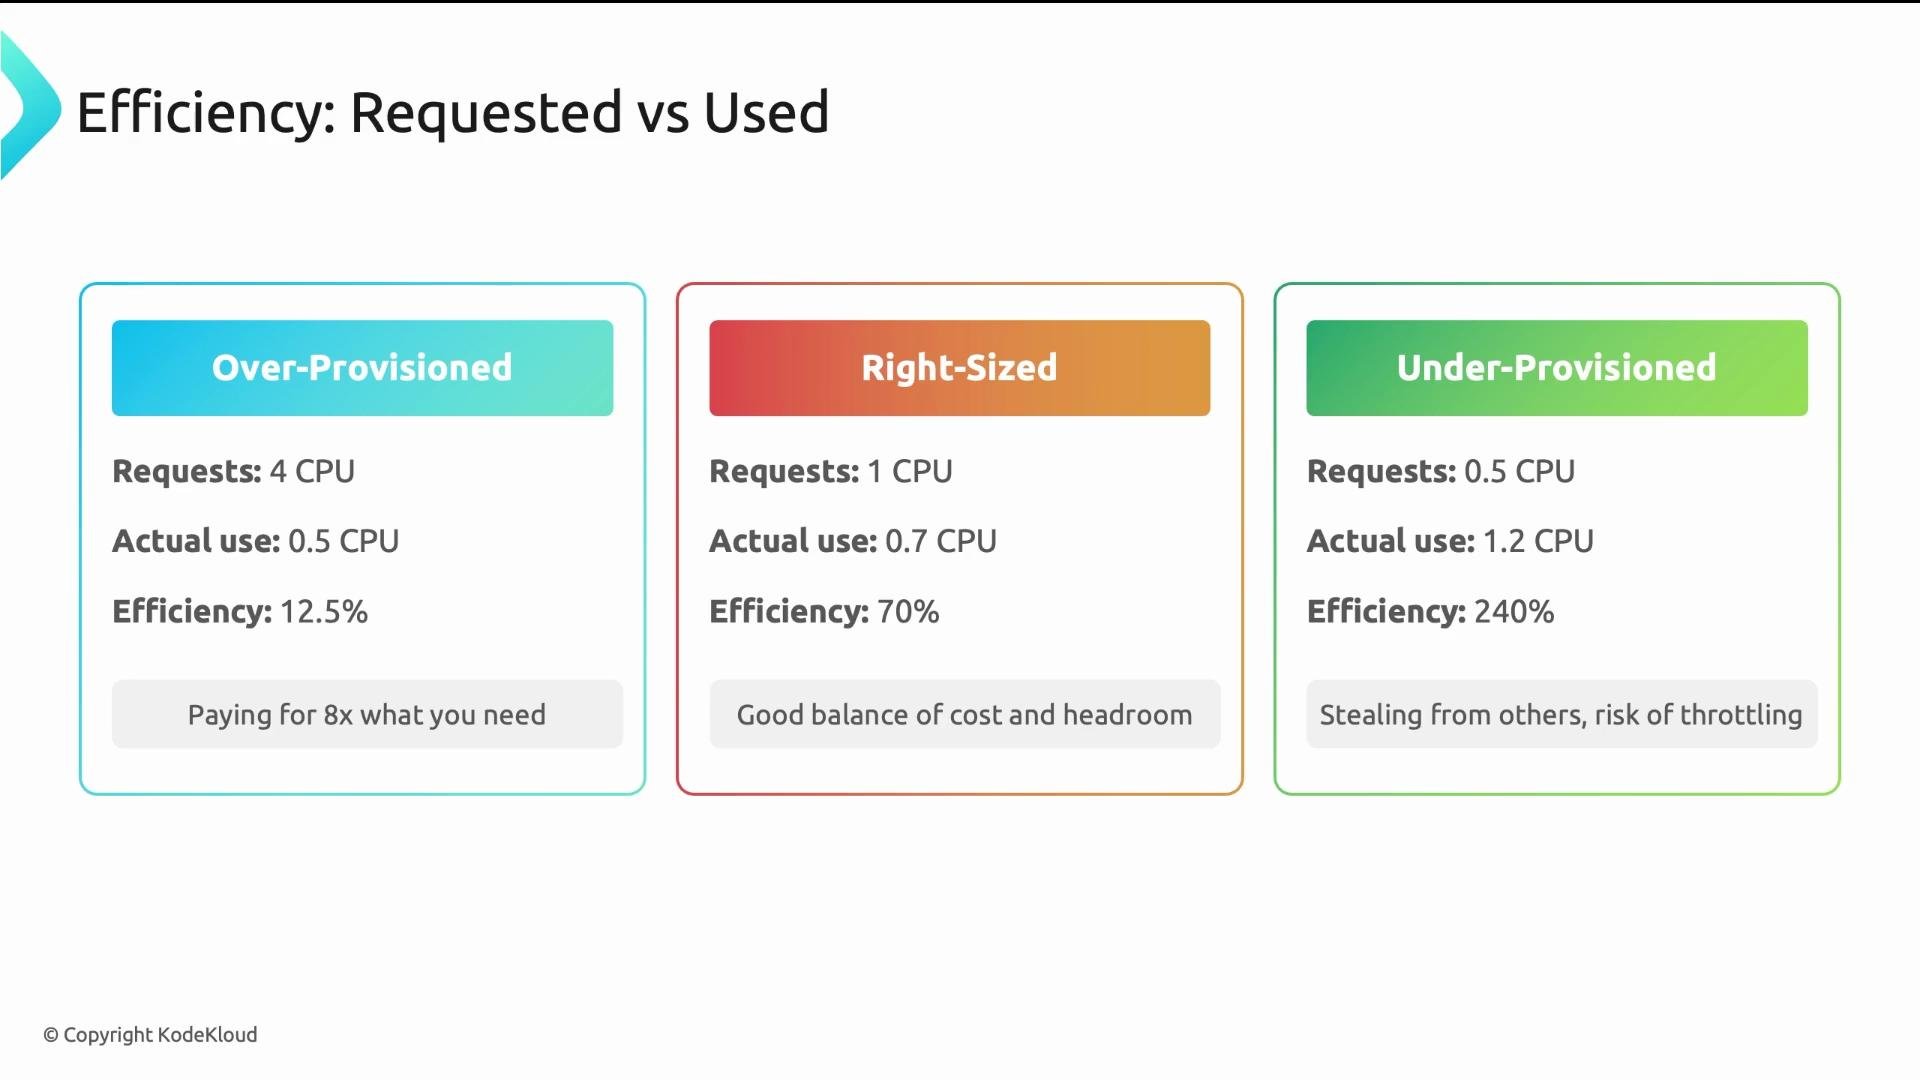
OpenCost computes efficiency as actual usage divided by requests. Interpretations:
* Over-provisioned: Low efficiency (e.g., 12.5%). Large waste — you're paying for far more than you need.
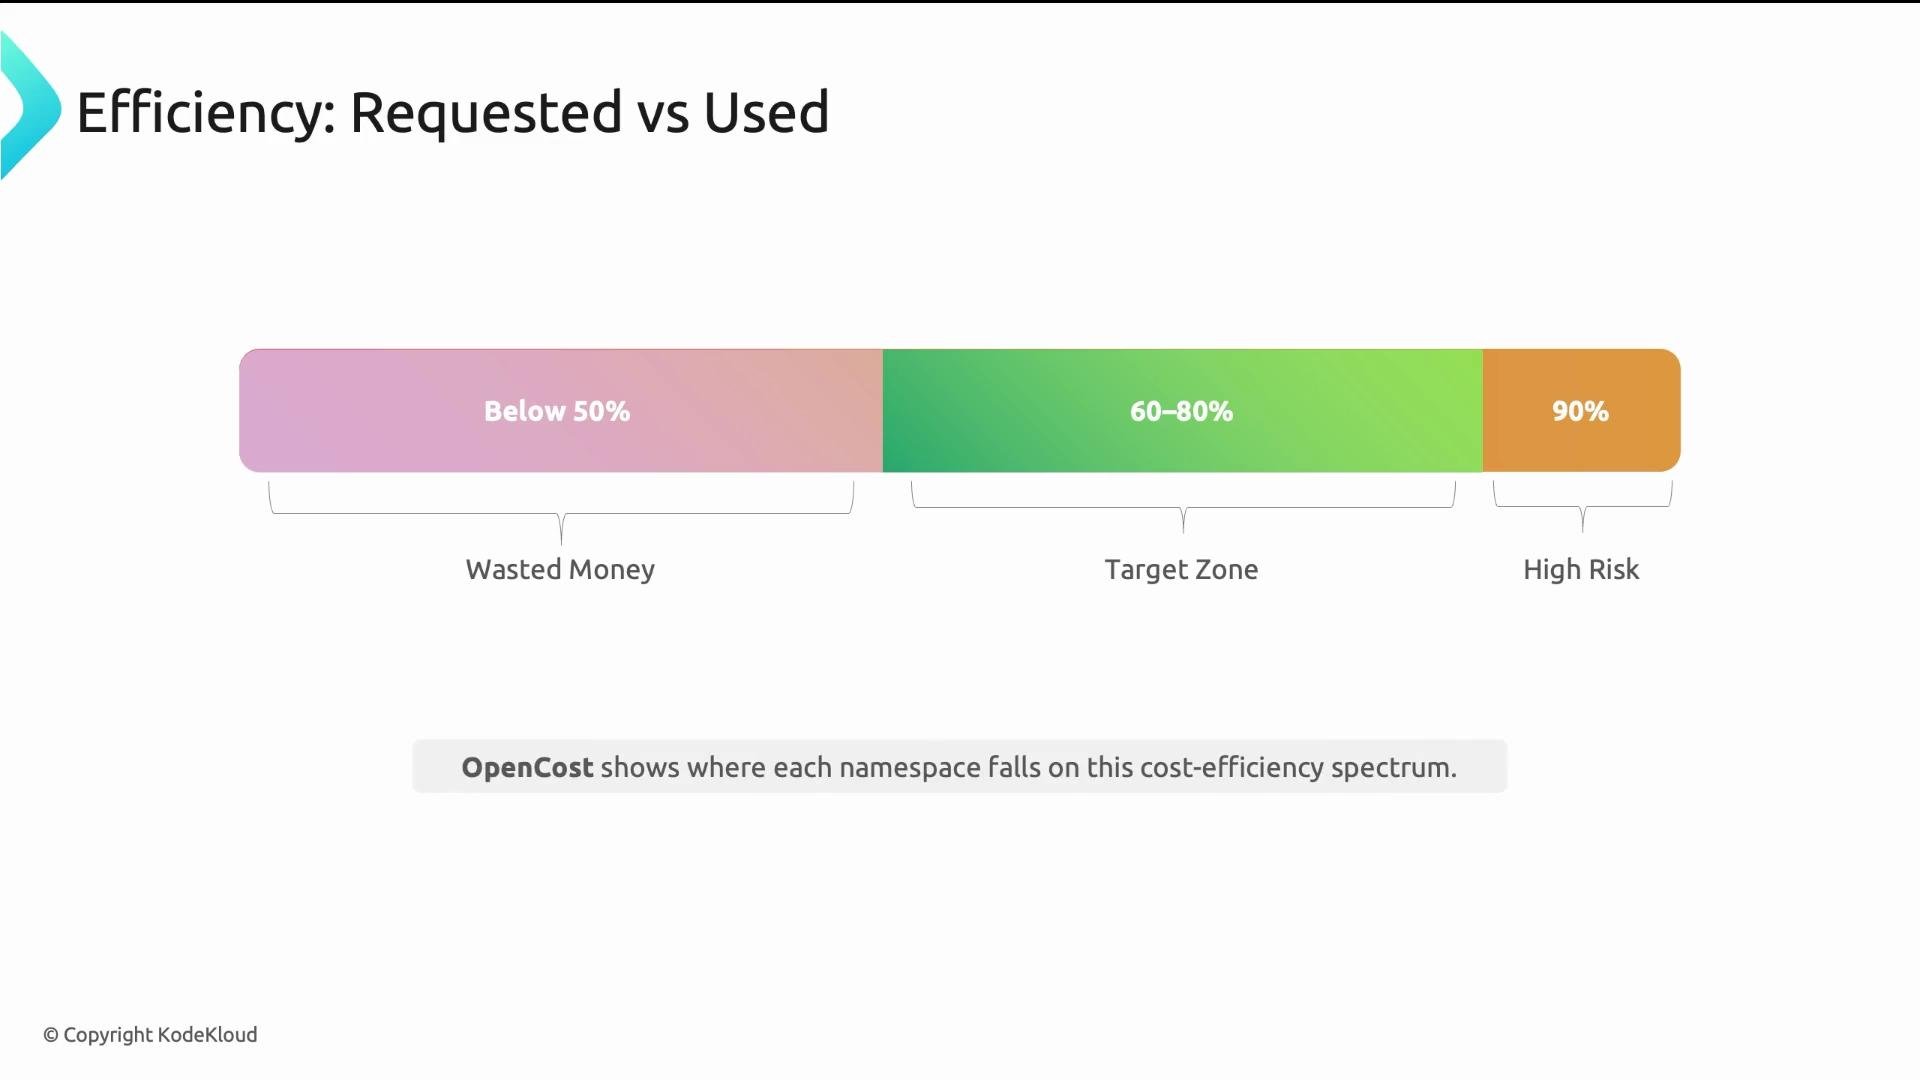
* Right-sized: Efficiency \~60–80% — the recommended target zone balancing cost and headroom for spikes.
* Under-provisioned: Efficiency >100% (e.g., 240%) — the pod is using more than requested and may cause throttling or OOM kills.
Aim for the 60–80% band. Below 50% indicates significant waste; above 90% suggests little headroom and higher operational risk. The right-sizing workflow looks like: profile usage, set requests near the 95th percentile, and target the 60–80% efficiency band.
## Efficiency metric and the target zone
OpenCost computes efficiency as actual usage divided by requests. Interpretations:
* Over-provisioned: Low efficiency (e.g., 12.5%). Large waste — you're paying for far more than you need.
* Right-sized: Efficiency \~60–80% — the recommended target zone balancing cost and headroom for spikes.
* Under-provisioned: Efficiency >100% (e.g., 240%) — the pod is using more than requested and may cause throttling or OOM kills.
Aim for the 60–80% band. Below 50% indicates significant waste; above 90% suggests little headroom and higher operational risk. The right-sizing workflow looks like: profile usage, set requests near the 95th percentile, and target the 60–80% efficiency band.
 Be careful when right-sizing: aggressive reductions can cause production outages. Always validate changes in a staging or canary environment and combine metrics with business context.
## How to reduce costs — an operational roadmap
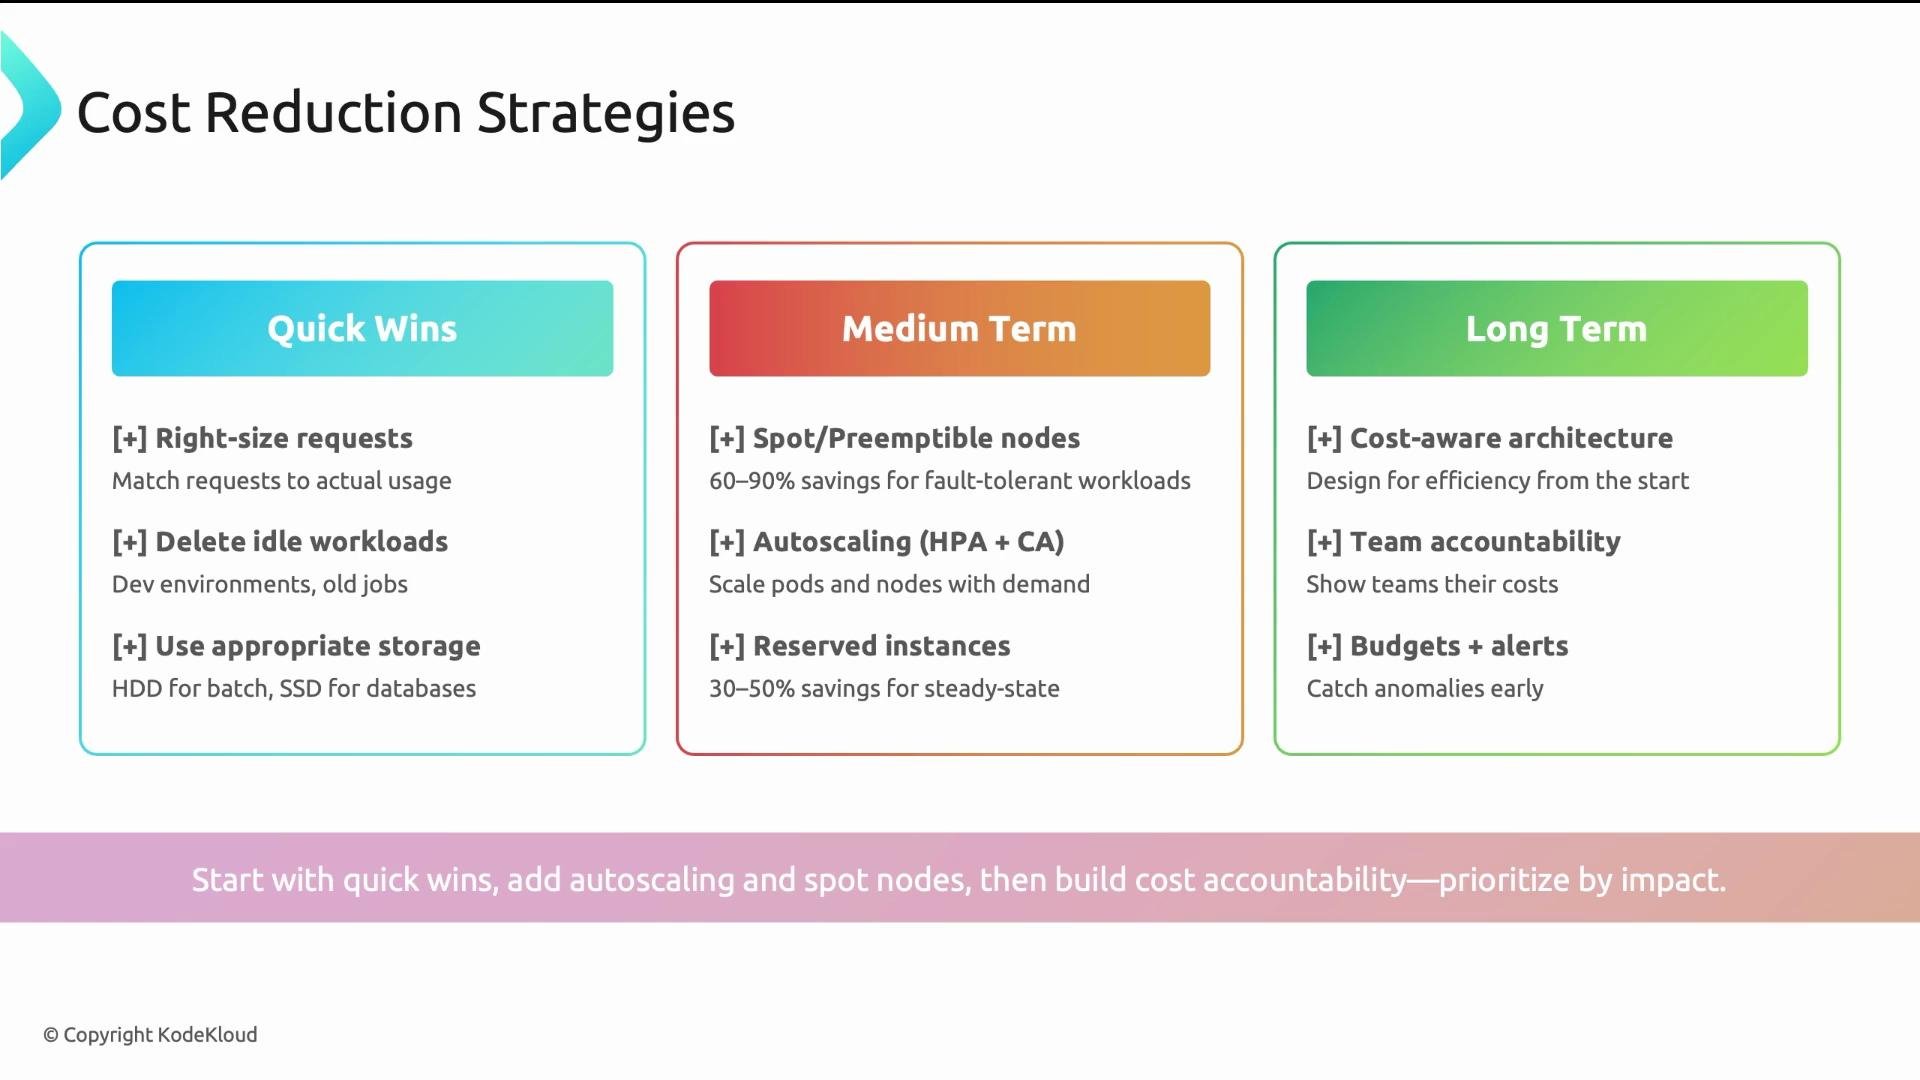
Cost reduction is continuous. Organize efforts across short, medium, and long horizons and prioritize by dollar impact (start with compute/node costs).
| Horizon | Actions | Typical impact |
| ------------------------ | ------------------------------------------------------------------------------------------------------------------------------------------ | -------------------------------------------- |
| Quick wins (this week) | Right-size requests from observed usage; kill idle dev environments; move non-critical batch jobs to HDD | 20–40% reductions are common |
| Medium-term (this month) | Use spot/preemptible instances for tolerant workloads; tune HPA/VPA and cluster autoscaler | Significant recurring savings |
| Long-term (quarter-plus) | Build cost-accountability (show teams their costs, set budget alerts); implement quotas and guardrails; embed efficiency into architecture | Cultural and architectural savings over time |
Be careful when right-sizing: aggressive reductions can cause production outages. Always validate changes in a staging or canary environment and combine metrics with business context.
## How to reduce costs — an operational roadmap
Cost reduction is continuous. Organize efforts across short, medium, and long horizons and prioritize by dollar impact (start with compute/node costs).
| Horizon | Actions | Typical impact |
| ------------------------ | ------------------------------------------------------------------------------------------------------------------------------------------ | -------------------------------------------- |
| Quick wins (this week) | Right-size requests from observed usage; kill idle dev environments; move non-critical batch jobs to HDD | 20–40% reductions are common |
| Medium-term (this month) | Use spot/preemptible instances for tolerant workloads; tune HPA/VPA and cluster autoscaler | Significant recurring savings |
| Long-term (quarter-plus) | Build cost-accountability (show teams their costs, set budget alerts); implement quotas and guardrails; embed efficiency into architecture | Cultural and architectural savings over time |
 Prioritize your top-dollar namespaces first (e.g., the ten costliest). Often, the biggest ROI comes from right-sizing those namespaces and removing idle nodes.
## Combine visibility with governance
Visibility plus governance creates sustainable cost control:
* Visibility (OpenCost): maps dollars to teams and workloads.
* Governance: quotas, limits, and automated policies prevent runaway consumption.
* Culture: show teams their costs and give them the tools to self-optimize.
When combined, these elements enable continuous cost optimization instead of reactive firefighting.
This concludes the module covering architecture, resources, multi-tenancy, governance, storage, networking, and cost.
## Links and references
* OpenCost: [https://opencost.io](https://opencost.io)
* Amazon EC2 docs: [https://learn.kodekloud.com/user/courses/amazon-elastic-compute-cloud-ec2](https://learn.kodekloud.com/user/courses/amazon-elastic-compute-cloud-ec2)
* Kubernetes docs: [https://kubernetes.io/docs/](https://kubernetes.io/docs/)
Prioritize your top-dollar namespaces first (e.g., the ten costliest). Often, the biggest ROI comes from right-sizing those namespaces and removing idle nodes.
## Combine visibility with governance
Visibility plus governance creates sustainable cost control:
* Visibility (OpenCost): maps dollars to teams and workloads.
* Governance: quotas, limits, and automated policies prevent runaway consumption.
* Culture: show teams their costs and give them the tools to self-optimize.
When combined, these elements enable continuous cost optimization instead of reactive firefighting.
This concludes the module covering architecture, resources, multi-tenancy, governance, storage, networking, and cost.
## Links and references
* OpenCost: [https://opencost.io](https://opencost.io)
* Amazon EC2 docs: [https://learn.kodekloud.com/user/courses/amazon-elastic-compute-cloud-ec2](https://learn.kodekloud.com/user/courses/amazon-elastic-compute-cloud-ec2)
* Kubernetes docs: [https://kubernetes.io/docs/](https://kubernetes.io/docs/)