> ## Documentation Index
> Fetch the complete documentation index at: https://notes.kodekloud.com/llms.txt
> Use this file to discover all available pages before exploring further.
# Tools for Observability
> Overview of observability tooling and platform engineering, mapping metrics logs traces to tools like OpenTelemetry Prometheus Grafana Loki Jaeger and eBPF.
Welcome back. This lesson connects the three core observability signals—metrics, logs, and traces—to the tooling platform teams commonly choose. It also explains why platform engineering prioritizes developer self-service, fast delivery, and effective troubleshooting.
Platform teams do more than run infrastructure: they deliver visibility across infrastructure and applications so teams can move quickly and recover fast. A documented, self-service path that takes code to production (the “golden path” or “paved road”) with appropriate safeguards improves both developer productivity and system reliability.
Example: Sparkle Pony Ranch needs a consistent observability platform that supports eight+ product teams so developers can focus on shipping features without worrying about telemetry plumbing.
## Foundational signals and categories
* Core signals: metrics, logs, and traces. Alerts are built on these signals (for example, Prometheus + Alertmanager) and events are typically annotations referencing those signals.
* The majority of tooling in modern platforms is CNCF/open source, though commercial SaaS and cloud-native managed services are common alternatives.
Table: Observability signals and common tool choices
| Signal | Common tools / patterns | When to use |
| - | - | - |
| Metrics | `Prometheus`, `VictoriaMetrics`, `Thanos`, `Cortex` | Service health, SLIs/ SLOs, high-cardinality time series queries |
| Logs | `ELK/EFK` (Elasticsearch, Logstash/Beats, Kibana), `OpenSearch`, `Loki`, `Fluentd`, `Fluent Bit`, `Vector` | Full-text search, debugging, forensic analysis |
| Traces | `OpenTelemetry`, `Jaeger`, `Zipkin`, commercial APMs | Distributed latency analysis, request flows across services |
| Profiling / Low-level | `Parca`, `Pyroscope`, `eBPF` tools | CPU/memory hotspots, continuous profiling |
| Visualization & Correlation | `Grafana` (dashboards & unified alerting) | Cross-signal dashboards and team views |
## OpenTelemetry (OTel)
[OpenTelemetry](https://opentelemetry.io/) is a CNCF project and a central piece of modern observability for platform engineering. It supports multi-signal telemetry (metrics, logs, traces), provides SDKs and auto-instrumentation for many runtimes, and includes the OpenTelemetry Collector to receive, transform, and export telemetry to many backends. OTel is vendor-agnostic and helps avoid vendor lock-in through standardized instrumentation.
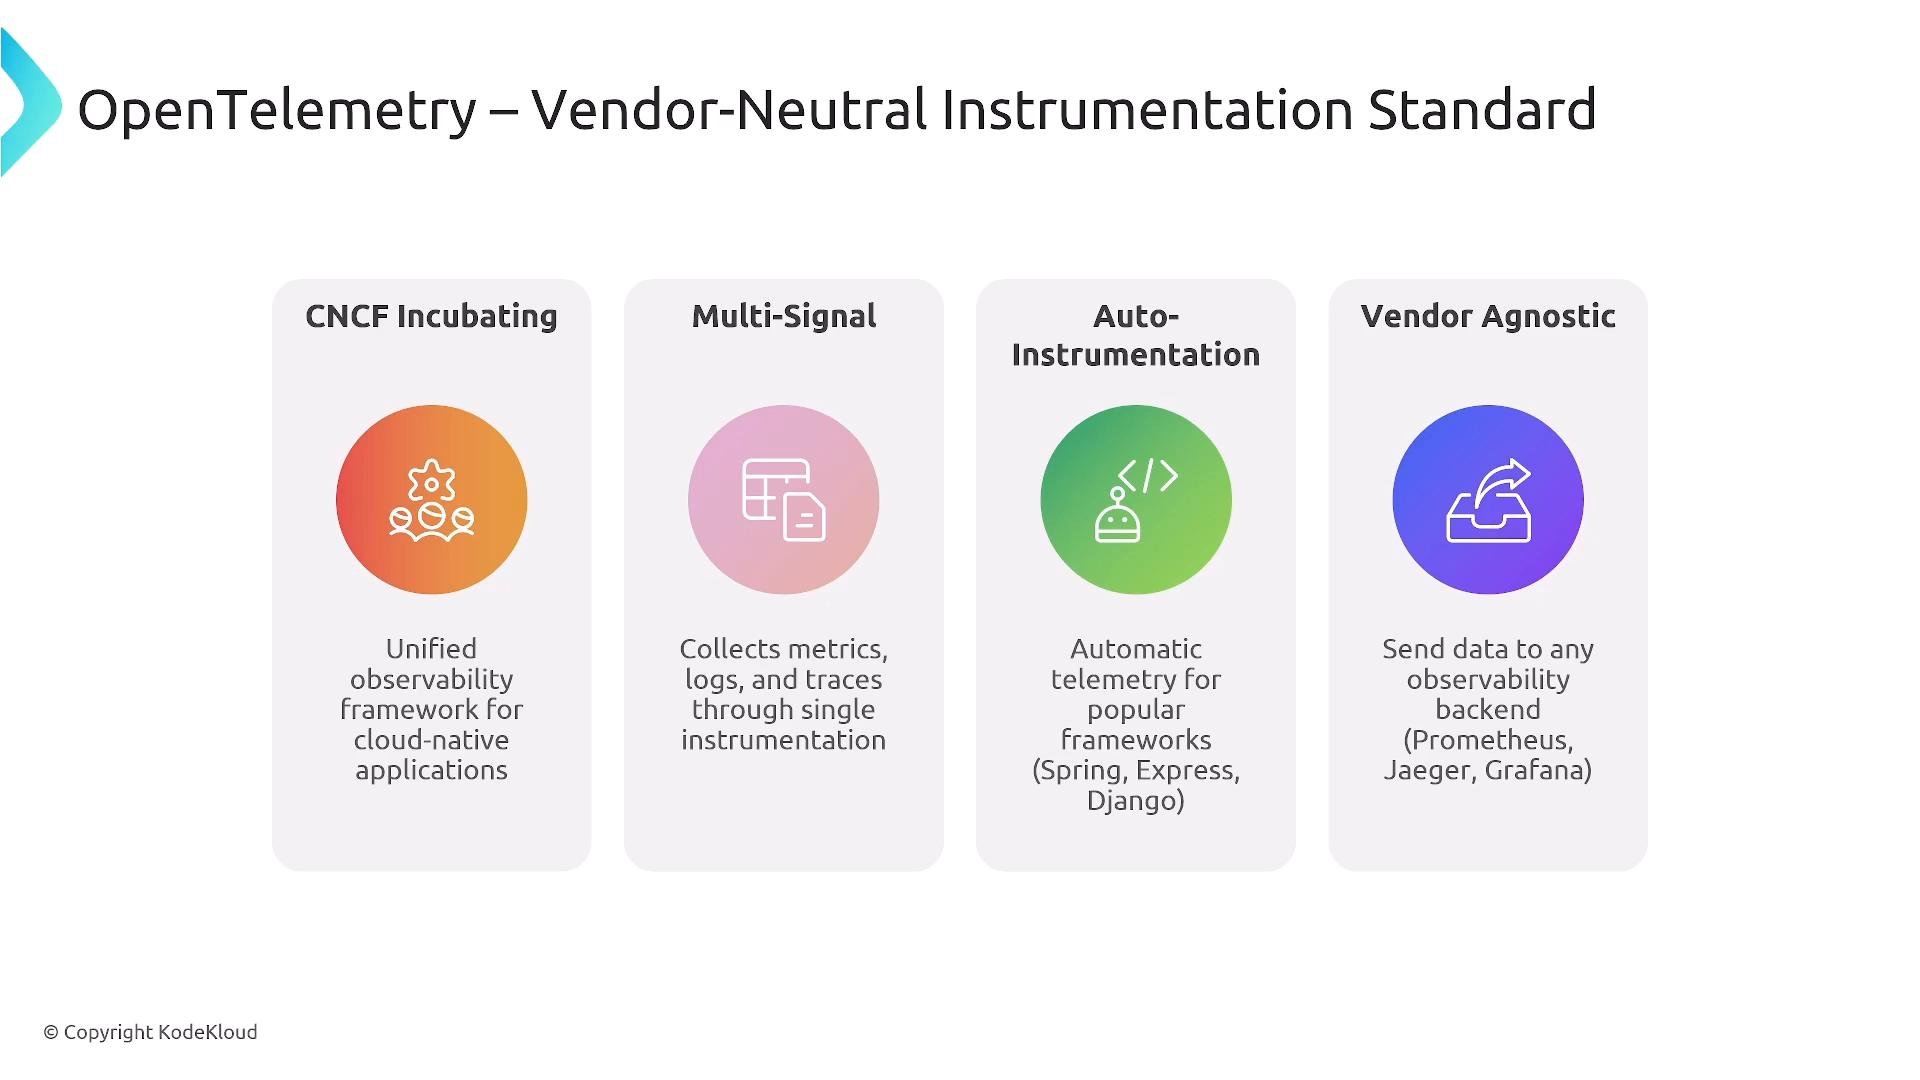 OpenTelemetry enables an “instrument once, export anywhere” model: auto-instrumentation and collectors let platform teams provide telemetry automatically while keeping the backend flexible.
## Metrics: Prometheus and the metrics ecosystem
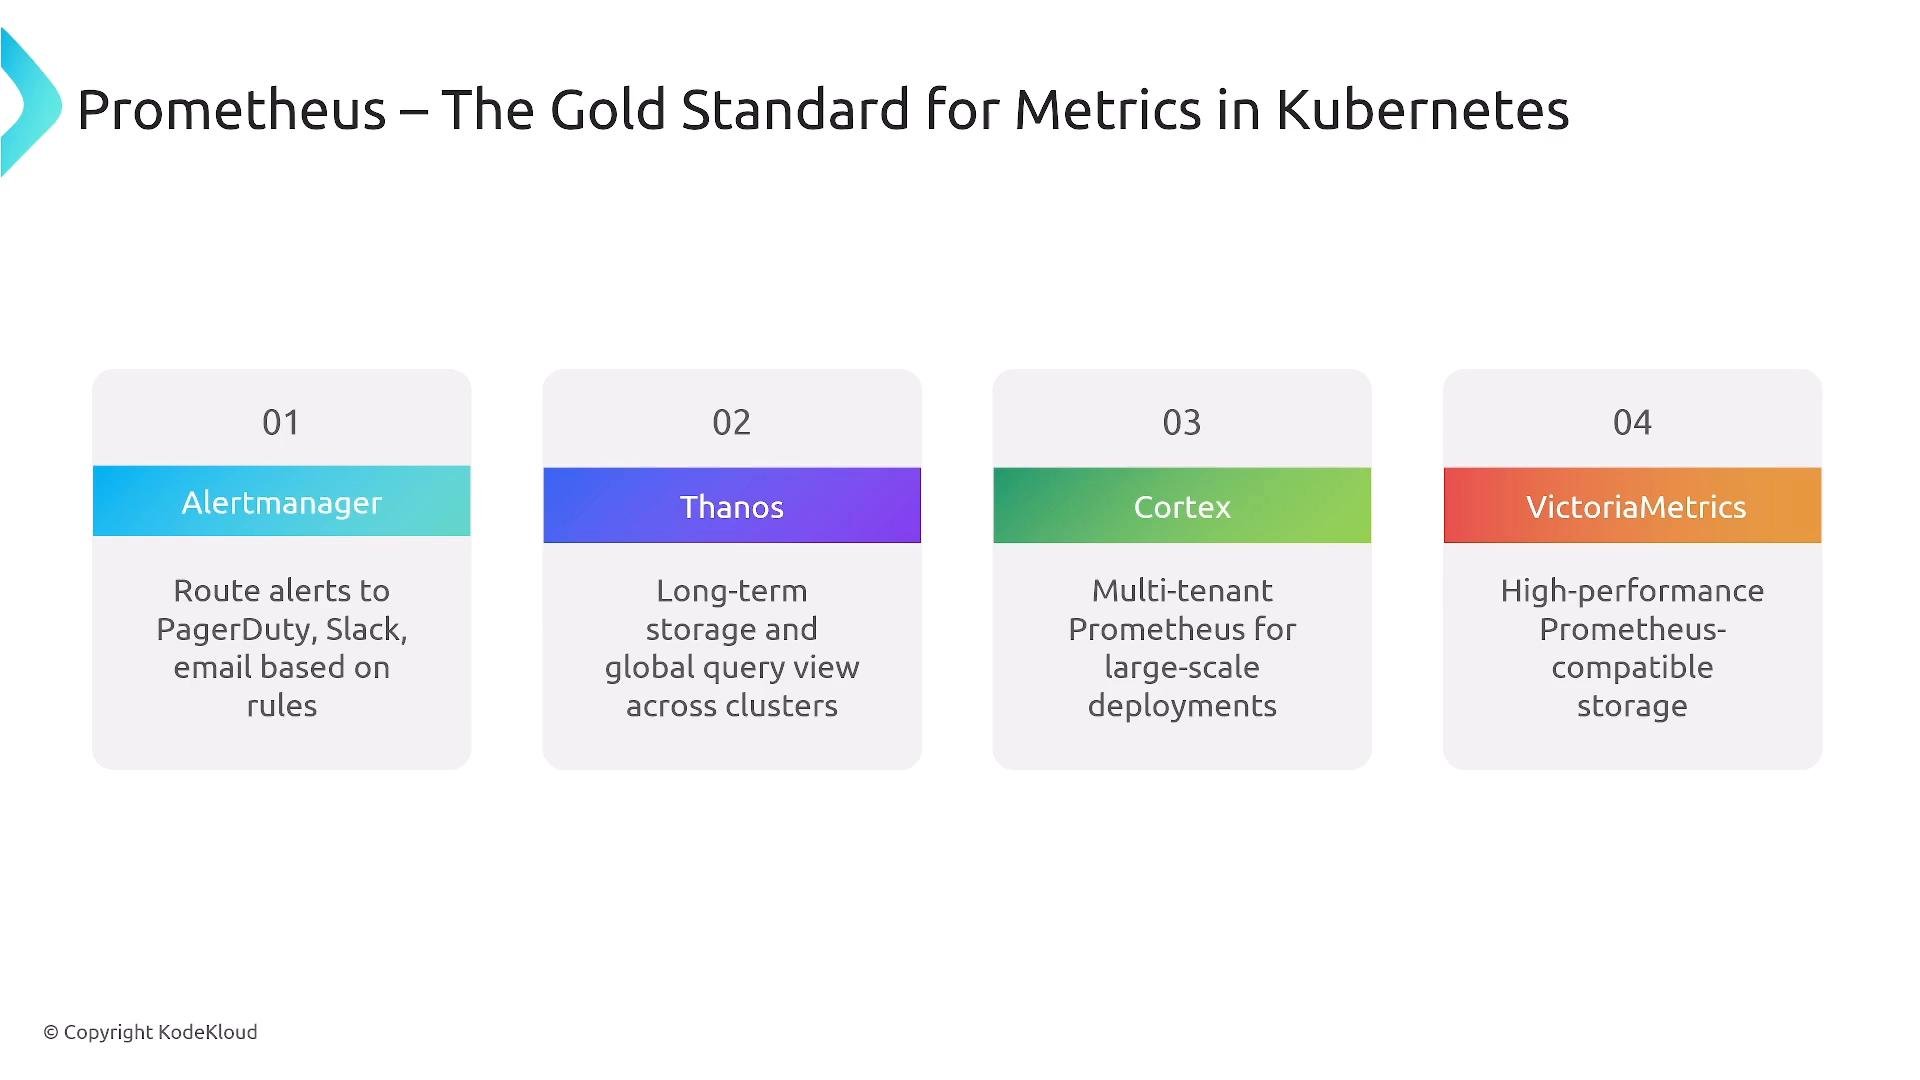
[Prometheus](https://prometheus.io/) is the de facto metrics system in Kubernetes ecosystems. Prometheus primarily uses a pull model (with Pushgateway for short-lived jobs), scrapes targets discovered by service discovery, stores time-series data, and exposes PromQL for powerful queries. For scaling and long-term storage look at projects such as [Thanos](https://thanos.io/) and [Cortex](https://cortexmetrics.io/). [VictoriaMetrics](https://victoriametrics.com/) is another performant storage option.
Key endpoints and integrations:
* Alerts: [Alertmanager](https://prometheus.io/docs/alerting/latest/alertmanager/)
* Long-term/global queries: Thanos
* Multi-tenant/large scale: Cortex
OpenTelemetry enables an “instrument once, export anywhere” model: auto-instrumentation and collectors let platform teams provide telemetry automatically while keeping the backend flexible.
## Metrics: Prometheus and the metrics ecosystem
[Prometheus](https://prometheus.io/) is the de facto metrics system in Kubernetes ecosystems. Prometheus primarily uses a pull model (with Pushgateway for short-lived jobs), scrapes targets discovered by service discovery, stores time-series data, and exposes PromQL for powerful queries. For scaling and long-term storage look at projects such as [Thanos](https://thanos.io/) and [Cortex](https://cortexmetrics.io/). [VictoriaMetrics](https://victoriametrics.com/) is another performant storage option.
Key endpoints and integrations:
* Alerts: [Alertmanager](https://prometheus.io/docs/alerting/latest/alertmanager/)
* Long-term/global queries: Thanos
* Multi-tenant/large scale: Cortex
 ## Visualization: Grafana
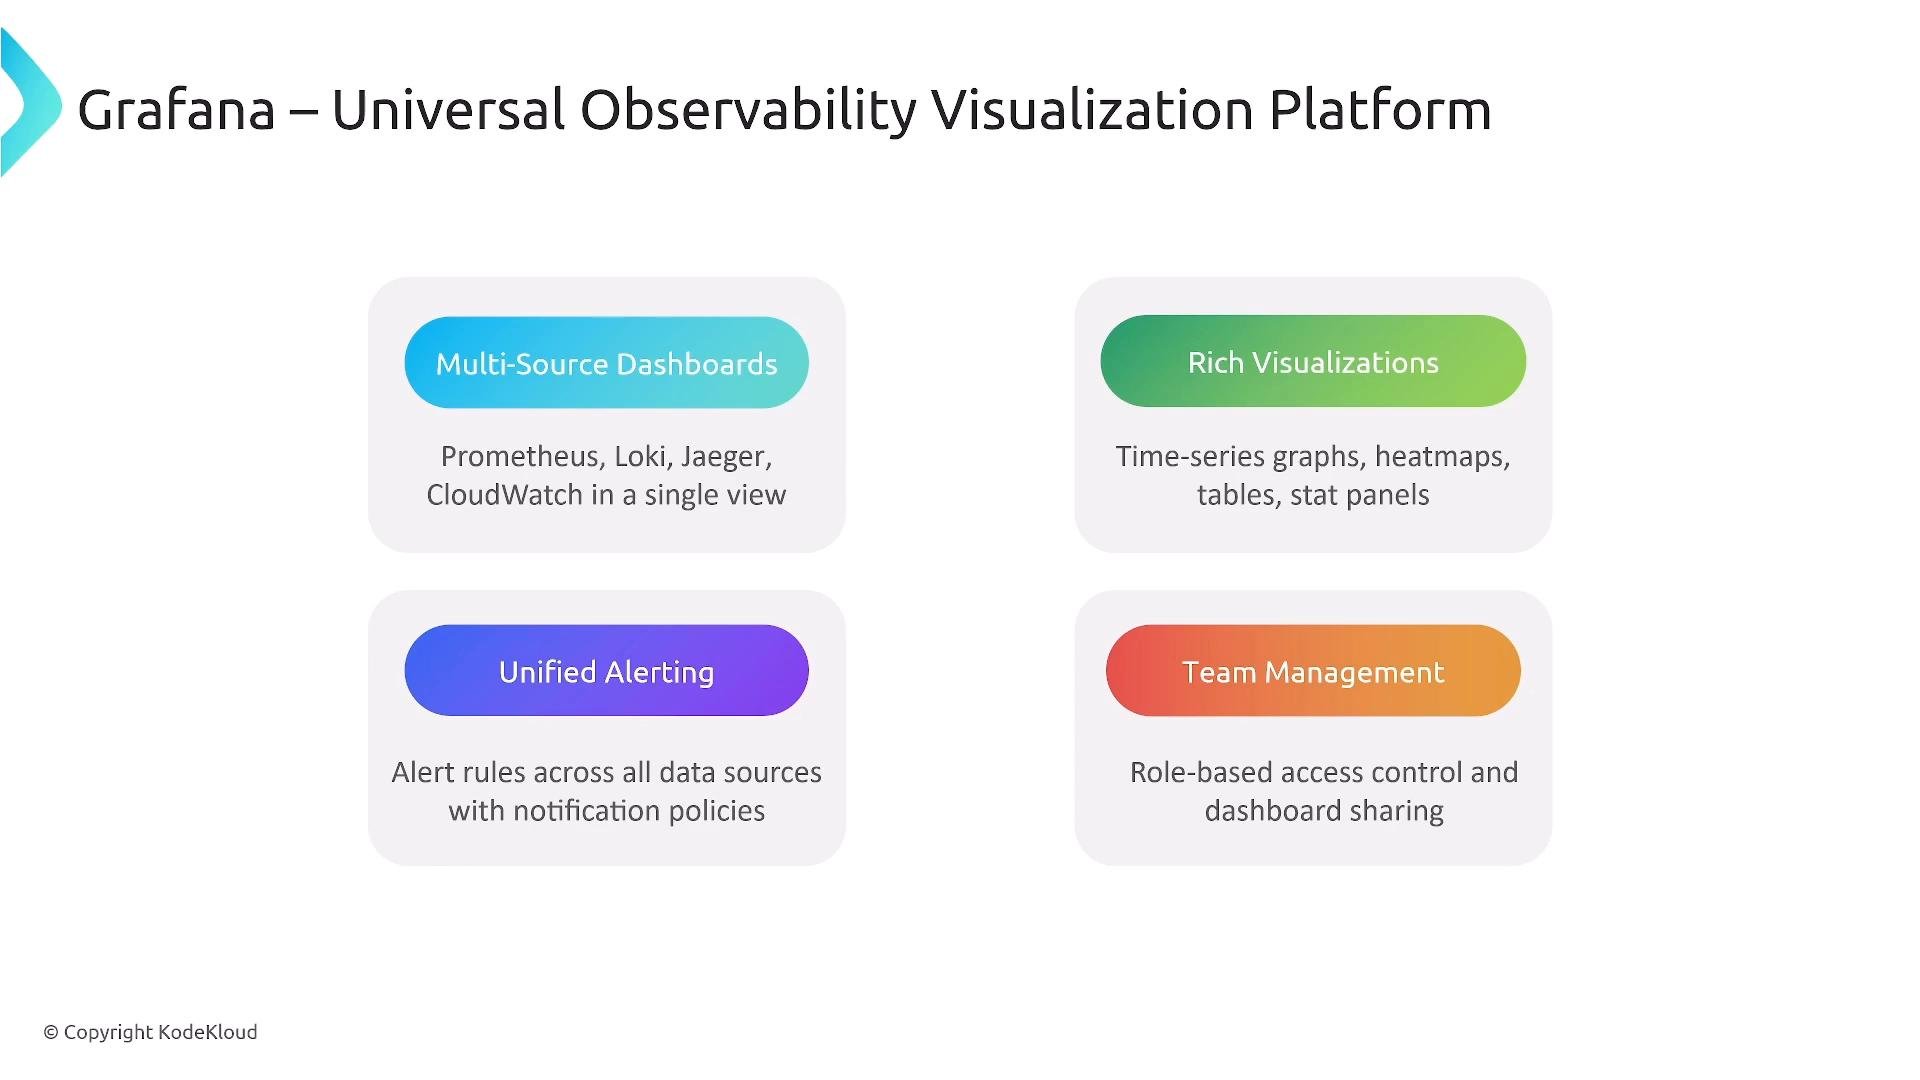
[Grafana](https://grafana.com/) is the common choice for dashboards and visualization. It integrates with many backends (Prometheus, Loki, Elasticsearch/OpenSearch, commercial providers), supports rich visualizations (time series, heatmaps, tables), and offers unified alerting and team/permission management. Grafana is widely used across cloud-native environments even though it is not part of CNCF.
## Visualization: Grafana
[Grafana](https://grafana.com/) is the common choice for dashboards and visualization. It integrates with many backends (Prometheus, Loki, Elasticsearch/OpenSearch, commercial providers), supports rich visualizations (time series, heatmaps, tables), and offers unified alerting and team/permission management. Grafana is widely used across cloud-native environments even though it is not part of CNCF.
 ## Logging: ELK/EFK, Fluentd/Fluent Bit, Loki, OpenSearch
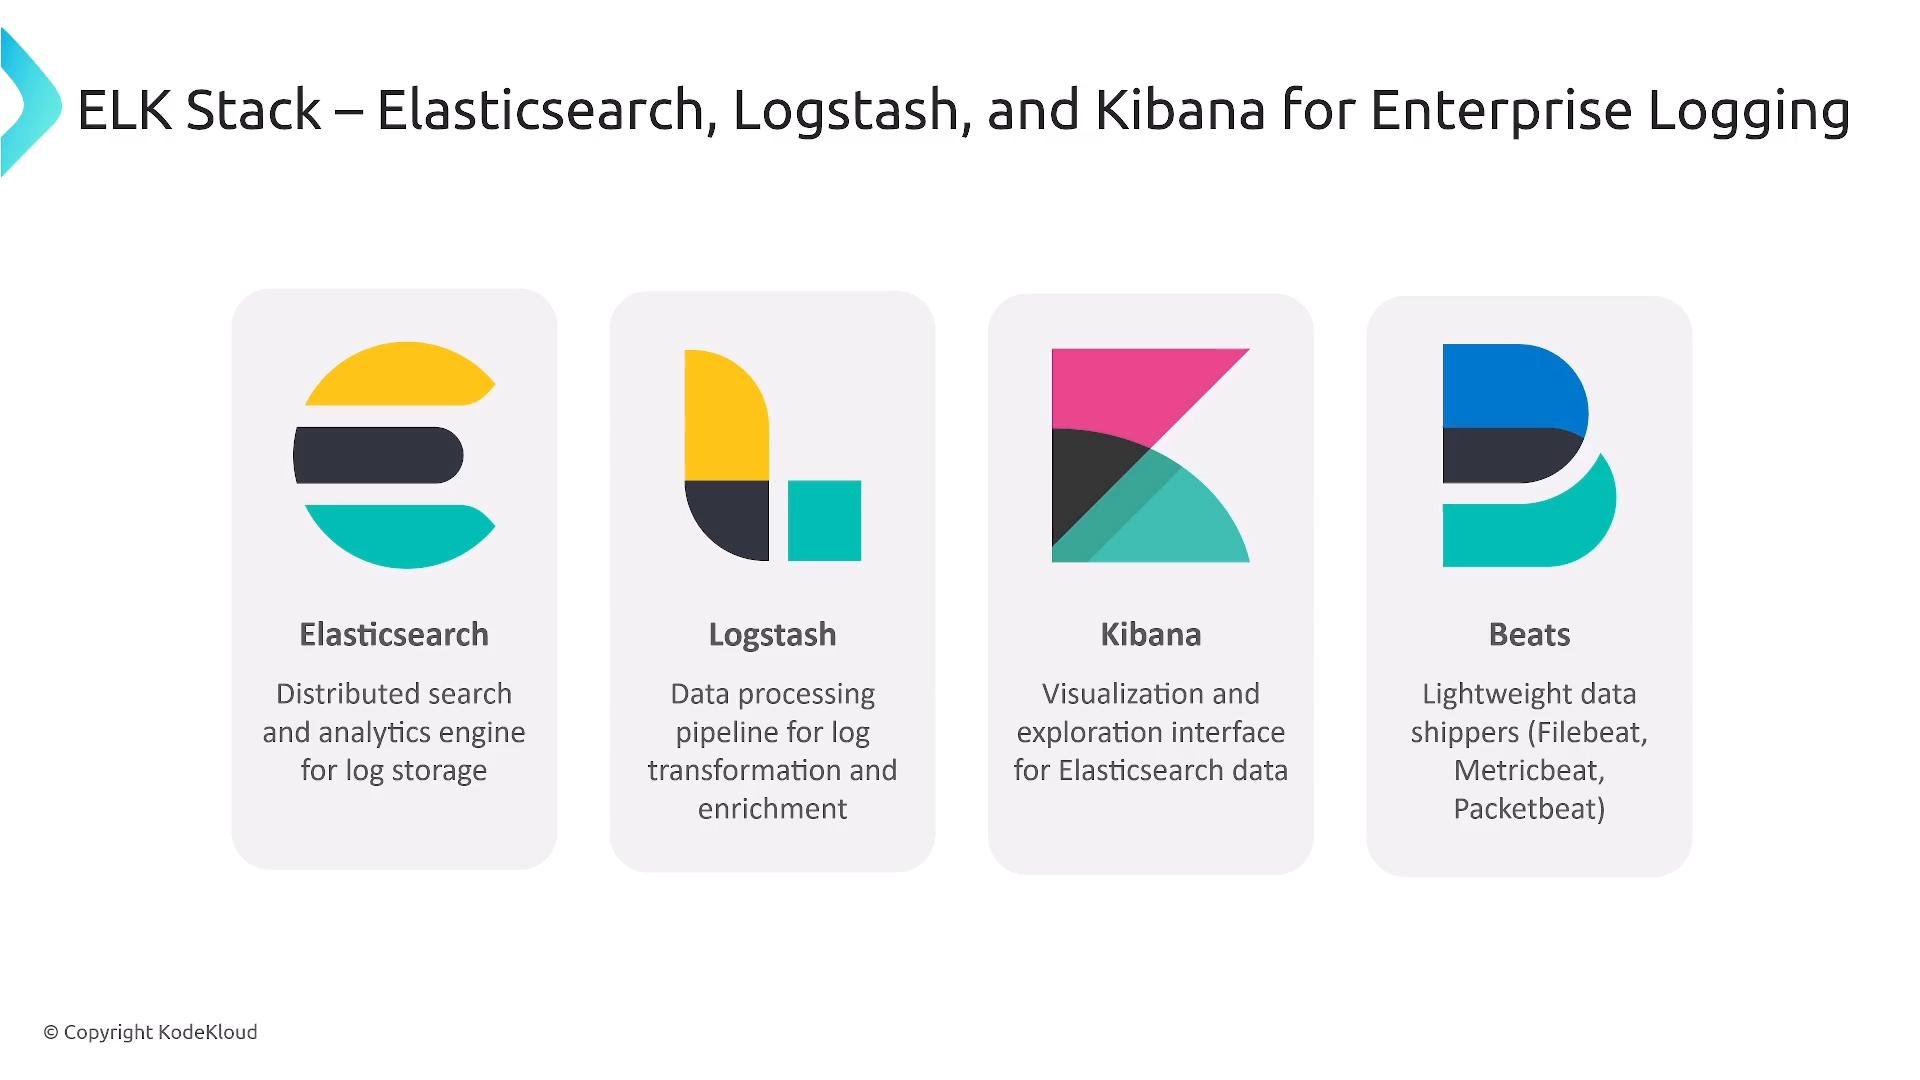
For logs, many platforms use the Elastic Stack (Elasticsearch, Logstash, Kibana — ELK; EFK when Filebeat/Beats is used). Logstash processes and ships logs into Elasticsearch and Kibana provides visualization. Beats are lightweight shippers.
Alternatives and collectors:
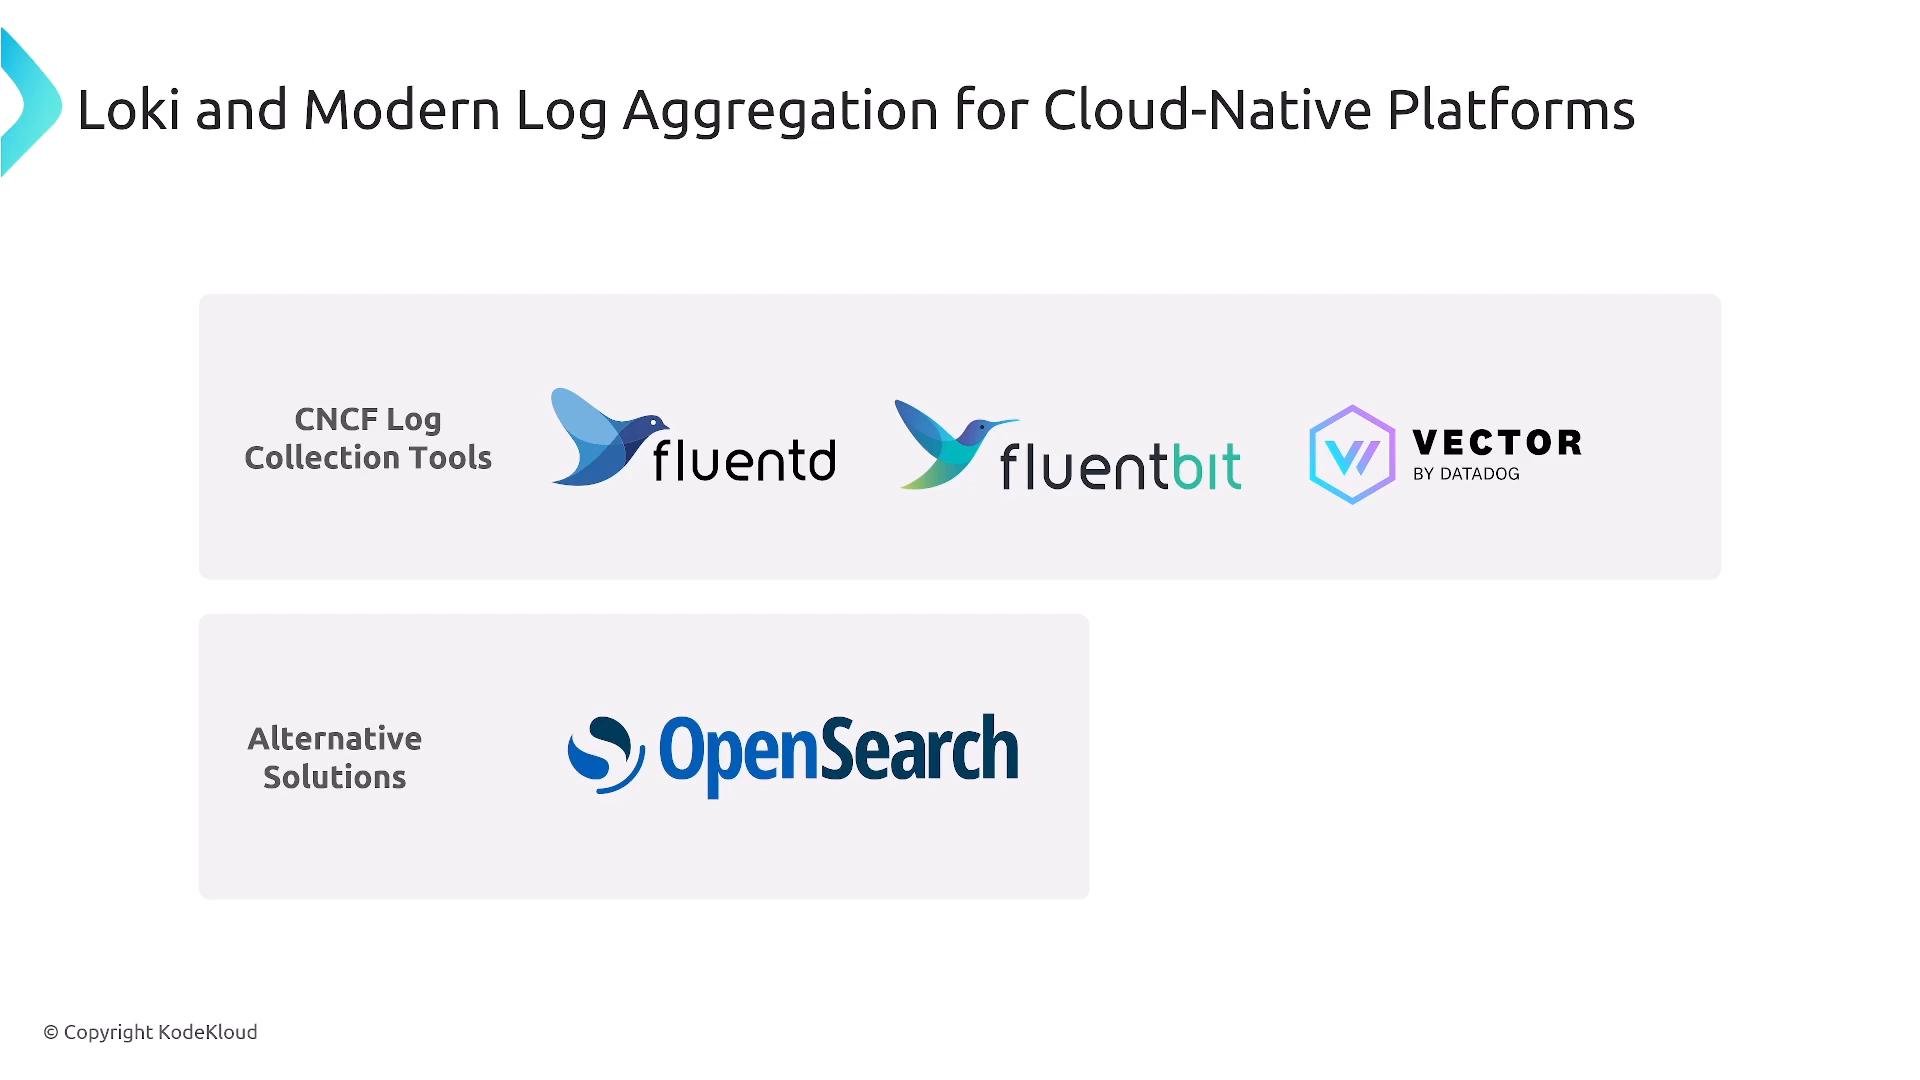
* Fluentd / Fluent Bit (CNCF projects)
* Vector (high-performance router)
* OpenTelemetry Collector (centralized telemetry routing)
* Storage/search: `Elasticsearch` or `OpenSearch` (community-driven fork)
Grafana Loki offers an alternative logging model: label-indexed logs with LogQL (Prometheus-like query language). Loki is often more storage-efficient for typical cloud-native logs, while ELK/OpenSearch remain strong when full-text search and complex analytics are required.
## Logging: ELK/EFK, Fluentd/Fluent Bit, Loki, OpenSearch
For logs, many platforms use the Elastic Stack (Elasticsearch, Logstash, Kibana — ELK; EFK when Filebeat/Beats is used). Logstash processes and ships logs into Elasticsearch and Kibana provides visualization. Beats are lightweight shippers.
Alternatives and collectors:
* Fluentd / Fluent Bit (CNCF projects)
* Vector (high-performance router)
* OpenTelemetry Collector (centralized telemetry routing)
* Storage/search: `Elasticsearch` or `OpenSearch` (community-driven fork)
Grafana Loki offers an alternative logging model: label-indexed logs with LogQL (Prometheus-like query language). Loki is often more storage-efficient for typical cloud-native logs, while ELK/OpenSearch remain strong when full-text search and complex analytics are required.
 ## Tracing: Jaeger, Zipkin, and APM
Distributed tracing helps answer "where is latency happening?" Common choices:
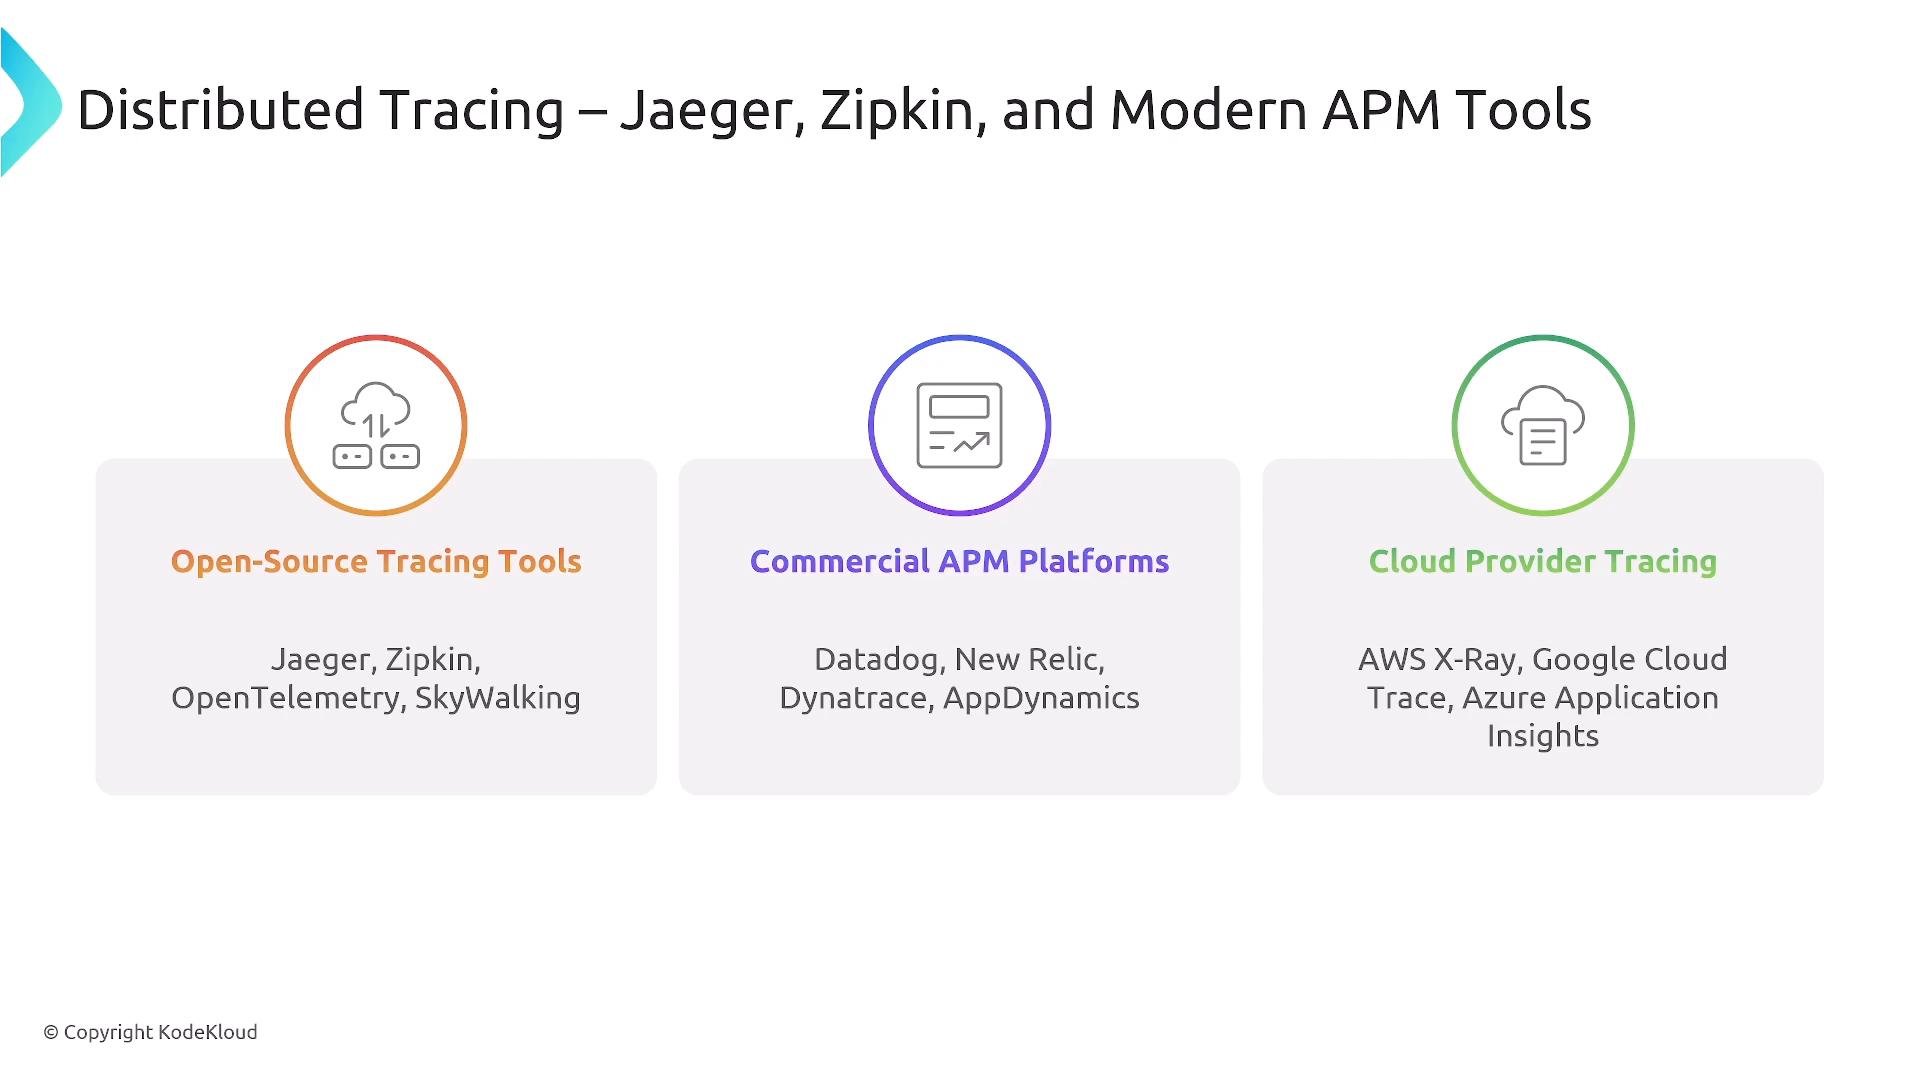
* Open-source: `Jaeger`, `Zipkin`, instrumented via `OpenTelemetry`
* Commercial APMs: Datadog, New Relic, Dynatrace, AppDynamics
* Cloud-provider tracing: AWS X‑Ray, Google Cloud Trace, Azure Application Insights
OpenTelemetry provides the common instrumentation layer; backends vary by organization needs (feature set, analytics, cost, vendor lock-in).
## Tracing: Jaeger, Zipkin, and APM
Distributed tracing helps answer "where is latency happening?" Common choices:
* Open-source: `Jaeger`, `Zipkin`, instrumented via `OpenTelemetry`
* Commercial APMs: Datadog, New Relic, Dynatrace, AppDynamics
* Cloud-provider tracing: AWS X‑Ray, Google Cloud Trace, Azure Application Insights
OpenTelemetry provides the common instrumentation layer; backends vary by organization needs (feature set, analytics, cost, vendor lock-in).
 ## Commercial and cloud offerings
Commercial APMs and observability platforms bundle metrics, traces, and logs with analytics, incident integrations, and advanced UIs. Examples: Datadog, New Relic, Dynatrace, Splunk, Honeycomb, LightStep. Cloud-managed offerings (AWS, GCP, Azure) integrate tightly with their ecosystems and are attractive for teams committed to a single cloud provider.
## eBPF and kernel-level observability
[eBPF](https://ebpf.io/) enables low-overhead kernel instrumentation for networking, tracing, and security. It powers solutions that provide deep visibility without modifying application code. Notable projects and capabilities:
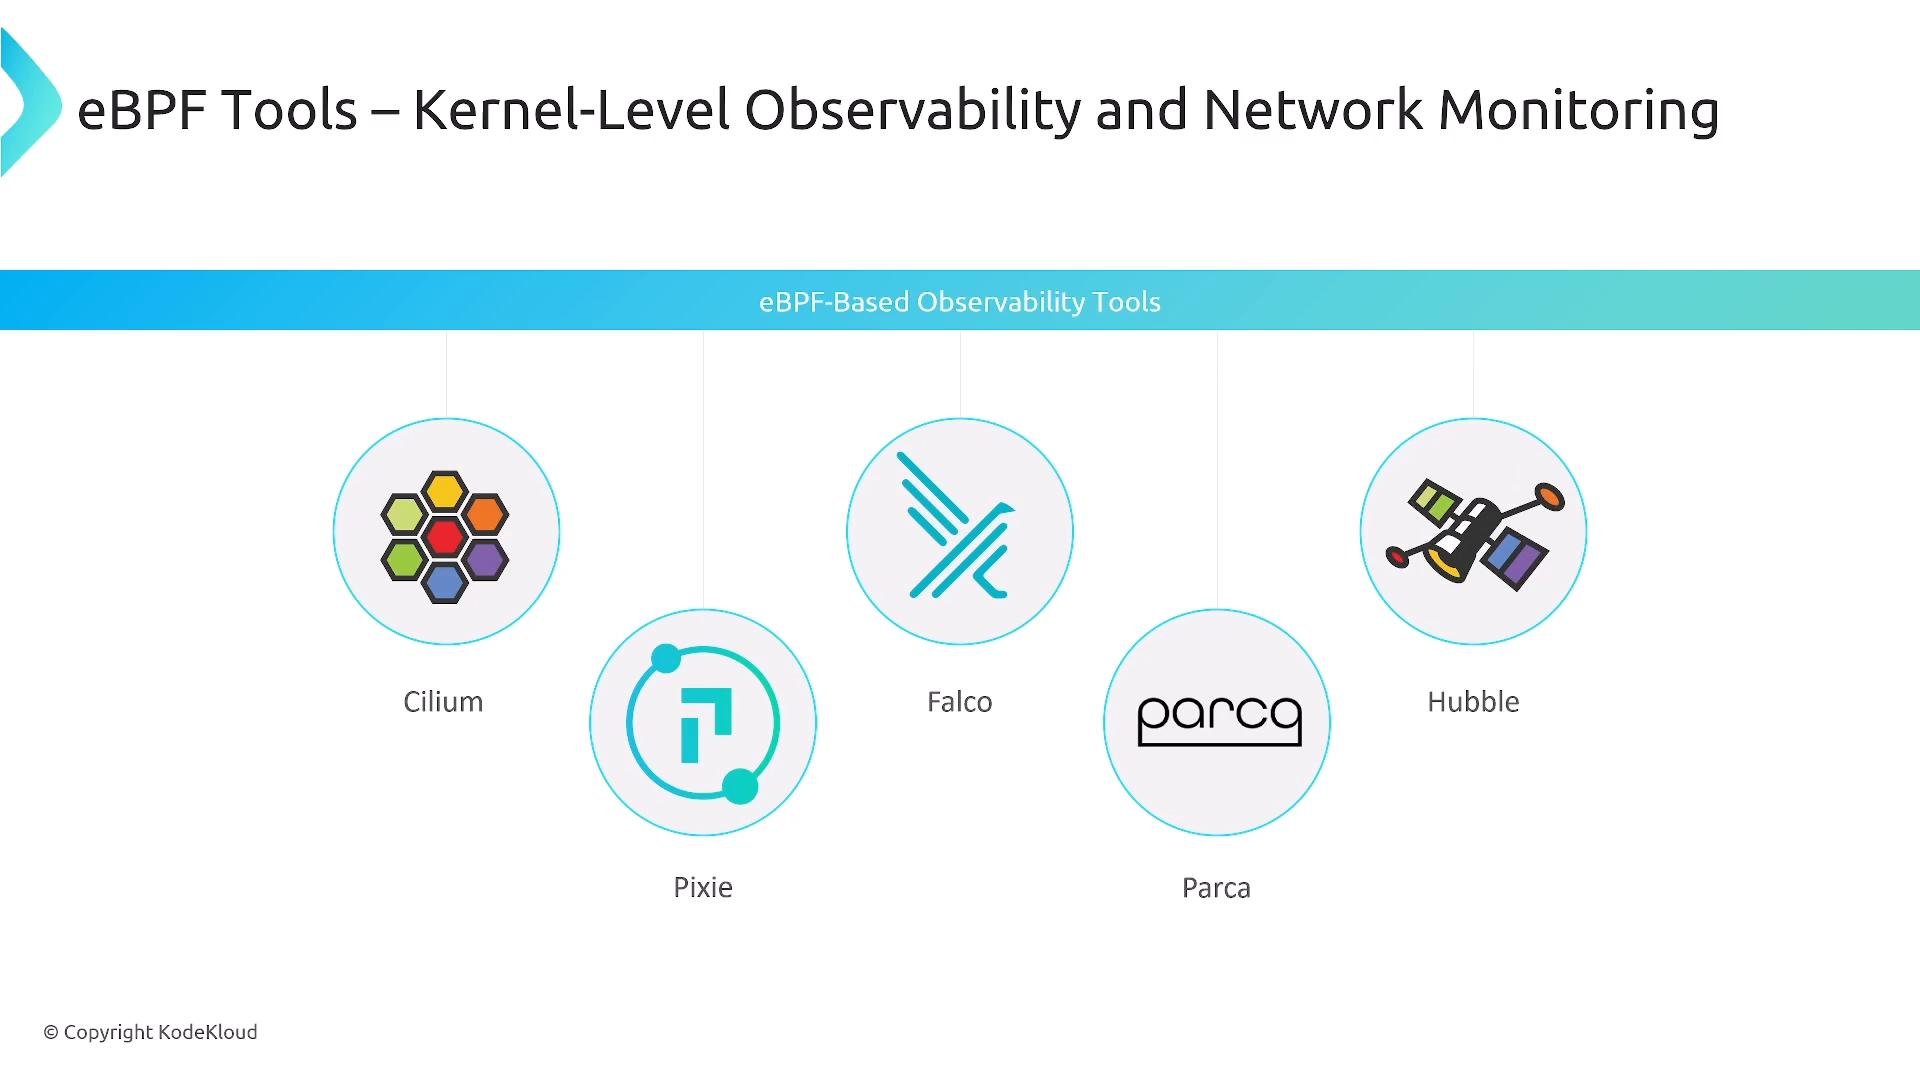
* Cilium (CNI + network observability + Hubble)
* Falco (runtime security)
* Parca (continuous profiling)
* Pixie (agentless eBPF-based observability; licensing/status may vary)
## Commercial and cloud offerings
Commercial APMs and observability platforms bundle metrics, traces, and logs with analytics, incident integrations, and advanced UIs. Examples: Datadog, New Relic, Dynatrace, Splunk, Honeycomb, LightStep. Cloud-managed offerings (AWS, GCP, Azure) integrate tightly with their ecosystems and are attractive for teams committed to a single cloud provider.
## eBPF and kernel-level observability
[eBPF](https://ebpf.io/) enables low-overhead kernel instrumentation for networking, tracing, and security. It powers solutions that provide deep visibility without modifying application code. Notable projects and capabilities:
* Cilium (CNI + network observability + Hubble)
* Falco (runtime security)
* Parca (continuous profiling)
* Pixie (agentless eBPF-based observability; licensing/status may vary)
 Plan for cost and data lifecycle: long retention windows, high-cardinality metrics, and full-text log storage can increase operational cost. Use downsampling, aggregation, and retention policies (e.g., Thanos/VictoriaMetrics retention tiers) to balance observability needs and budget.
## SRE, profiling, and user monitoring
* eBPF is highly valued by SREs and platform engineers for lightweight, deep visibility into production systems.
* Continuous profiling tools (Parca, Pyroscope) reveal CPU/memory/latency hotspots over time.
* RUM (Real User Monitoring) and client-side telemetry help understand user journeys and geographic latency.
## Putting the pieces together (platform integration)
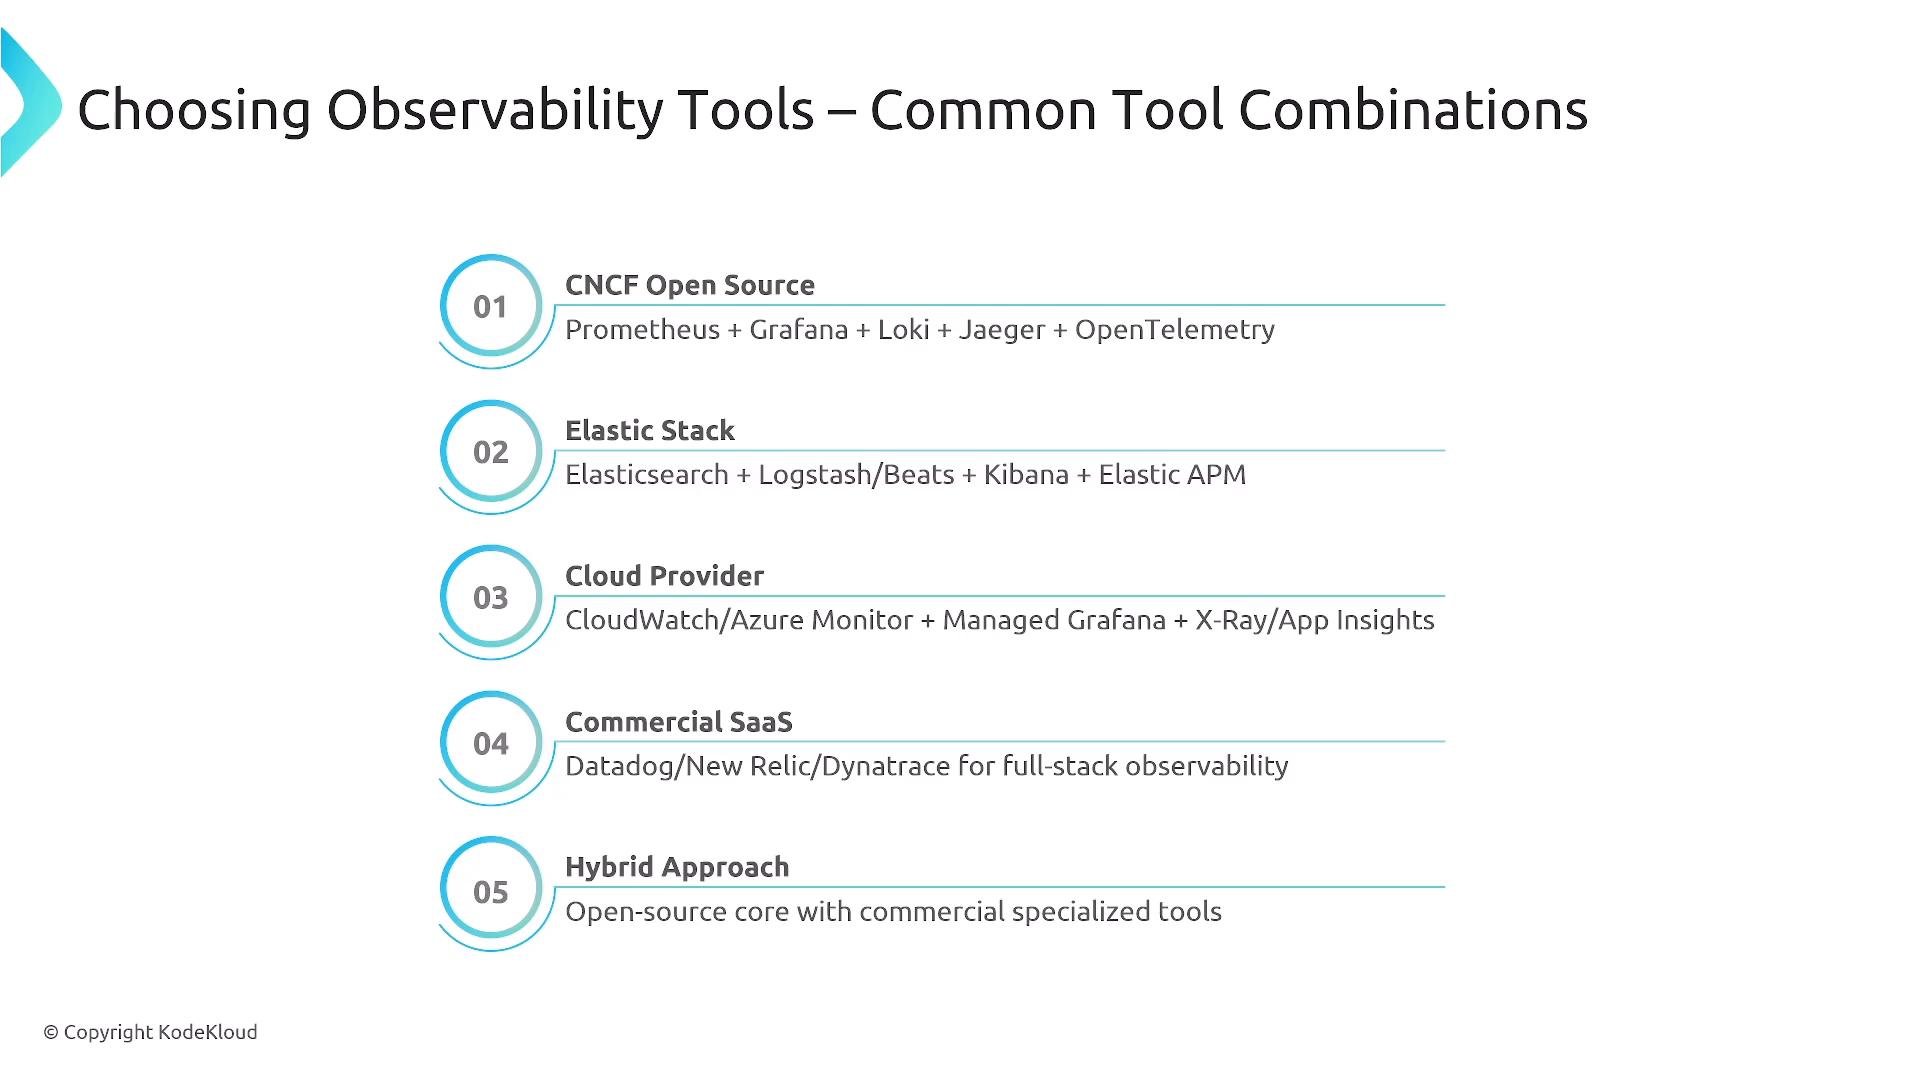
A well-designed platform ingests telemetry from multiple sources, correlates across signals, and presents unified dashboards and alerts. Common stack combinations:
| Approach | Example stack |
| - | - |
| CNCF / open-source | Prometheus + Grafana + Loki + Jaeger + OpenTelemetry Collector |
| Elastic-focused | Elasticsearch + Logstash/Beats + Kibana (+ OpenSearch alternative) |
| Cloud-native | CloudWatch/X‑Ray (AWS) or Cloud Monitoring/Trace (GCP) |
| Commercial SaaS | Datadog, New Relic, Splunk, Honeycomb |
| Hybrid | Mix of managed services + open-source on-prem components |
Plan for cost and data lifecycle: long retention windows, high-cardinality metrics, and full-text log storage can increase operational cost. Use downsampling, aggregation, and retention policies (e.g., Thanos/VictoriaMetrics retention tiers) to balance observability needs and budget.
## SRE, profiling, and user monitoring
* eBPF is highly valued by SREs and platform engineers for lightweight, deep visibility into production systems.
* Continuous profiling tools (Parca, Pyroscope) reveal CPU/memory/latency hotspots over time.
* RUM (Real User Monitoring) and client-side telemetry help understand user journeys and geographic latency.
## Putting the pieces together (platform integration)
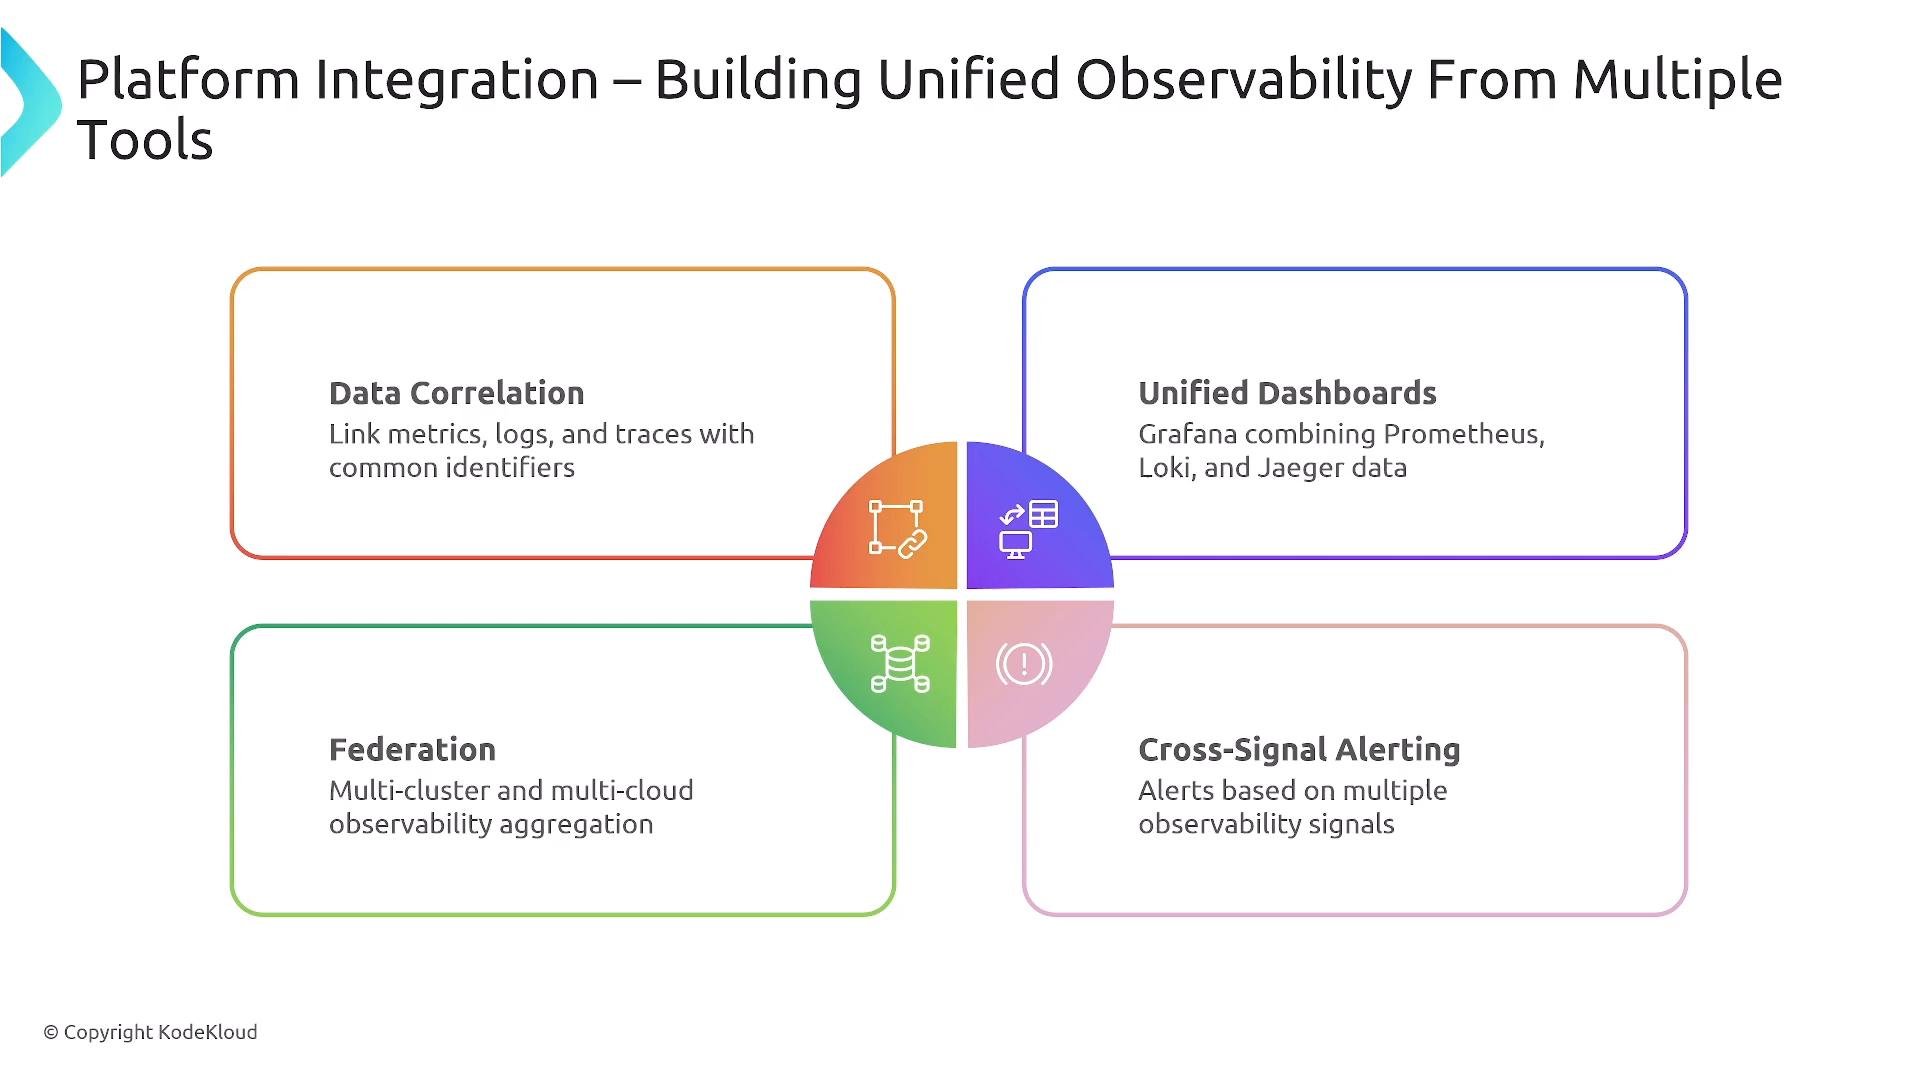
A well-designed platform ingests telemetry from multiple sources, correlates across signals, and presents unified dashboards and alerts. Common stack combinations:
| Approach | Example stack |
| - | - |
| CNCF / open-source | Prometheus + Grafana + Loki + Jaeger + OpenTelemetry Collector |
| Elastic-focused | Elasticsearch + Logstash/Beats + Kibana (+ OpenSearch alternative) |
| Cloud-native | CloudWatch/X‑Ray (AWS) or Cloud Monitoring/Trace (GCP) |
| Commercial SaaS | Datadog, New Relic, Splunk, Honeycomb |
| Hybrid | Mix of managed services + open-source on-prem components |
 ## Choosing a tooling approach
Typical approaches (trade-offs summarized):
## Choosing a tooling approach
Typical approaches (trade-offs summarized):
 Factors to consider when choosing:
* Scale and multi-tenancy requirements
* Cost and retention policies
* Team skills and operational overhead
* Need for full-text search vs label-indexed logs
* Desire to avoid vendor lock-in (favor OTel + open components)
## Self-service observability: platform responsibilities vs developer capabilities
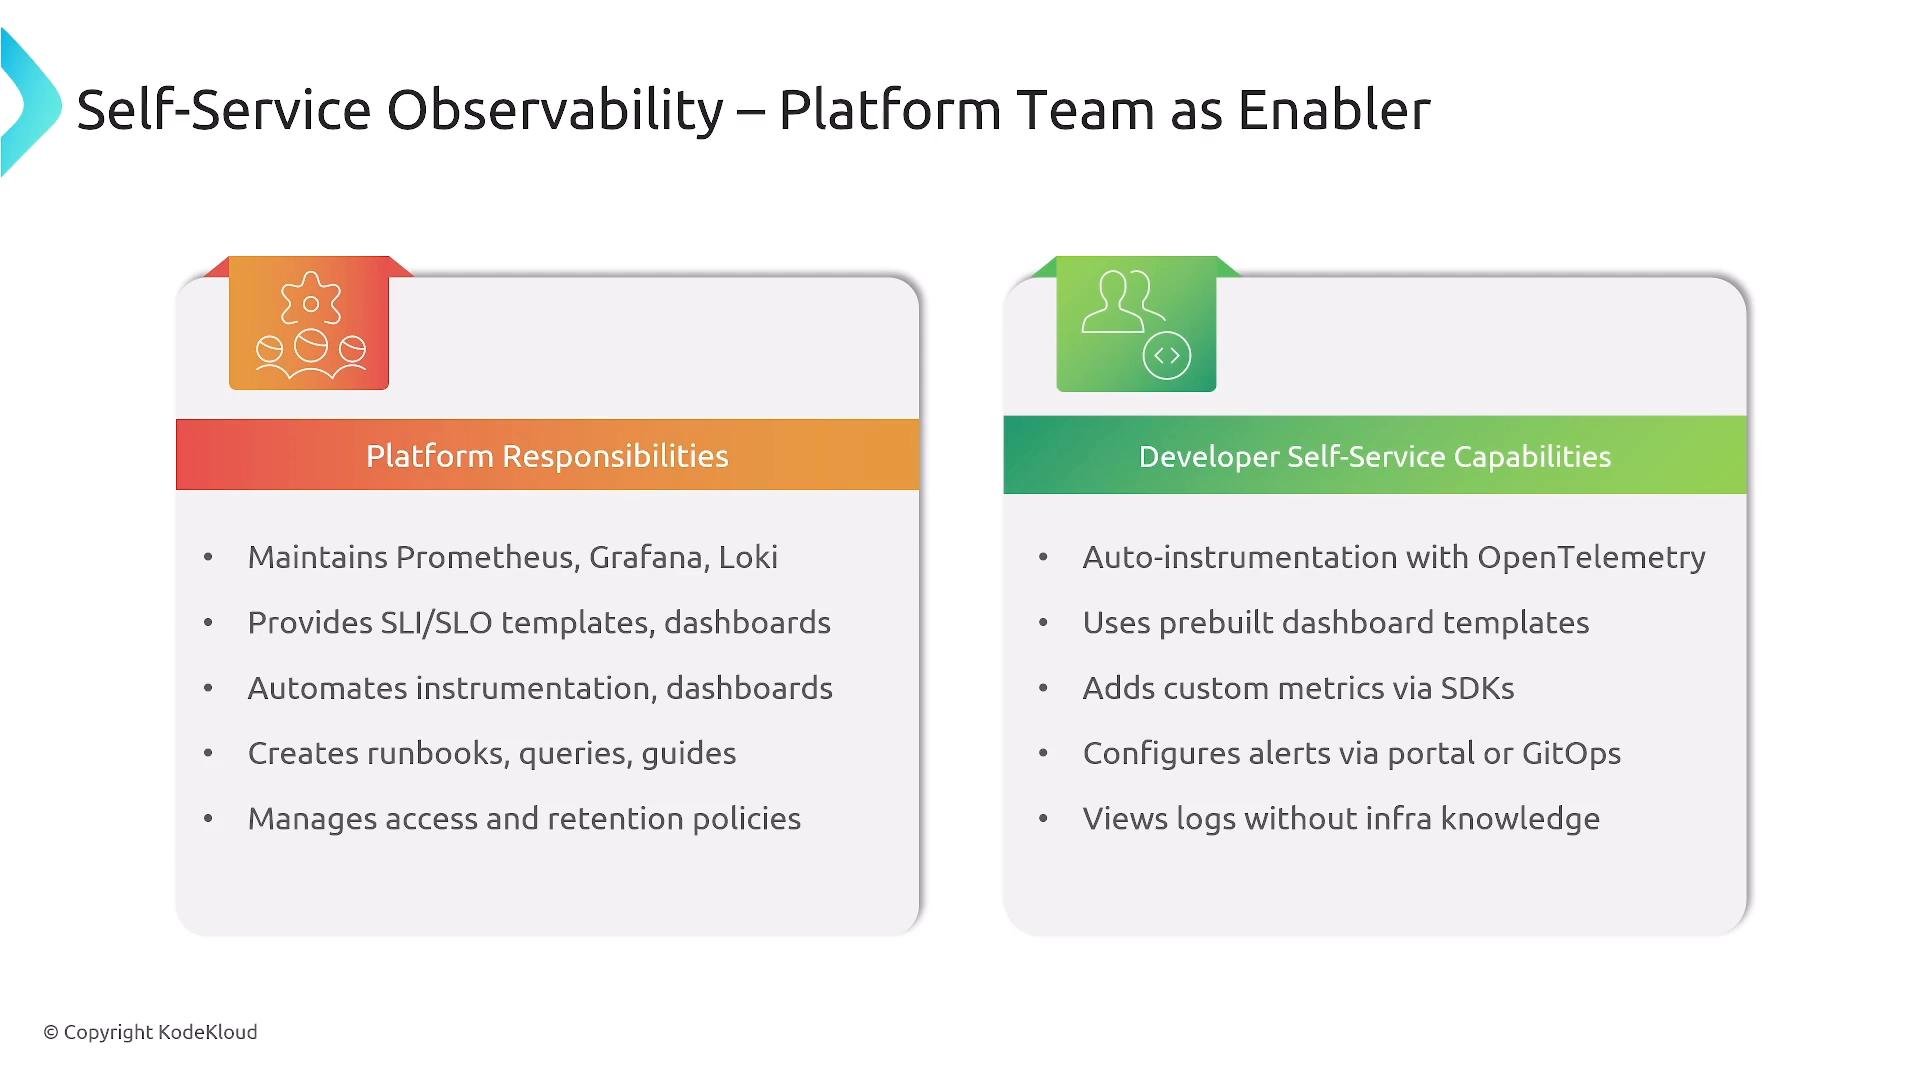
Platform engineering enables developer self-service so teams can observe and operate their services independently.
Platform responsibilities:
* Run and maintain core services (Prometheus, Grafana, Loki, Jaeger, OTel Collector)
* Provide SLI/SLO templates, runbooks, and guardrails
* Manage retention, storage, and secure access controls
* Offer cataloged dashboards, alerting rule templates, and onboarding docs
Developer self-service capabilities:
* Auto-instrumentation (OpenTelemetry agents and SDKs)
* Access to prebuilt dashboards and templates
* Ability to define custom metrics and alerts via UI or GitOps (`YAML`/`JSON`) without platform team intervention
* Log views and trace exploration in self-service dashboards
Automation and GitOps are often used to provision dashboards, manage alerting rules, and enforce observability standards so teams can operate independently while remaining compliant.
Factors to consider when choosing:
* Scale and multi-tenancy requirements
* Cost and retention policies
* Team skills and operational overhead
* Need for full-text search vs label-indexed logs
* Desire to avoid vendor lock-in (favor OTel + open components)
## Self-service observability: platform responsibilities vs developer capabilities
Platform engineering enables developer self-service so teams can observe and operate their services independently.
Platform responsibilities:
* Run and maintain core services (Prometheus, Grafana, Loki, Jaeger, OTel Collector)
* Provide SLI/SLO templates, runbooks, and guardrails
* Manage retention, storage, and secure access controls
* Offer cataloged dashboards, alerting rule templates, and onboarding docs
Developer self-service capabilities:
* Auto-instrumentation (OpenTelemetry agents and SDKs)
* Access to prebuilt dashboards and templates
* Ability to define custom metrics and alerts via UI or GitOps (`YAML`/`JSON`) without platform team intervention
* Log views and trace exploration in self-service dashboards
Automation and GitOps are often used to provision dashboards, manage alerting rules, and enforce observability standards so teams can operate independently while remaining compliant.
 ## Key takeaways
* OpenTelemetry, Prometheus, Grafana, Loki, and Jaeger are core components in most cloud-native observability platforms and are essential to platform engineering knowledge.
* Use collectors and shippers (Fluentd, Fluent Bit, Vector, OpenTelemetry Collector) to centralize telemetry and route it to appropriate storage backends.
* Choose storage and analytics components (Elasticsearch/OpenSearch, VictoriaMetrics, Thanos, Cortex) based on scale, multi-tenancy, and retention needs.
* eBPF (Cilium, Falco, Pixie, Parca) adds kernel-level observability for networking, security, and profiling with low overhead.
* Platform engineering should provide standards, templates (SLIs/SLOs), and self-service tooling so developers can instrument and observe applications with minimal friction.
Thanks for reading this lesson in Domain 2.
## Links and references
* OpenTelemetry: [https://opentelemetry.io/](https://opentelemetry.io/)
* Prometheus docs: [https://prometheus.io/docs/](https://prometheus.io/docs/)
* Grafana docs: [https://grafana.com/docs/](https://grafana.com/docs/)
* Loki docs: [https://grafana.com/oss/loki](https://grafana.com/oss/loki)
* Jaeger tracing: [https://www.jaegertracing.io/](https://www.jaegertracing.io/)
* eBPF resources: [https://ebpf.io/](https://ebpf.io/)
* Elastic Stack: [https://www.elastic.co/](https://www.elastic.co/)
* OpenSearch: [https://opensearch.org/](https://opensearch.org/)
This documentation is built and hosted on [Mintlify](https://mintlify.com), a developer documentation platform.
## Key takeaways
* OpenTelemetry, Prometheus, Grafana, Loki, and Jaeger are core components in most cloud-native observability platforms and are essential to platform engineering knowledge.
* Use collectors and shippers (Fluentd, Fluent Bit, Vector, OpenTelemetry Collector) to centralize telemetry and route it to appropriate storage backends.
* Choose storage and analytics components (Elasticsearch/OpenSearch, VictoriaMetrics, Thanos, Cortex) based on scale, multi-tenancy, and retention needs.
* eBPF (Cilium, Falco, Pixie, Parca) adds kernel-level observability for networking, security, and profiling with low overhead.
* Platform engineering should provide standards, templates (SLIs/SLOs), and self-service tooling so developers can instrument and observe applications with minimal friction.
Thanks for reading this lesson in Domain 2.
## Links and references
* OpenTelemetry: [https://opentelemetry.io/](https://opentelemetry.io/)
* Prometheus docs: [https://prometheus.io/docs/](https://prometheus.io/docs/)
* Grafana docs: [https://grafana.com/docs/](https://grafana.com/docs/)
* Loki docs: [https://grafana.com/oss/loki](https://grafana.com/oss/loki)
* Jaeger tracing: [https://www.jaegertracing.io/](https://www.jaegertracing.io/)
* eBPF resources: [https://ebpf.io/](https://ebpf.io/)
* Elastic Stack: [https://www.elastic.co/](https://www.elastic.co/)
* OpenSearch: [https://opensearch.org/](https://opensearch.org/)
This documentation is built and hosted on [Mintlify](https://mintlify.com), a developer documentation platform.