> ## Documentation Index
> Fetch the complete documentation index at: https://notes.kodekloud.com/llms.txt
> Use this file to discover all available pages before exploring further.
# Business Case Example
> Three-step FinOps business case showing pain points, proposed investments, quantified annual benefits, ROI and payback for reducing cloud costs and improving financial control.
In this lesson we walk through a practical three-step FinOps business case for a mid-size company with an approximate monthly cloud spend of \$500,000. The goal is to convert real cost pain into a concise, data-driven proposal that leadership can evaluate quickly.
## Current issues (pain points)
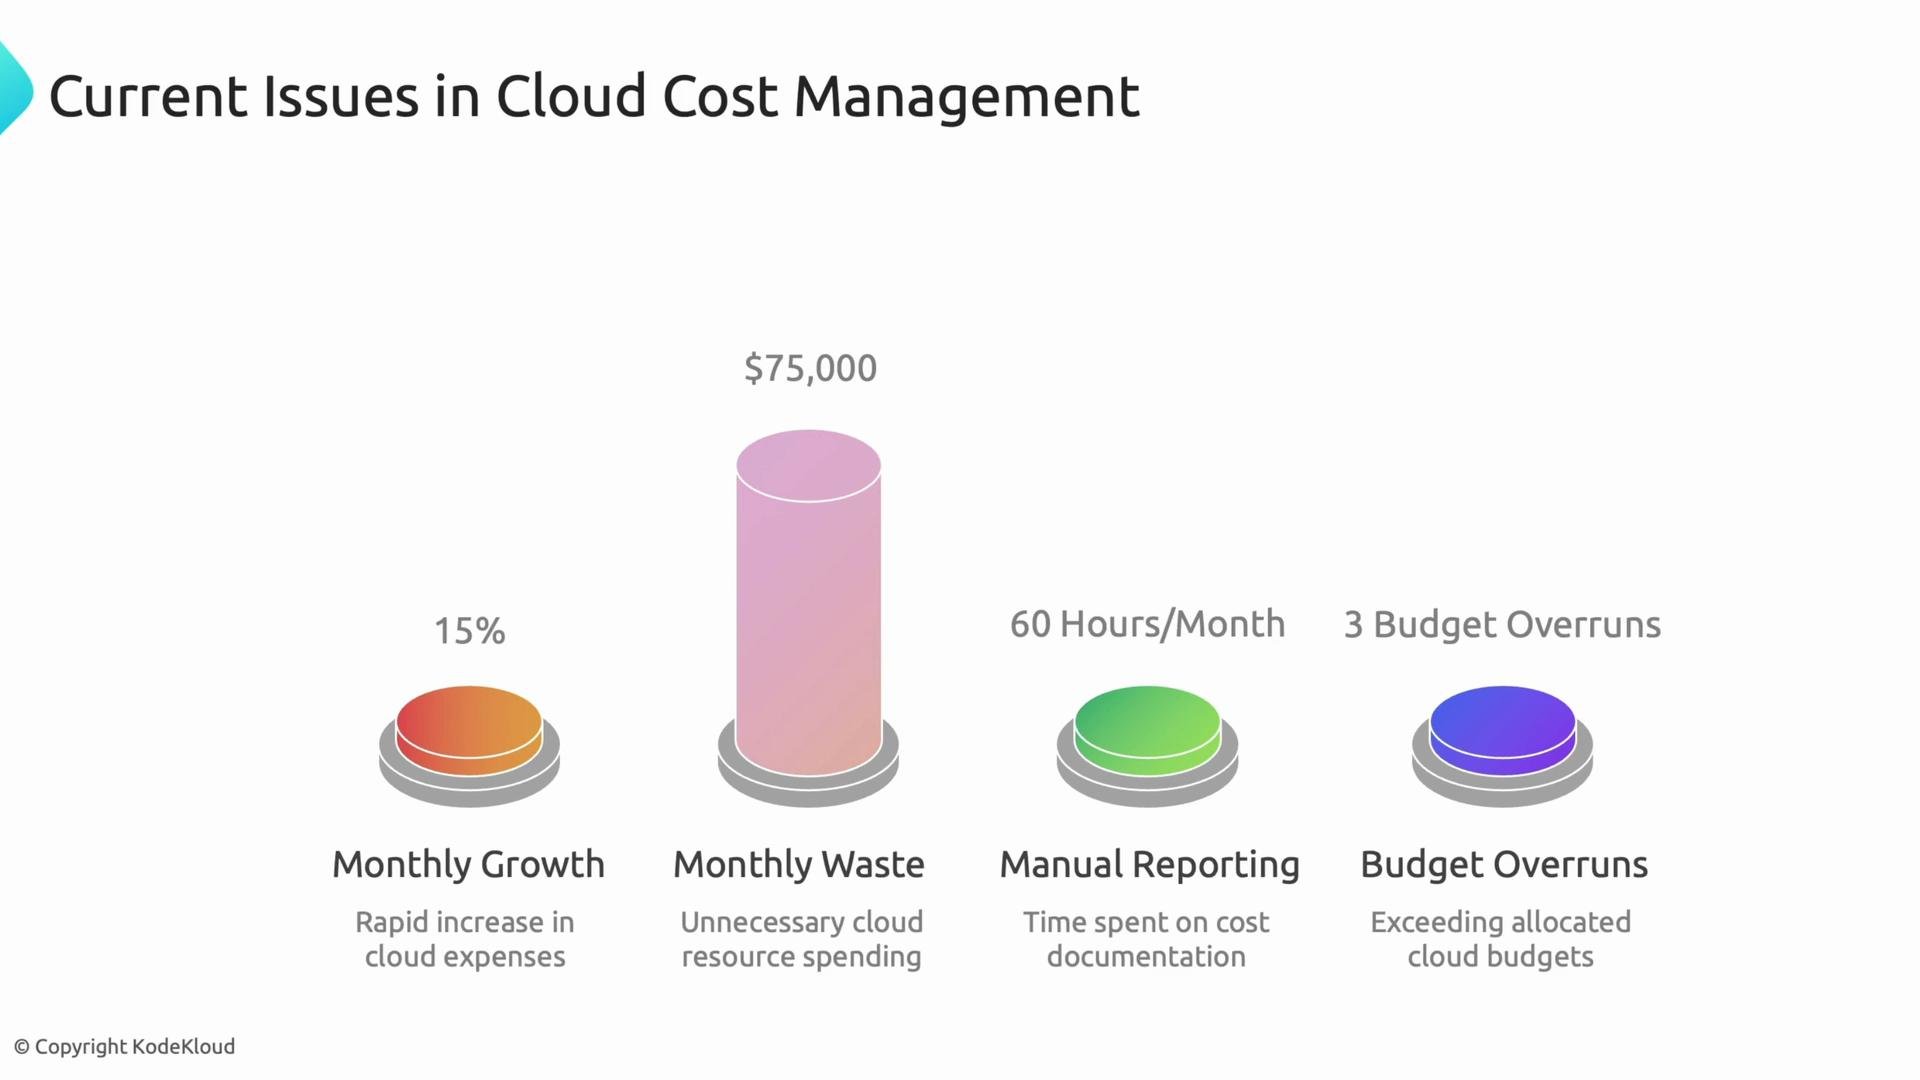
Identify measurable problems and tie them to business impact. Below are the primary issues, their business impact, and the representative metrics used in this example.
| Issue | Business impact | Metric |
| --------------------------------- | -------------------------------------------------- | --------------------------- |
| Monthly growth in cloud spend | Compounds quickly and increases budget risk | 15% month-over-month growth |
| Unused or underutilized resources | Direct wasted spend | \$75,000/month waste |
| Manual reporting and chargeback | High operational overhead and slow decision-making | 60 hours/month on reporting |
| Budget overruns | Missed forecasts and executive concern | 3 budget overruns this year |
 These are plausible, data-driven pain points you might already be experiencing. If your organization is early in its FinOps maturity, start from the metrics you do track and be transparent about any gaps.
## Solution: investment (annual)
Propose a focused set of investments to address the pain points. Below are the estimated annual costs used in this example.
| Investment item | Purpose | Estimated annual cost |
| --------------------------- | ----------------------------------------------- | --------------------- |
| FinOps platform | Automated cost visibility and optimization | \$50,000 |
| Training & certification | Upskilling the team for FinOps practices | \$15,000 |
| FinOps engineer | Dedicated resource for execution and governance | \$120,000 |
| **Total annual investment** | | **\$185,000** |
Compare this investment to the projected benefits when making the case.
## Benefits (annual)
Estimate the quantifiable outcomes from the investment. These should be defensible and tied to the pain points above.
| Benefit | Source | Estimated annual benefit |
| ------------------------- | ------------------------------------------ | ------------------------ |
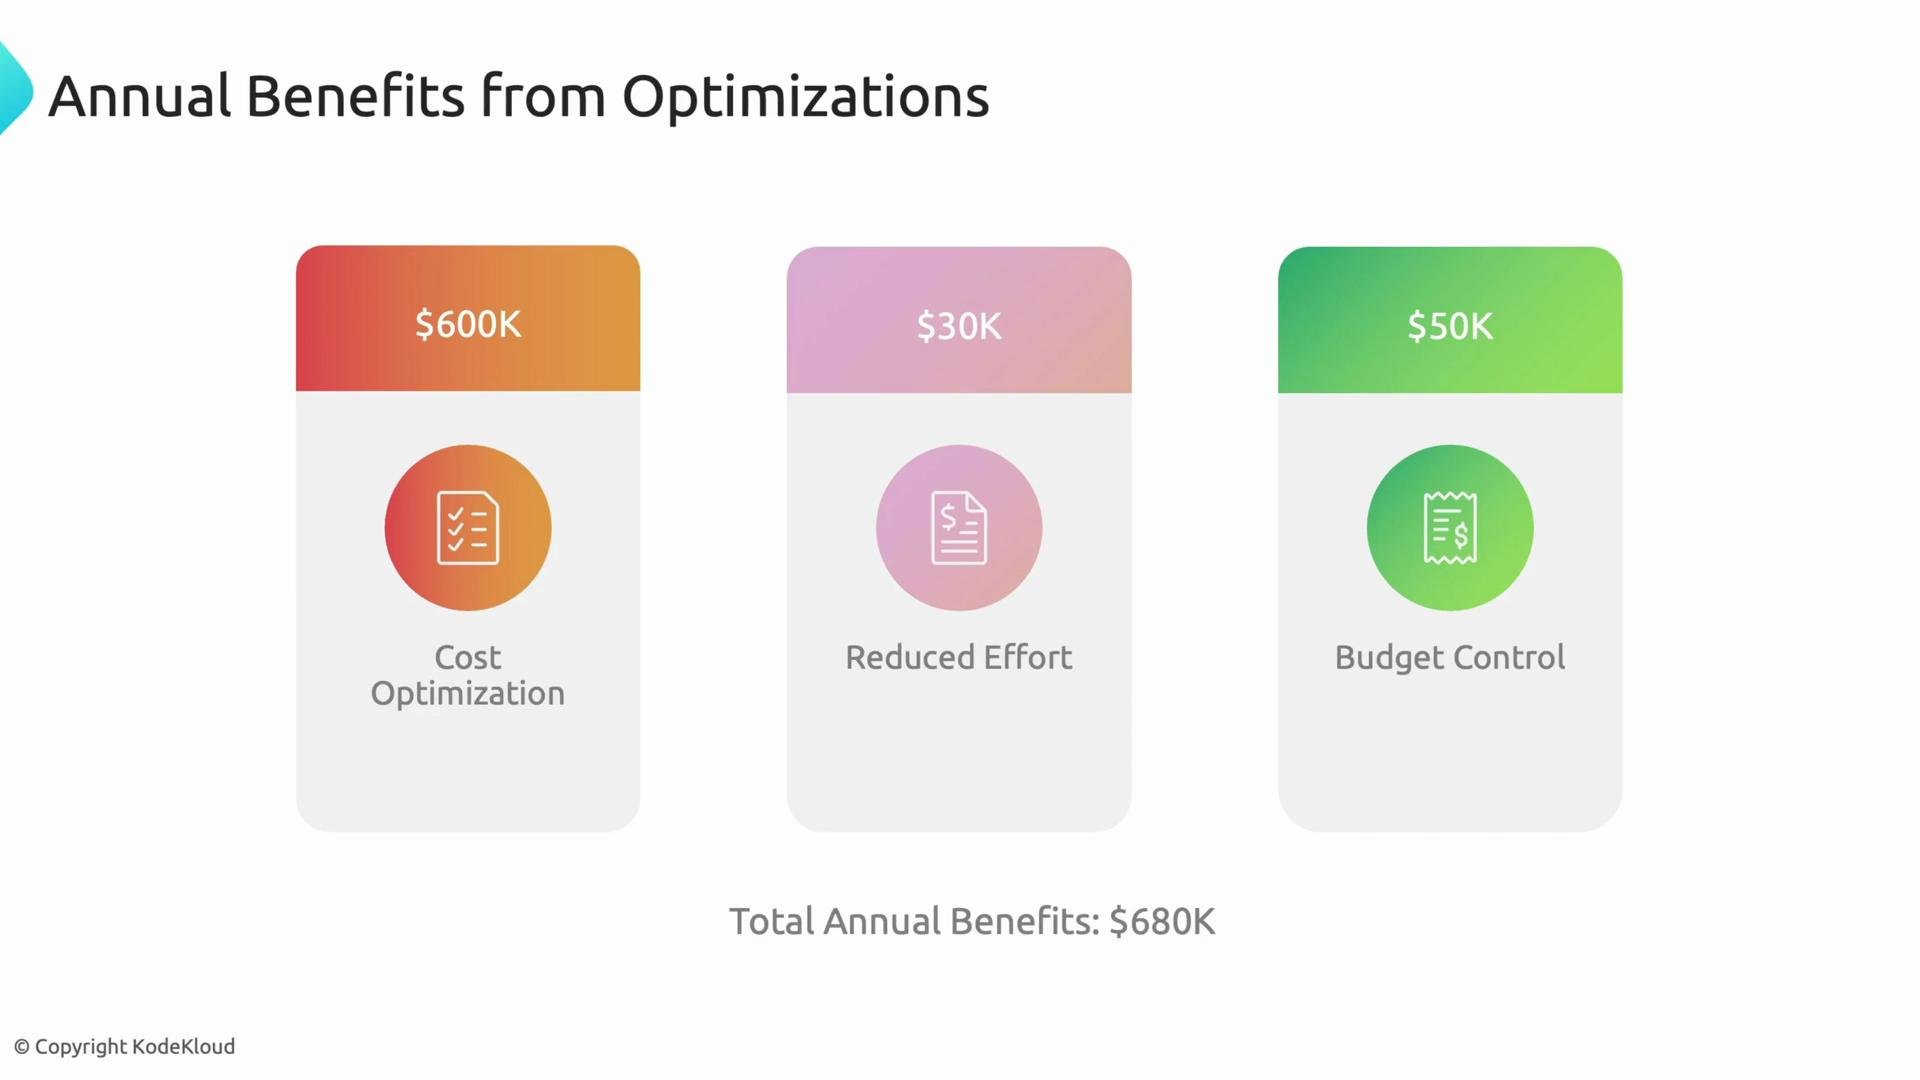
| Cost optimization | Rightsizing, reservations, waste reduction | \$600,000 |
| Reduced reporting effort | Automation + process changes | \$30,000 |
| Improved budget control | Better forecasting; avoided surprises | \$50,000 |
| **Total annual benefits** | | **\$680,000** |
These are plausible, data-driven pain points you might already be experiencing. If your organization is early in its FinOps maturity, start from the metrics you do track and be transparent about any gaps.
## Solution: investment (annual)
Propose a focused set of investments to address the pain points. Below are the estimated annual costs used in this example.
| Investment item | Purpose | Estimated annual cost |
| --------------------------- | ----------------------------------------------- | --------------------- |
| FinOps platform | Automated cost visibility and optimization | \$50,000 |
| Training & certification | Upskilling the team for FinOps practices | \$15,000 |
| FinOps engineer | Dedicated resource for execution and governance | \$120,000 |
| **Total annual investment** | | **\$185,000** |
Compare this investment to the projected benefits when making the case.
## Benefits (annual)
Estimate the quantifiable outcomes from the investment. These should be defensible and tied to the pain points above.
| Benefit | Source | Estimated annual benefit |
| ------------------------- | ------------------------------------------ | ------------------------ |
| Cost optimization | Rightsizing, reservations, waste reduction | \$600,000 |
| Reduced reporting effort | Automation + process changes | \$30,000 |
| Improved budget control | Better forecasting; avoided surprises | \$50,000 |
| **Total annual benefits** | | **\$680,000** |
 ## Financial metrics (simple, defendable)
Present two easy-to-understand financial metrics so leadership can quickly see the value.
| Metric | Calculation | Result |
| -------------------------- | -------------------------------------------------------------------------------------------------------- | ------------ |
| Return on Investment (ROI) | `ROI = (Total Benefits − Investment) / Investment × 100`
## Financial metrics (simple, defendable)
Present two easy-to-understand financial metrics so leadership can quickly see the value.
| Metric | Calculation | Result |
| -------------------------- | -------------------------------------------------------------------------------------------------------- | ------------ |
| Return on Investment (ROI) | `ROI = (Total Benefits − Investment) / Investment × 100`
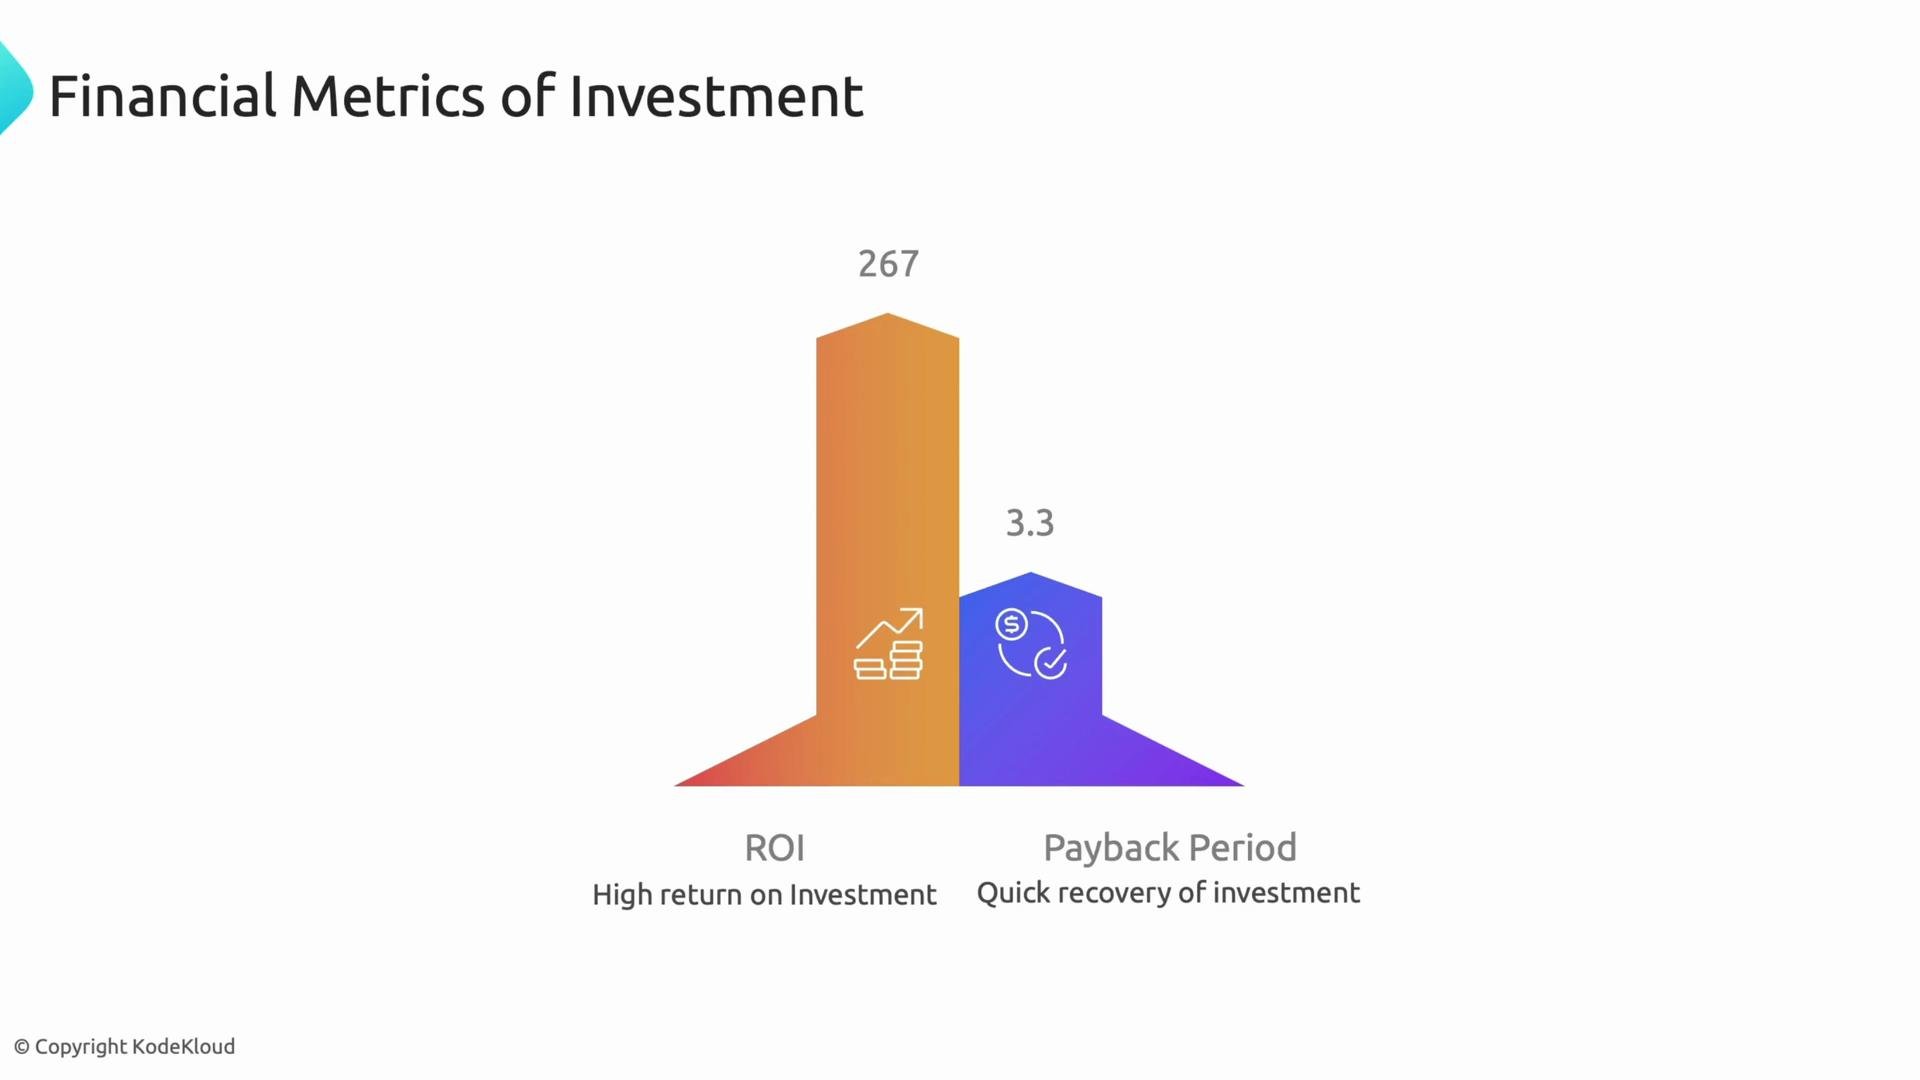
`= ($680,000 − $185,000) / $185,000 × 100` | ≈ 267% |
| Payback period | `Monthly benefit = $680,000 / 12 ≈ $56,667`
`Payback = $185,000 / $56,667` | ≈ 3.3 months |
These figures show a strong return and a short payback window, which are compelling points for stakeholder approval.
 These numbers are illustrative. Use your organization’s actual spend, waste estimates, and staffing costs when building your business case. Directionally accurate estimates are better than waiting for perfect precision—start small and iterate.
## Summary and next steps
* Translate concrete pain points (growth rates, wasted spend, manual effort, forecasting misses) into measurable costs.
* Propose targeted investments (platform, training, personnel) and estimate annual costs.
* Quantify benefits and present clear financial metrics—`ROI` and payback period—to make the case to leadership.
* Use this template to adapt estimates to your organization and iterate as you collect better data.
Links and references
* [FinOps Foundation](https://www.finops.org/)
* [Cloud cost optimization best practices (AWS)](https://aws.amazon.com/answers/management-tools/cost-optimization/)
* [Cloud cost management overview (Google Cloud)](https://cloud.google.com/products/cost-management)
These numbers are illustrative. Use your organization’s actual spend, waste estimates, and staffing costs when building your business case. Directionally accurate estimates are better than waiting for perfect precision—start small and iterate.
## Summary and next steps
* Translate concrete pain points (growth rates, wasted spend, manual effort, forecasting misses) into measurable costs.
* Propose targeted investments (platform, training, personnel) and estimate annual costs.
* Quantify benefits and present clear financial metrics—`ROI` and payback period—to make the case to leadership.
* Use this template to adapt estimates to your organization and iterate as you collect better data.
Links and references
* [FinOps Foundation](https://www.finops.org/)
* [Cloud cost optimization best practices (AWS)](https://aws.amazon.com/answers/management-tools/cost-optimization/)
* [Cloud cost management overview (Google Cloud)](https://cloud.google.com/products/cost-management)