> ## Documentation Index
> Fetch the complete documentation index at: https://notes.kodekloud.com/llms.txt
> Use this file to discover all available pages before exploring further.
# Demo Raise Alert using AlertManager
> Guide to creating a Prometheus rule that alerts when Argo CD applications go OutOfSync, testing drift, viewing alerts in Alertmanager, and routing notifications (e.g. Slack).
In this lesson you'll learn how to raise an Alertmanager alert whenever an Argo CD application becomes OutOfSync. We assume Alertmanager and Prometheus are already installed and accessible (Alertmanager via NodePort in this environment). This guide covers:
* Creating a Prometheus rule for Argo CD application drift
* Where to add the rule (Prometheus Operator `PrometheusRule`)
* How to test by introducing drift in an Argo CD application
* Viewing the fired alert in Alertmanager and forwarding notifications (Slack example)
## Define the Prometheus alert rule
Create a `PrometheusRule` group that triggers when Argo CD reports an OutOfSync application. The PromQL expression uses the `argocd_app_info` metric exposed by Argo CD.
```yaml theme={null}
# PrometheusRule group for Argo CD
- name: ArgoCD Rules
rules:
- alert: ArgoApplicationOutOfSync
expr: argocd_app_info{sync_status="OutOfSync"} == 1
for: 5m
labels:
severity: warning
annotations:
summary: "'{{ $labels.name }}' Application has synchronization issue"
```
### What each field means
| Field | Purpose | Example / Notes |
| ------------- | ------------------------------------------------------------ | -------------------------------------------------------------- |
| `name` | Group name that organizes related alerts | `ArgoCD Rules` |
| `alert` | Unique alert identifier shown in Alertmanager and dashboards | `ArgoApplicationOutOfSync` |
| `expr` | PromQL expression that evaluates the condition | `argocd_app_info{sync_status="OutOfSync"} == 1` |
| `for` | Minimum duration the condition must hold before firing | `5m` to avoid transient noise |
| `labels` | Metadata for alert routing and severity | `severity: warning` (use `critical` for high priority) |
| `annotations` | Human-readable descriptions inserted into notifications | `summary` using `{{ $labels.name }}` to reference the app name |
## Where to add this rule
Add the group into an existing `PrometheusRule` resource managed by the Prometheus Operator (namespace often `monitoring`). Example commands to inspect and edit the PrometheusRule:
```bash theme={null}
kubectl -n monitoring get prometheusrules.monitoring.coreos.com kode-kloud-prometheus-stac-alertmanager.rules -o yaml
kubectl -n monitoring edit prometheusrules.monitoring.coreos.com kode-kloud-prometheus-stac-alertmanager.rules
```
Insert the `ArgoCD Rules` group inside the `spec.groups` array. Example fragment showing the ArgoCD group placed at the top of `spec.groups`:
```yaml theme={null}
spec:
groups:
- name: ArgoCD Rules
rules:
- alert: ArgoApplicationOutOfSync
expr: argocd_app_info{sync_status="OutOfSync"} == 1
for: 5m
labels:
severity: warning
annotations:
summary: "'{{ $labels.name }}' Application has synchronization issue"
# ... other groups and rules follow ...
```
After saving, the Prometheus Operator will reconcile the `PrometheusRule`; Prometheus will reload rules automatically, which can take a short moment.
## Test the alert by causing drift
To test the rule, make an Argo CD application go OutOfSync. A simple approach is to modify the live cluster resource so it no longer matches the Git desired state.
Open the Argo CD application UI and select an application to test. You can also directly edit a Deployment to introduce drift.
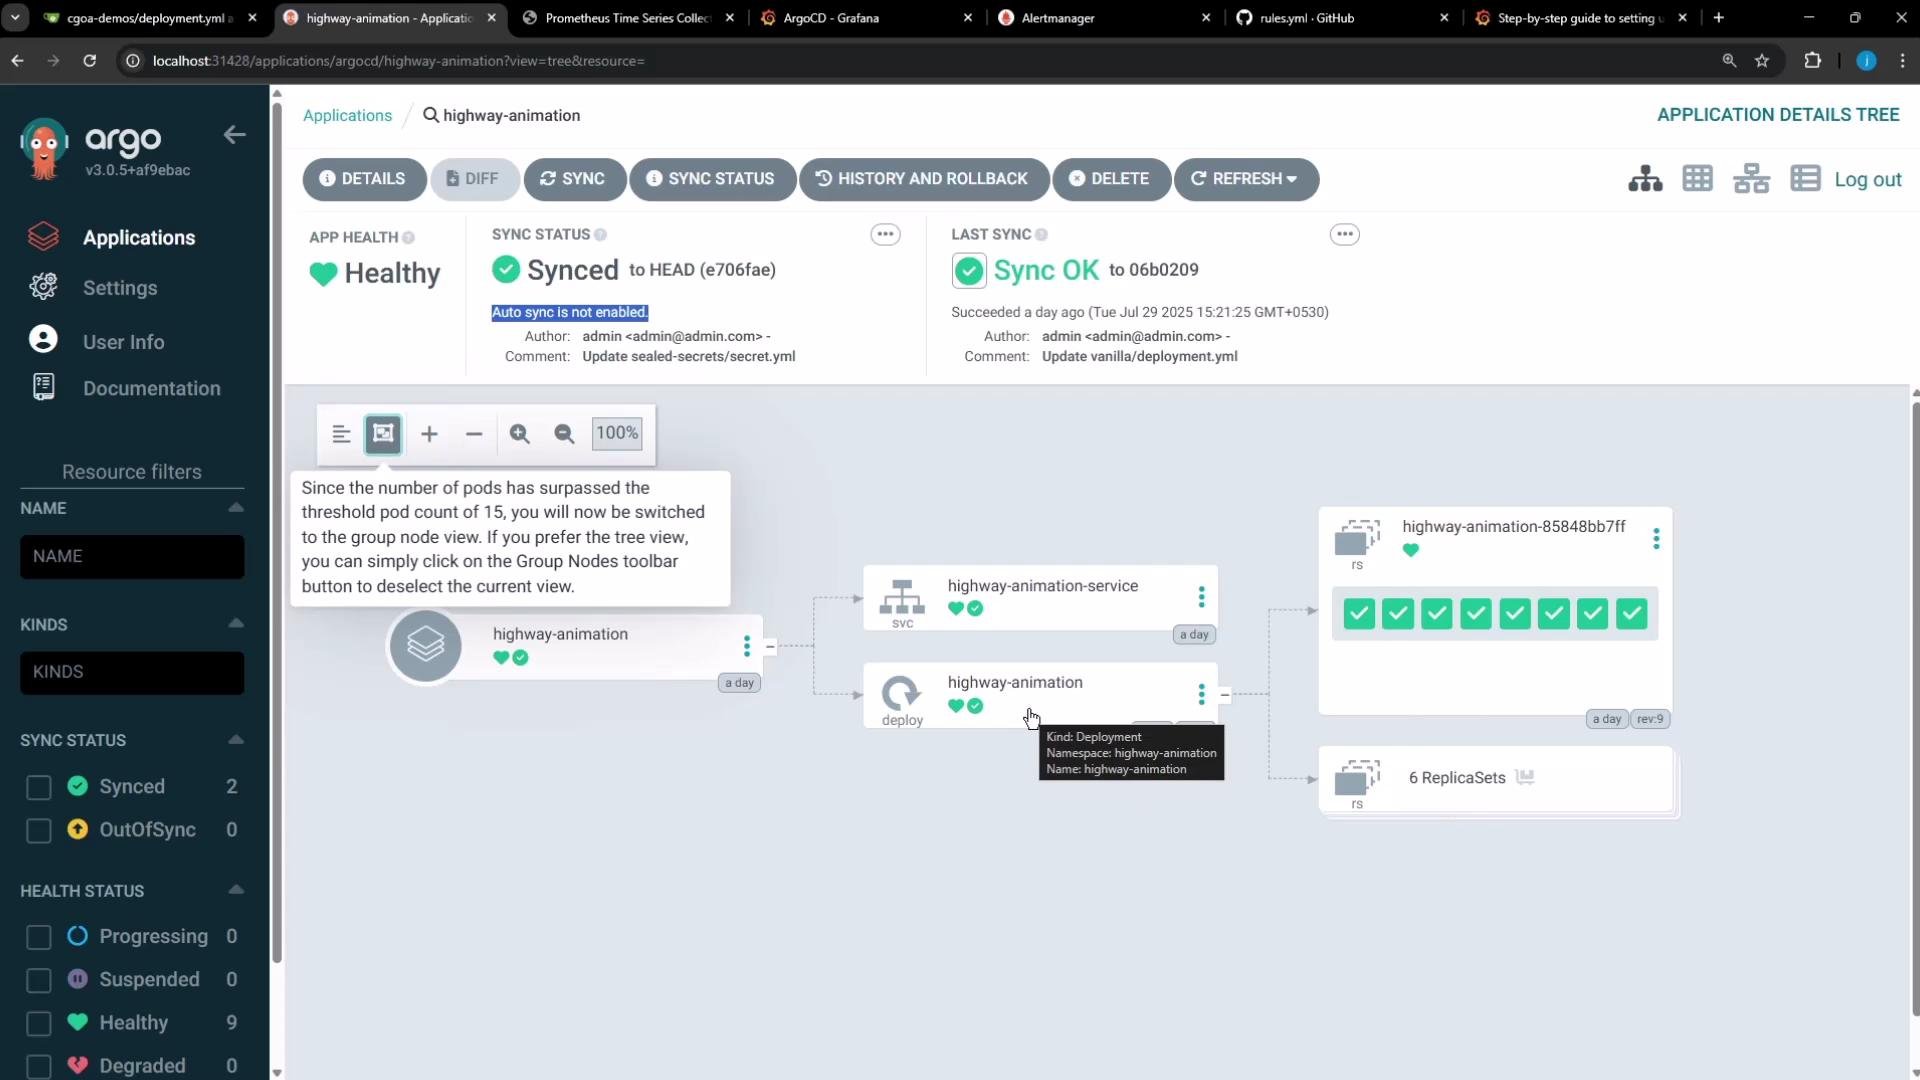 Example: edit the live Deployment to change replicas or a container env value:
```bash theme={null}
kubectl -n highway-animation edit deployment highway-animation
```
Example deployment fragment (this was edited live to create drift):
```yaml theme={null}
spec:
replicas: 1
template:
spec:
containers:
- name: highway-animation
image: siddharth67/highway-animation:blue
env:
- name: POD_COUNT
value: "8"
ports:
- containerPort: 3000
protocol: TCP
```
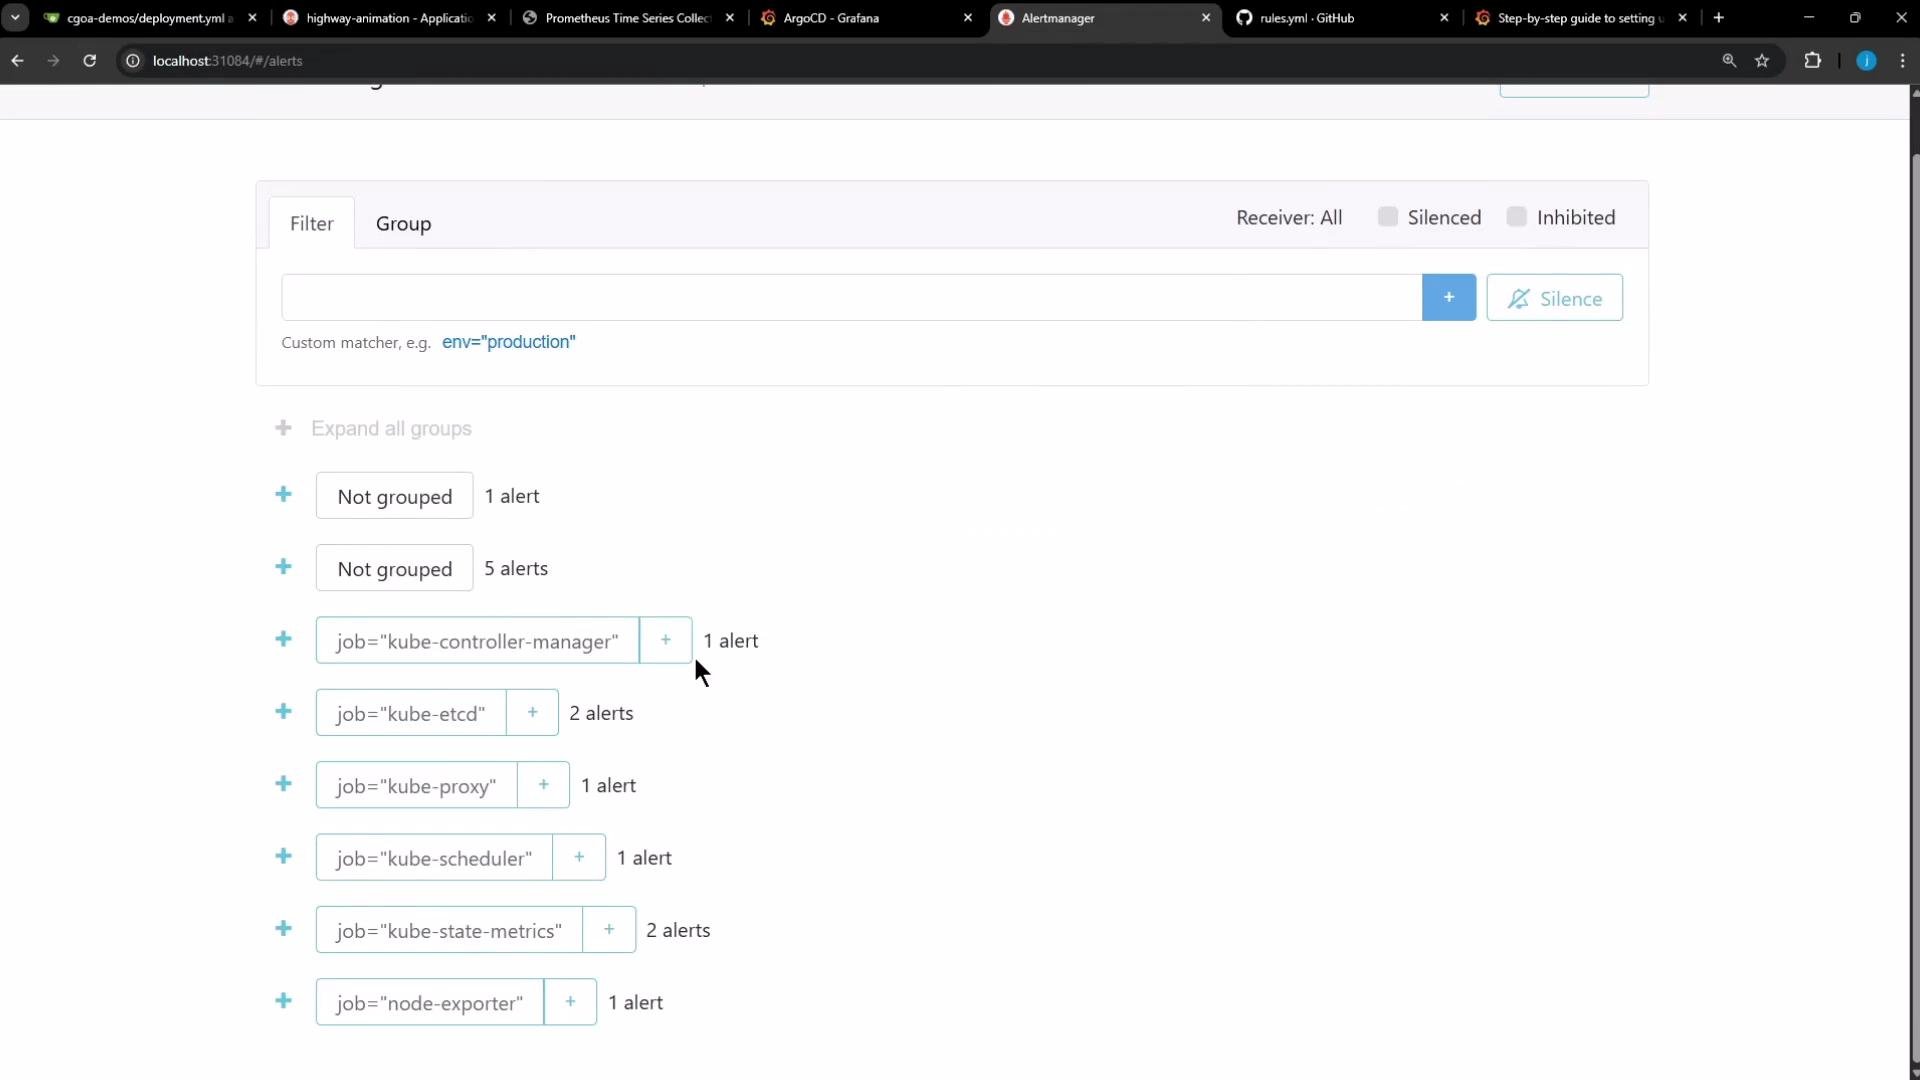
Once the application reports `OutOfSync` and the rule evaluates true for `for: 5m`, the alert will fire in Alertmanager. While waiting, Alertmanager may display other currently active alerts.
Example: edit the live Deployment to change replicas or a container env value:
```bash theme={null}
kubectl -n highway-animation edit deployment highway-animation
```
Example deployment fragment (this was edited live to create drift):
```yaml theme={null}
spec:
replicas: 1
template:
spec:
containers:
- name: highway-animation
image: siddharth67/highway-animation:blue
env:
- name: POD_COUNT
value: "8"
ports:
- containerPort: 3000
protocol: TCP
```
Once the application reports `OutOfSync` and the rule evaluates true for `for: 5m`, the alert will fire in Alertmanager. While waiting, Alertmanager may display other currently active alerts.
 ## Viewing the fired alert
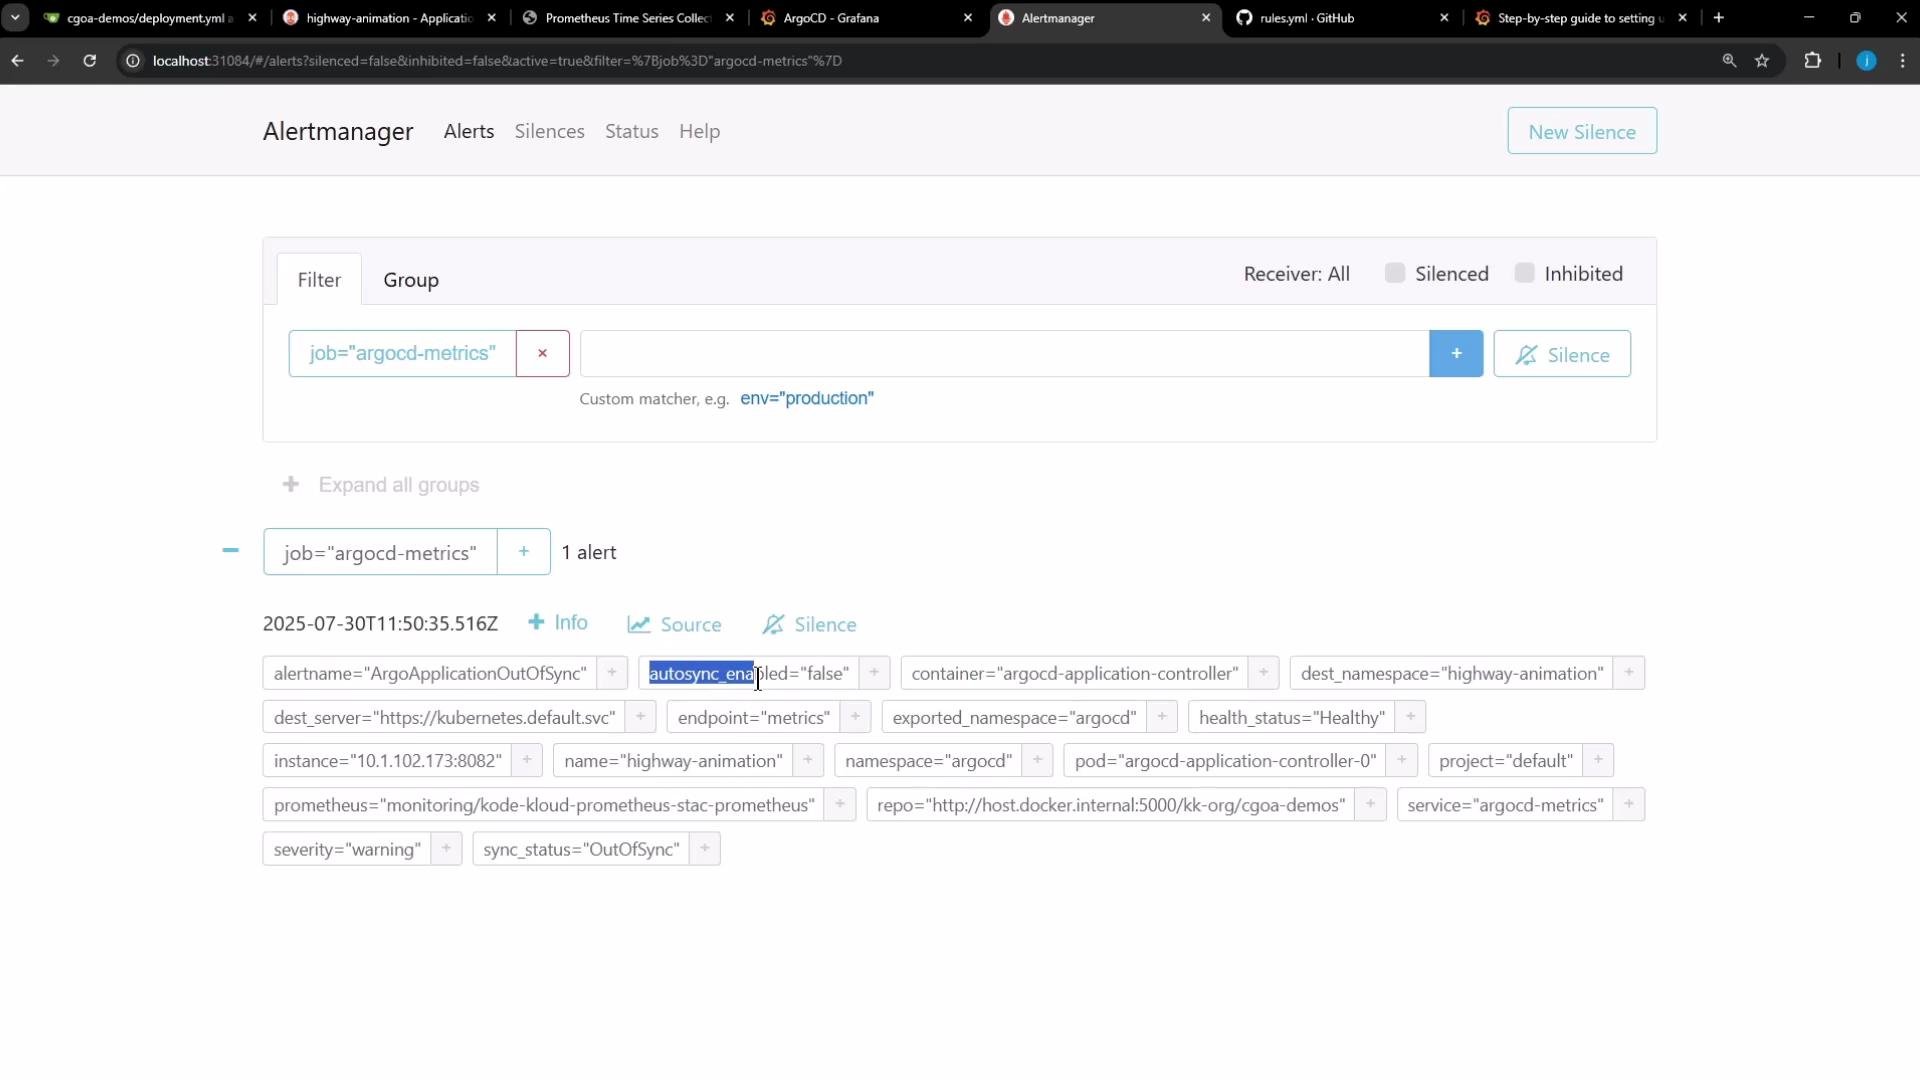
After the `for` window elapses and the alert fires, Alertmanager will show the new alert. The alert details include labels such as `job="argocd-metrics"`, `namespace`, the application name, repository URL, and the `severity` label.
## Viewing the fired alert
After the `for` window elapses and the alert fires, Alertmanager will show the new alert. The alert details include labels such as `job="argocd-metrics"`, `namespace`, the application name, repository URL, and the `severity` label.
 ## Forwarding alerts (Slack example)
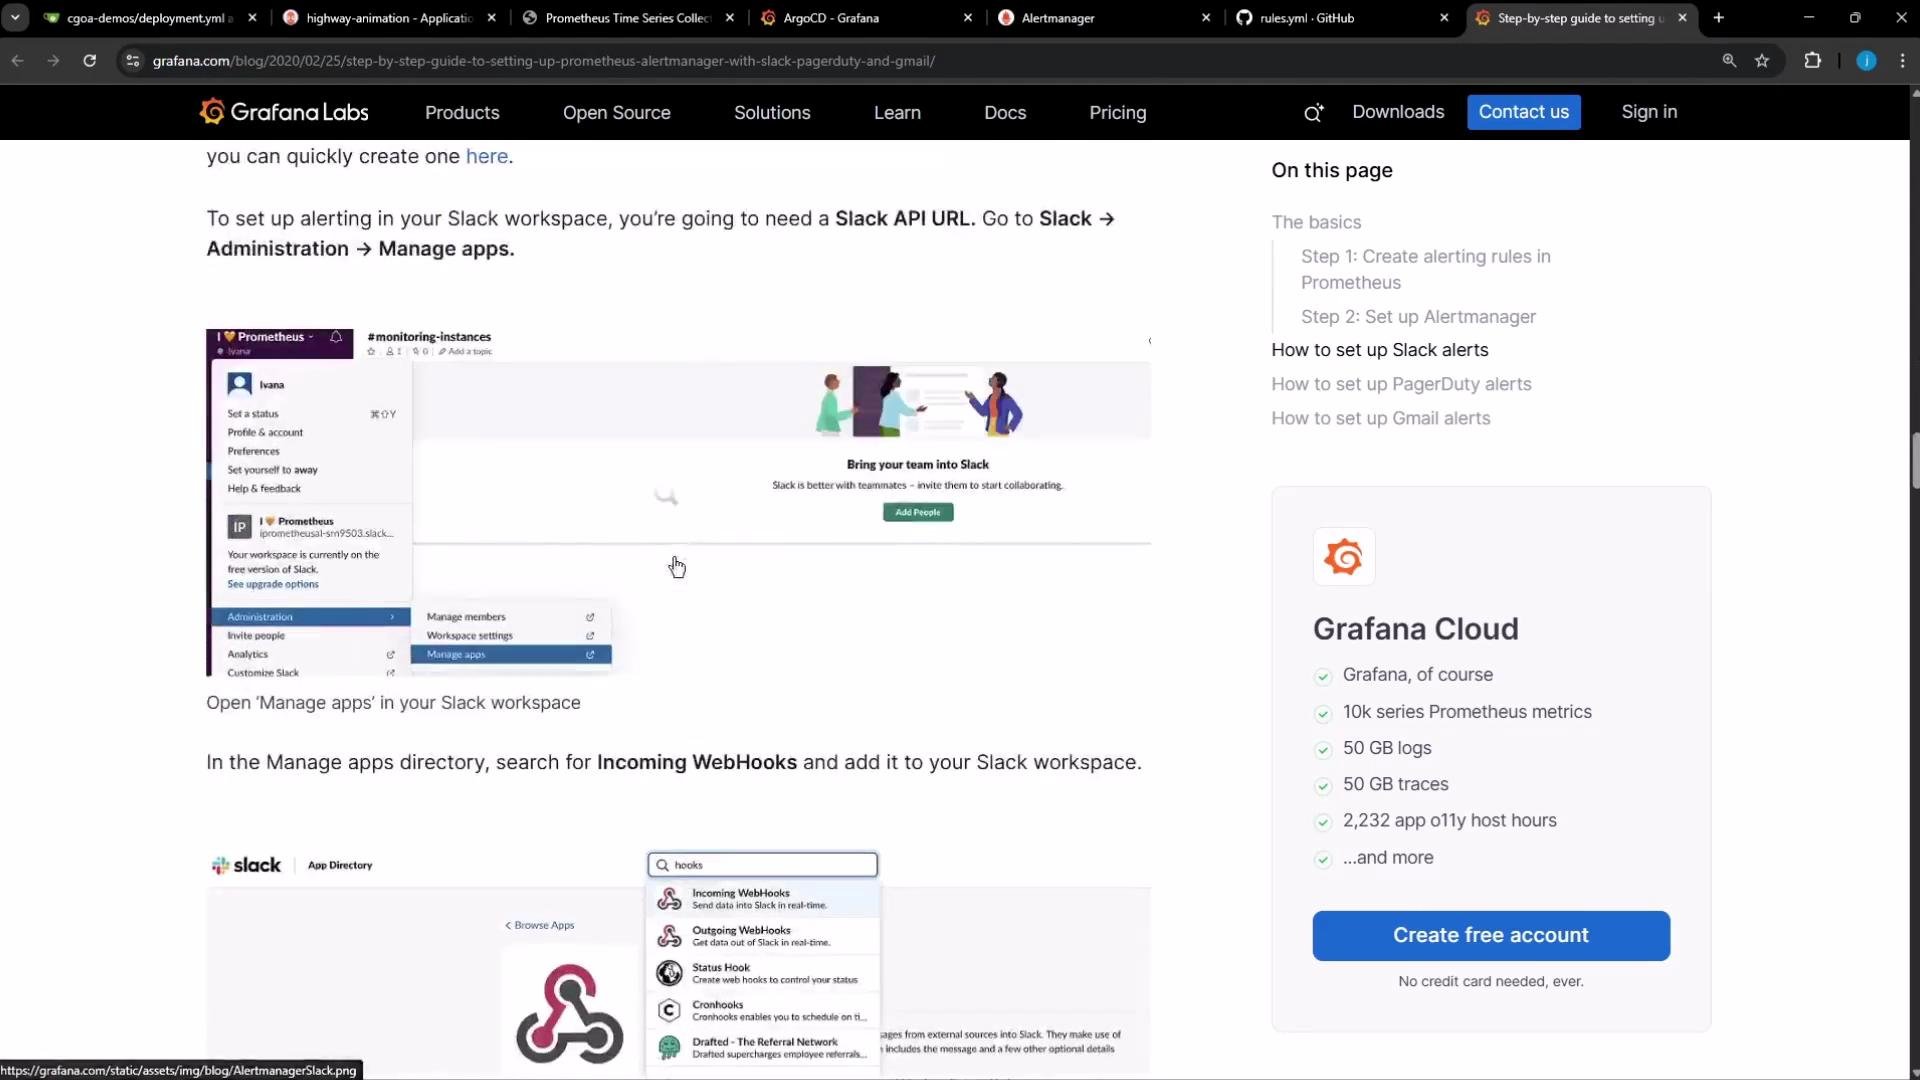
Once the alert appears in Alertmanager you can route it to external receivers (Slack, PagerDuty, email, etc.) by configuring Alertmanager receivers and routes.
Ensure the `argocd_app_info` metric is being scraped by Prometheus. Argo CD exposes metrics via the argocd-metrics endpoint; if Prometheus isn't scraping `argocd-metrics`, the rule cannot evaluate true.
Example Alertmanager Slack configuration (in Alertmanager YAML):
```yaml theme={null}
global:
resolve_timeout: 1m
slack_api_url: 'https://hooks.slack.com/services/TSUJ1MIHQ/BT7J5TR5/5eZMpDbKk8wk2'
route:
receiver: 'slack-notifications'
receivers:
- name: 'slack-notifications'
slack_configs:
- channel: '#monitoring-instances'
send_resolved: true
```
Example Slack message template for Alertmanager (use in templates files):
```yaml theme={null}
{{- /* Example Slack message template for Alertmanager */ -}}
text: >
{{ range .Alerts -}}
*Alert:* {{ .Annotations.title }}{{ if .Labels.severity }} - `{{ .Labels.severity }}`{{ end }}
*Description:* {{ .Annotations.description }}
*Details:*
{{ range .Labels.SortedPairs -}}
* {{ .Name }}: `{{ .Value }}`
{{ end }}
{{ end }}
```
## Forwarding alerts (Slack example)
Once the alert appears in Alertmanager you can route it to external receivers (Slack, PagerDuty, email, etc.) by configuring Alertmanager receivers and routes.
Ensure the `argocd_app_info` metric is being scraped by Prometheus. Argo CD exposes metrics via the argocd-metrics endpoint; if Prometheus isn't scraping `argocd-metrics`, the rule cannot evaluate true.
Example Alertmanager Slack configuration (in Alertmanager YAML):
```yaml theme={null}
global:
resolve_timeout: 1m
slack_api_url: 'https://hooks.slack.com/services/TSUJ1MIHQ/BT7J5TR5/5eZMpDbKk8wk2'
route:
receiver: 'slack-notifications'
receivers:
- name: 'slack-notifications'
slack_configs:
- channel: '#monitoring-instances'
send_resolved: true
```
Example Slack message template for Alertmanager (use in templates files):
```yaml theme={null}
{{- /* Example Slack message template for Alertmanager */ -}}
text: >
{{ range .Alerts -}}
*Alert:* {{ .Annotations.title }}{{ if .Labels.severity }} - `{{ .Labels.severity }}`{{ end }}
*Description:* {{ .Annotations.description }}
*Details:*
{{ range .Labels.SortedPairs -}}
* {{ .Name }}: `{{ .Value }}`
{{ end }}
{{ end }}
```
 ## Notes and next steps
* After confirming the alert works, refine labels and routing in your Alertmanager configuration to match your on-call and escalation workflows.
* Use `severity` labels to differentiate notification channels (e.g., `warning` -> pager muted, `critical` -> paged).
* Integrate Grafana or other visualization tools to display Argo CD metrics and alert status.
Useful references:
* [Prometheus Operator documentation](https://github.com/prometheus-operator/prometheus-operator)
* [Argo CD metrics & monitoring](https://argo-cd.readthedocs.io/en/stable/operator-manual/metrics/)
* [Alertmanager configuration guide](https://prometheus.io/docs/alerting/latest/alertmanager/)
* [Kubernetes Basics](https://kubernetes.io/docs/concepts/overview/what-is-kubernetes/)
* Grafana Slack notifications: [https://grafana.com/docs/grafana/latest/alerting/notifications/notification-channels/slack/](https://grafana.com/docs/grafana/latest/alerting/notifications/notification-channels/slack/)
That’s how you create an alert for Argo CD application drift, see it in Alertmanager, and route notifications to external systems like Slack.
## Notes and next steps
* After confirming the alert works, refine labels and routing in your Alertmanager configuration to match your on-call and escalation workflows.
* Use `severity` labels to differentiate notification channels (e.g., `warning` -> pager muted, `critical` -> paged).
* Integrate Grafana or other visualization tools to display Argo CD metrics and alert status.
Useful references:
* [Prometheus Operator documentation](https://github.com/prometheus-operator/prometheus-operator)
* [Argo CD metrics & monitoring](https://argo-cd.readthedocs.io/en/stable/operator-manual/metrics/)
* [Alertmanager configuration guide](https://prometheus.io/docs/alerting/latest/alertmanager/)
* [Kubernetes Basics](https://kubernetes.io/docs/concepts/overview/what-is-kubernetes/)
* Grafana Slack notifications: [https://grafana.com/docs/grafana/latest/alerting/notifications/notification-channels/slack/](https://grafana.com/docs/grafana/latest/alerting/notifications/notification-channels/slack/)
That’s how you create an alert for Argo CD application drift, see it in Alertmanager, and route notifications to external systems like Slack.