> ## Documentation Index
> Fetch the complete documentation index at: https://notes.kodekloud.com/llms.txt
> Use this file to discover all available pages before exploring further.
# Introduction
> Hands-on course preparing engineers for OpenTelemetry Certified Associate exam teaching instrumentation, tracing, metrics, logs, Collector deployment, OTTL, debugging, and real world observability practices in cloud native systems
Did you know OpenTelemetry is one of the most active projects in the Cloud Native Computing Foundation (CNCF) and consistently ranks high in contributor activity? As modern applications scale across microservices, clouds, containers, and platforms, unified observability becomes essential to understand performance, reliability, and failures.
OpenTelemetry (OTel) is the de facto standard for collecting, processing, and exporting telemetry data—traces, metrics, and logs—across distributed systems. This course, the OpenTelemetry Certified Associate (OTCA) certification preparation, focuses on practical, production-relevant skills to instrument, collect, and analyze telemetry data using OTel.
I'm Amrith Raj, and I'll guide you through this hands-on course. You’ll gain the knowledge required for the OTCA exam and the real-world experience to operate telemetry pipelines, configure the OpenTelemetry Collector, and design observability for resilient systems. The course includes labs, demos, and mock exams to ensure you’re exam- and production-ready.
Here’s a quick look at what you’ll learn in this course.
 ## What this course covers (high level)
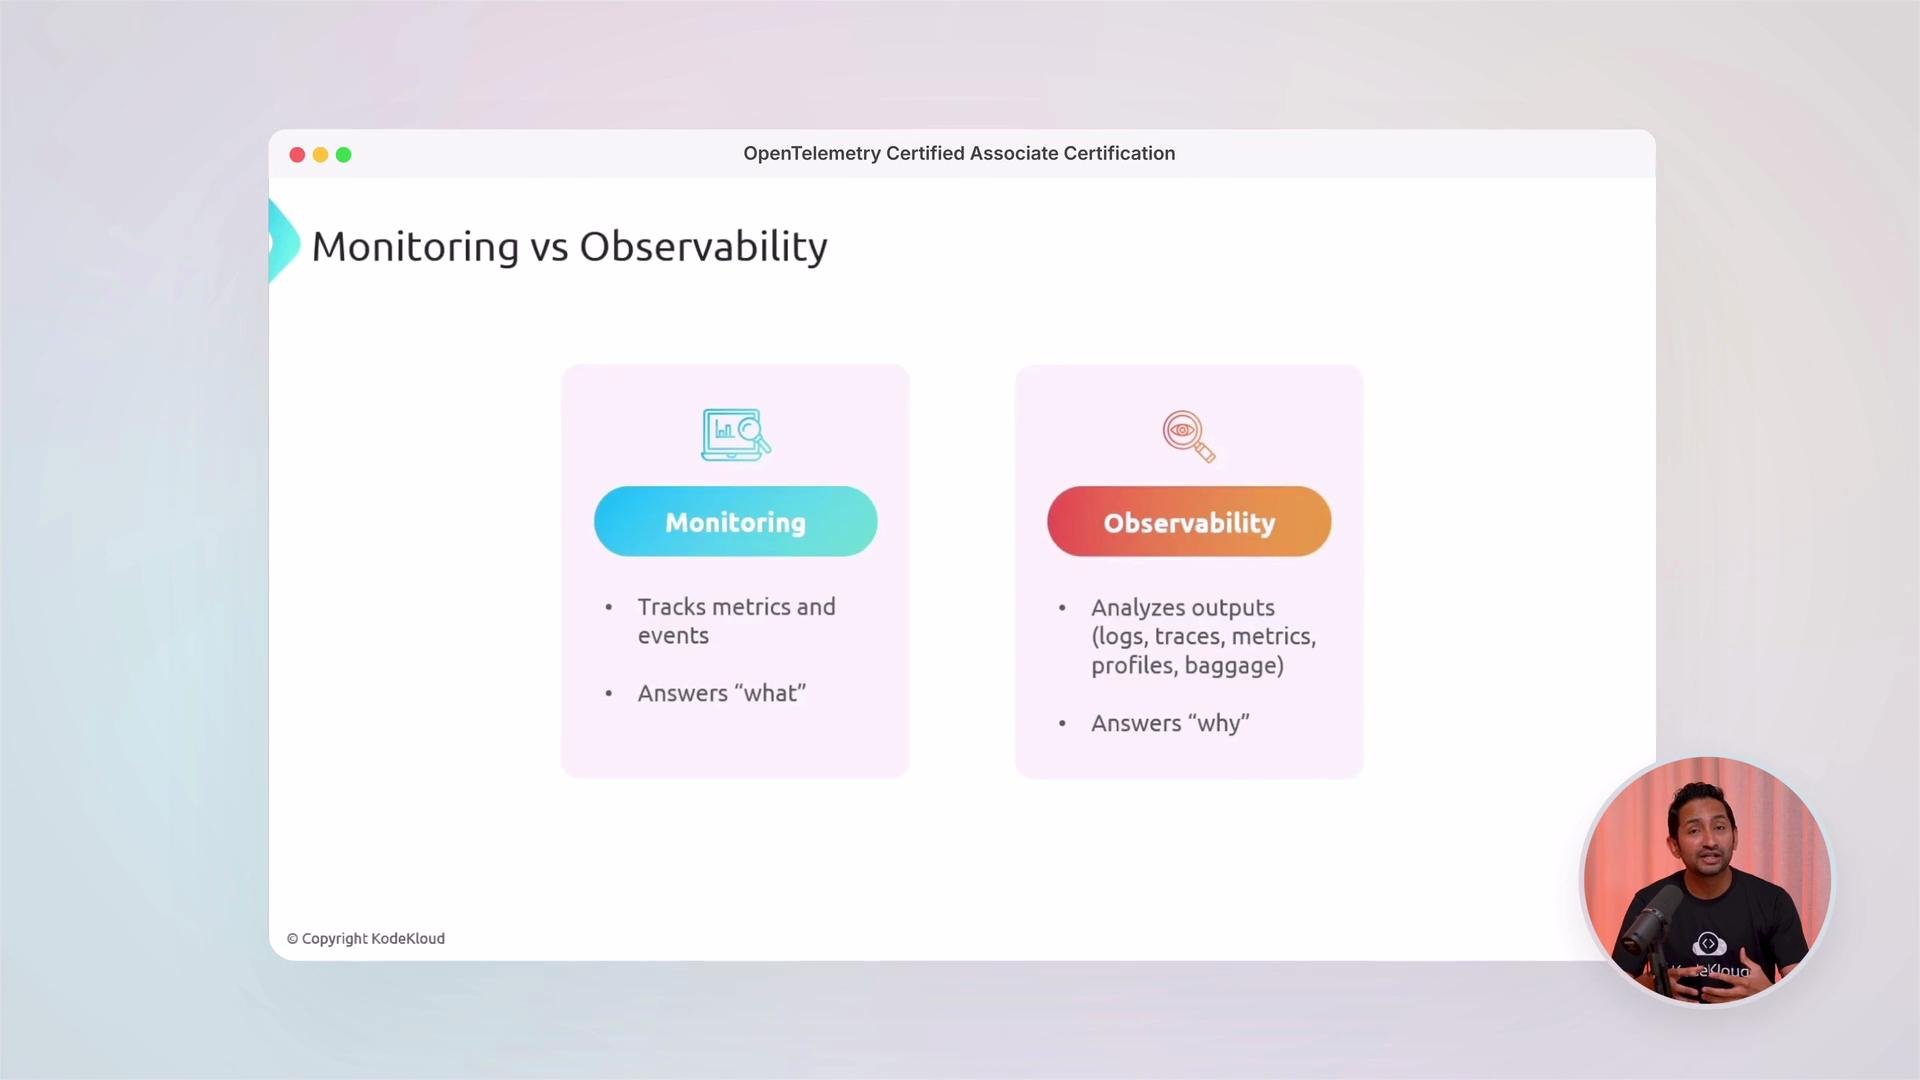
* Core observability concepts: monitoring vs observability, distributed systems fundamentals, and why OpenTelemetry matters.
* OpenTelemetry fundamentals: mission, design principles, architecture (APIs, SDKs, client libraries), and OTLP semantics.
* Tracing: span anatomy, context propagation, distributed traces, attributes, events, baggage.
* Instrumentation: manual vs automatic instrumentation, span processors, exporters, and hands-on instrumentation in Java and Python.
* Metrics: OTel metrics model, temporality, aggregation, cardinality, exemplars, and the Metrics API/SDK.
* Logs: unified logging model in OpenTelemetry and correlating logs with traces for deeper insights.
* OpenTelemetry Collector: receivers, processors, connectors, exporters, deployment patterns (Docker, Kubernetes), and operator-based auto-instrumentation.
* OTTL (OpenTelemetry Transformation Language): filters, transforms, PII removal, field renames, and enrichment.
* Operations: monitoring Collector health, internal telemetry, debugging, and scaling high-volume pipelines.
## Course modules at a glance
| Module | Key topics | Hands-on labs |
| ----------------------------- | ----------------------------------------------------------------- | --------------------------------------------------- |
| Observability Fundamentals | Monitoring vs observability, distributed systems, telemetry types | Explore real-world examples comparing signal types |
| Tracing & Context Propagation | Span anatomy, trace context, baggage | Instrument a service to generate distributed traces |
| Instrumentation | Manual & auto-instrumentation, SDKs, exporters | Java and Python instrumentation labs |
| Metrics | Data model, temporality, aggregation, exemplars | Create and export application and system metrics |
| Logs & Correlation | Unified logging model, log-to-trace correlation | Correlate logs with trace IDs |
| OpenTelemetry Collector | Receivers, processors, exporters, deployment models | Deploy Collector in Docker and Kubernetes |
| OTTL | Filter/transform pipelines, sensitive data removal | Create OTTL rules to sanitize telemetry |
| Operations & Debugging | zPages, internal telemetry, scaling strategies | Enable and use Collector debugging endpoints |
## OpenTelemetry core concepts
You’ll begin with the mission and architecture of OpenTelemetry—how APIs, SDKs, and exporters form a vendor-neutral instrumentation stack. Understanding OTLP (OpenTelemetry Protocol) and exporter semantics helps you design reliable telemetry pipelines that are interoperable across backends.
Next, we dive into distributed tracing: how spans link services end-to-end, the role of attributes and events, and how context propagation and baggage carry context across process and network boundaries.
## What this course covers (high level)
* Core observability concepts: monitoring vs observability, distributed systems fundamentals, and why OpenTelemetry matters.
* OpenTelemetry fundamentals: mission, design principles, architecture (APIs, SDKs, client libraries), and OTLP semantics.
* Tracing: span anatomy, context propagation, distributed traces, attributes, events, baggage.
* Instrumentation: manual vs automatic instrumentation, span processors, exporters, and hands-on instrumentation in Java and Python.
* Metrics: OTel metrics model, temporality, aggregation, cardinality, exemplars, and the Metrics API/SDK.
* Logs: unified logging model in OpenTelemetry and correlating logs with traces for deeper insights.
* OpenTelemetry Collector: receivers, processors, connectors, exporters, deployment patterns (Docker, Kubernetes), and operator-based auto-instrumentation.
* OTTL (OpenTelemetry Transformation Language): filters, transforms, PII removal, field renames, and enrichment.
* Operations: monitoring Collector health, internal telemetry, debugging, and scaling high-volume pipelines.
## Course modules at a glance
| Module | Key topics | Hands-on labs |
| ----------------------------- | ----------------------------------------------------------------- | --------------------------------------------------- |
| Observability Fundamentals | Monitoring vs observability, distributed systems, telemetry types | Explore real-world examples comparing signal types |
| Tracing & Context Propagation | Span anatomy, trace context, baggage | Instrument a service to generate distributed traces |
| Instrumentation | Manual & auto-instrumentation, SDKs, exporters | Java and Python instrumentation labs |
| Metrics | Data model, temporality, aggregation, exemplars | Create and export application and system metrics |
| Logs & Correlation | Unified logging model, log-to-trace correlation | Correlate logs with trace IDs |
| OpenTelemetry Collector | Receivers, processors, exporters, deployment models | Deploy Collector in Docker and Kubernetes |
| OTTL | Filter/transform pipelines, sensitive data removal | Create OTTL rules to sanitize telemetry |
| Operations & Debugging | zPages, internal telemetry, scaling strategies | Enable and use Collector debugging endpoints |
## OpenTelemetry core concepts
You’ll begin with the mission and architecture of OpenTelemetry—how APIs, SDKs, and exporters form a vendor-neutral instrumentation stack. Understanding OTLP (OpenTelemetry Protocol) and exporter semantics helps you design reliable telemetry pipelines that are interoperable across backends.
Next, we dive into distributed tracing: how spans link services end-to-end, the role of attributes and events, and how context propagation and baggage carry context across process and network boundaries.
 ## Instrumentation—manual and zero-code
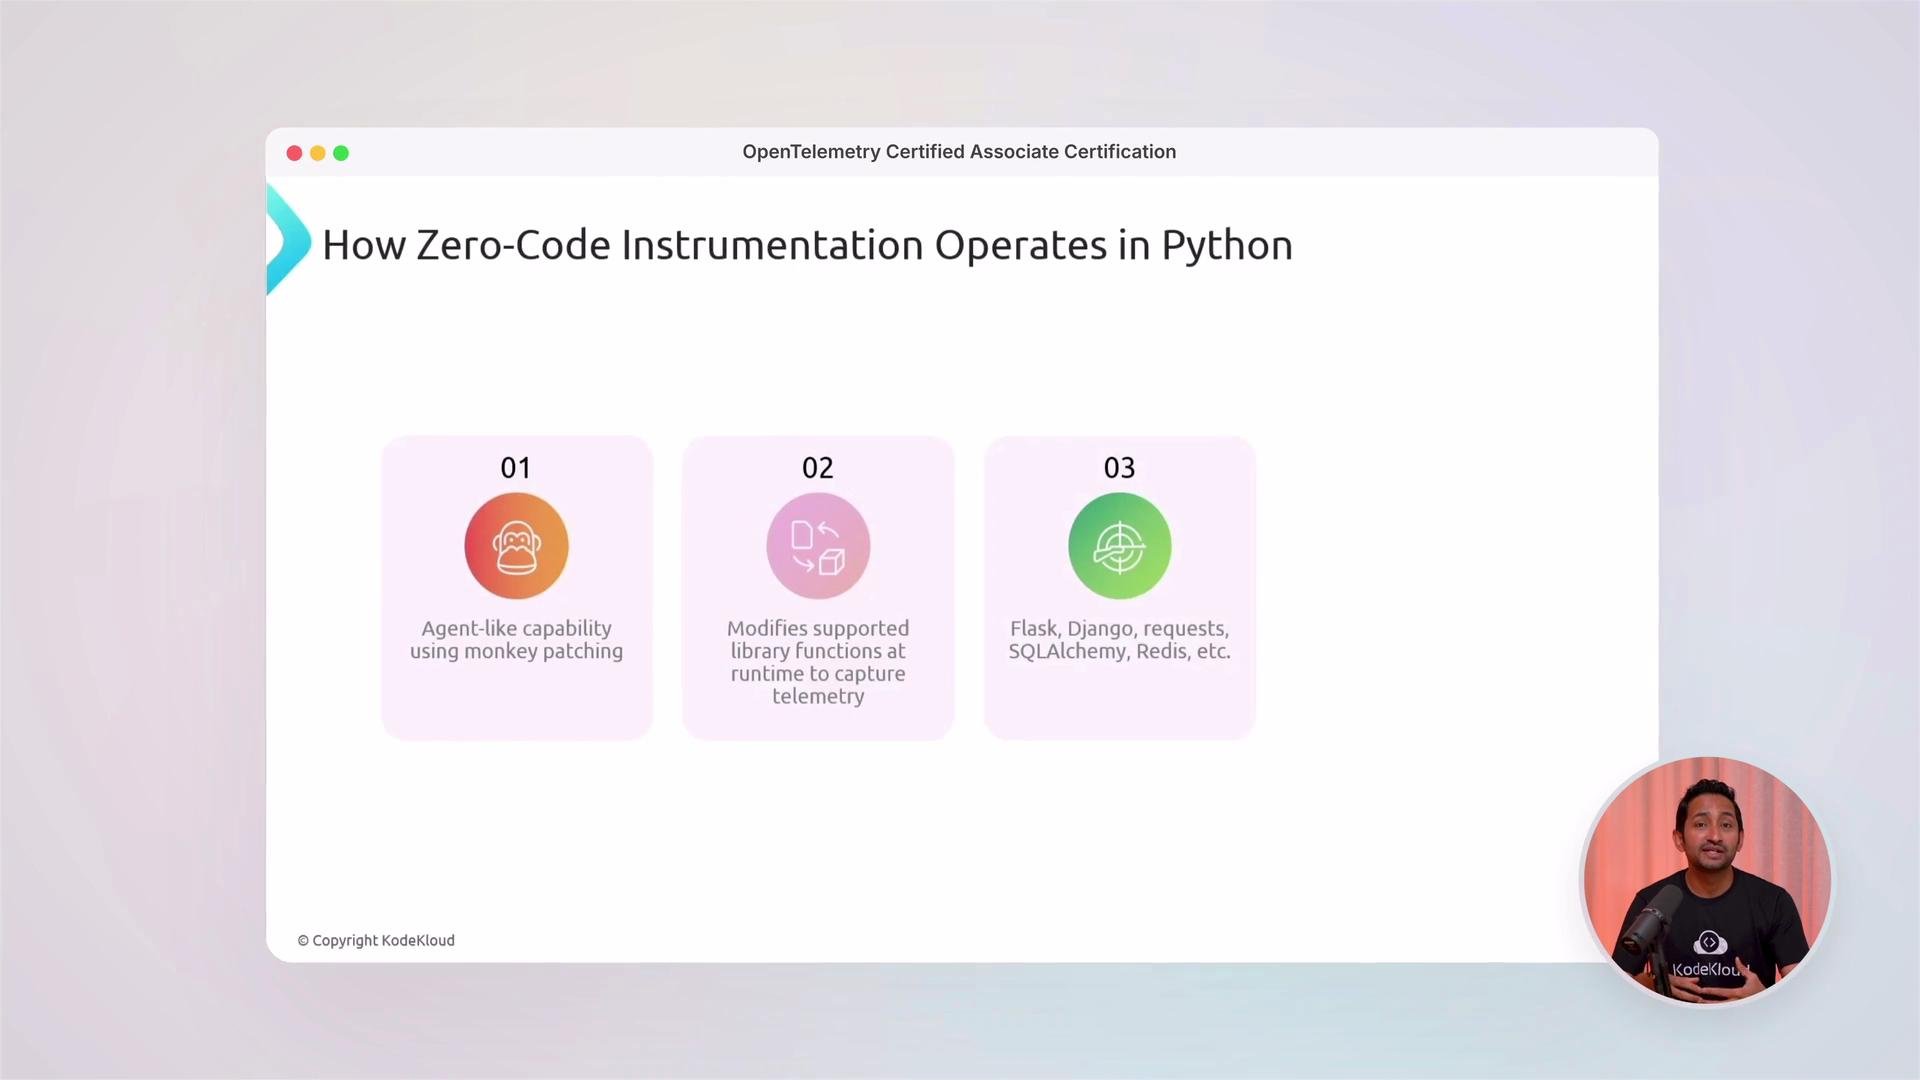
Instrumentation is the foundation of observability. This course explains when to use manual instrumentation (for fine-grained spans and custom attributes) versus automatic/zero-code instrumentation (where an agent or library instruments framework calls). You’ll learn about span processors, batching exporters, and best practices to manage cardinality and sampling.
## Metrics: model and measurement
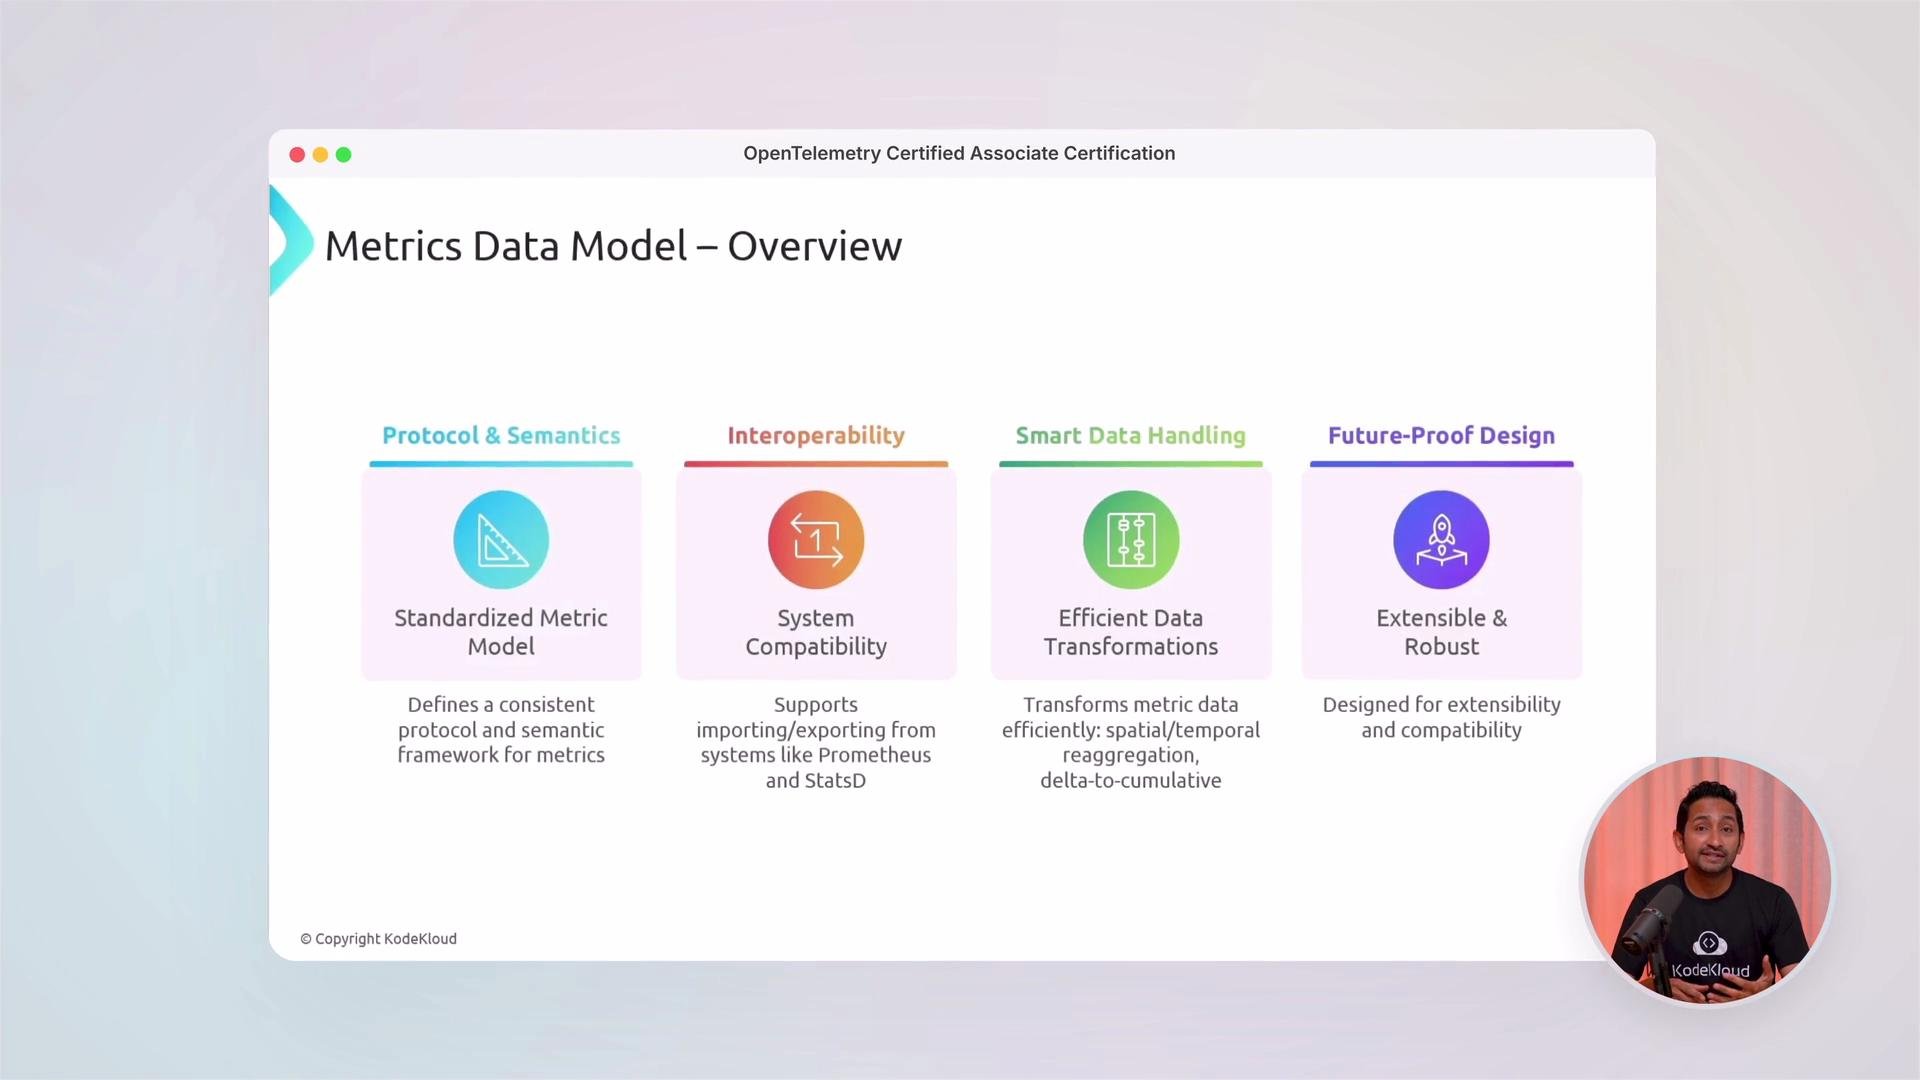
Understanding metrics requires familiarity with temporality, monotonic vs non-monotonic instruments, aggregation strategies, cardinality constraints, and exemplars. We cover how the OTel Metrics API and SDK represent these concepts and how to choose the right instruments and aggregation for system and business metrics.
## Instrumentation—manual and zero-code
Instrumentation is the foundation of observability. This course explains when to use manual instrumentation (for fine-grained spans and custom attributes) versus automatic/zero-code instrumentation (where an agent or library instruments framework calls). You’ll learn about span processors, batching exporters, and best practices to manage cardinality and sampling.
## Metrics: model and measurement
Understanding metrics requires familiarity with temporality, monotonic vs non-monotonic instruments, aggregation strategies, cardinality constraints, and exemplars. We cover how the OTel Metrics API and SDK represent these concepts and how to choose the right instruments and aggregation for system and business metrics.
 ## Logs and correlation
You’ll learn OpenTelemetry’s unified logging model and strategies to enrich logs with trace context so logs become actionable within distributed traces. This correlation is critical for root-cause analysis and understanding end-to-end request behavior.
## OpenTelemetry Collector and Kubernetes
The Collector is the central, extensible piece that receives, processes, and exports telemetry. We cover common receivers, processors, connectors, and exporters, along with deployment models in Docker and Kubernetes. You’ll also deploy the OpenTelemetry Kubernetes Operator to enable auto-instrumentation for workloads running on the cluster.
## OpenTelemetry Transformation Language (OTTL)
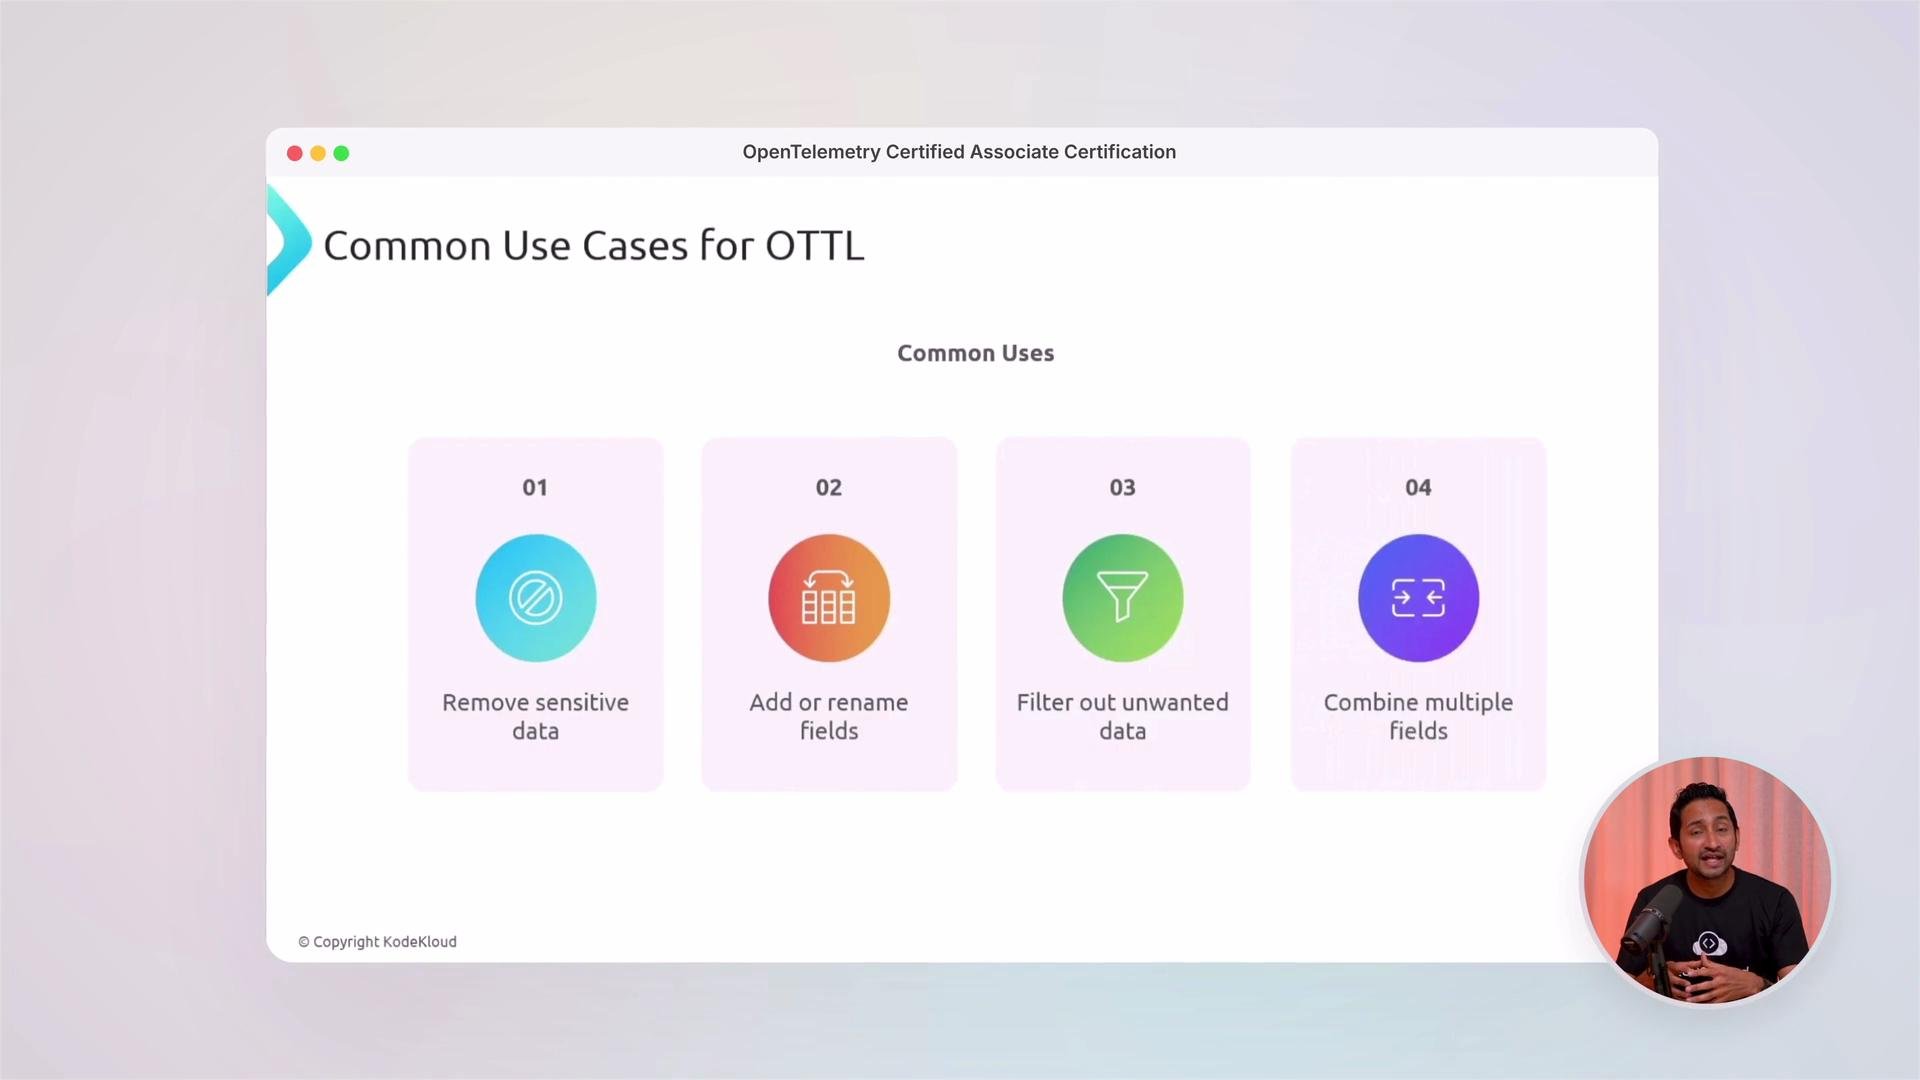
OTTL provides a powerful, declarative way to filter and transform telemetry inside the Collector pipeline. Typical use cases include:
* Removing or masking sensitive data (PII)
* Renaming or adding fields for downstream systems
* Filtering out unwanted or noisy telemetry
* Combining or deriving attributes for enrichment
## Logs and correlation
You’ll learn OpenTelemetry’s unified logging model and strategies to enrich logs with trace context so logs become actionable within distributed traces. This correlation is critical for root-cause analysis and understanding end-to-end request behavior.
## OpenTelemetry Collector and Kubernetes
The Collector is the central, extensible piece that receives, processes, and exports telemetry. We cover common receivers, processors, connectors, and exporters, along with deployment models in Docker and Kubernetes. You’ll also deploy the OpenTelemetry Kubernetes Operator to enable auto-instrumentation for workloads running on the cluster.
## OpenTelemetry Transformation Language (OTTL)
OTTL provides a powerful, declarative way to filter and transform telemetry inside the Collector pipeline. Typical use cases include:
* Removing or masking sensitive data (PII)
* Renaming or adding fields for downstream systems
* Filtering out unwanted or noisy telemetry
* Combining or deriving attributes for enrichment
 ## Collector operations and debugging
Operational knowledge is essential: monitor Collector health, capture internal telemetry, and scale pipelines for high-volume data. A common debugging technique is enabling zPages in the Collector to expose internal debug endpoints:
```yaml theme={null}
extensions:
zpages:
endpoint: "0.0.0.0:55679"
```
Use zPages to inspect span sampling, batching, and exporter behavior when diagnosing Collector issues.
This course is designed for SREs, DevOps engineers, platform engineers, and developers who want practical OpenTelemetry skills and OTCA exam preparation. Familiarity with distributed systems, HTTP, and Kubernetes will help you get the most from the labs.
## Community and next steps
At KodeKloud, we foster an active learning community where you can ask questions, collaborate, and share solutions. The course includes mock exams modeled on the OTCA to help you assess readiness and focus review on weak areas.
If you're ready to advance your observability expertise, improve reliability engineering practices, and earn the OTCA certification, let’s get started.
## Links and references
* OpenTelemetry project: [https://opentelemetry.io/](https://opentelemetry.io/)
* OTLP (OpenTelemetry Protocol) docs: [https://opentelemetry.io/docs/specs/otel/protocol/](https://opentelemetry.io/docs/specs/otel/protocol/)
* Collector zPages extension: [https://opentelemetry.io/docs/collector/configuration/extensions/zpages/](https://opentelemetry.io/docs/collector/configuration/extensions/zpages/)
* OpenTelemetry Operator for Kubernetes: [https://github.com/open-telemetry/opentelemetry-operator](https://github.com/open-telemetry/opentelemetry-operator)
## Collector operations and debugging
Operational knowledge is essential: monitor Collector health, capture internal telemetry, and scale pipelines for high-volume data. A common debugging technique is enabling zPages in the Collector to expose internal debug endpoints:
```yaml theme={null}
extensions:
zpages:
endpoint: "0.0.0.0:55679"
```
Use zPages to inspect span sampling, batching, and exporter behavior when diagnosing Collector issues.
This course is designed for SREs, DevOps engineers, platform engineers, and developers who want practical OpenTelemetry skills and OTCA exam preparation. Familiarity with distributed systems, HTTP, and Kubernetes will help you get the most from the labs.
## Community and next steps
At KodeKloud, we foster an active learning community where you can ask questions, collaborate, and share solutions. The course includes mock exams modeled on the OTCA to help you assess readiness and focus review on weak areas.
If you're ready to advance your observability expertise, improve reliability engineering practices, and earn the OTCA certification, let’s get started.
## Links and references
* OpenTelemetry project: [https://opentelemetry.io/](https://opentelemetry.io/)
* OTLP (OpenTelemetry Protocol) docs: [https://opentelemetry.io/docs/specs/otel/protocol/](https://opentelemetry.io/docs/specs/otel/protocol/)
* Collector zPages extension: [https://opentelemetry.io/docs/collector/configuration/extensions/zpages/](https://opentelemetry.io/docs/collector/configuration/extensions/zpages/)
* OpenTelemetry Operator for Kubernetes: [https://github.com/open-telemetry/opentelemetry-operator](https://github.com/open-telemetry/opentelemetry-operator)