> ## Documentation Index
> Fetch the complete documentation index at: https://notes.kodekloud.com/llms.txt
> Use this file to discover all available pages before exploring further.
# Code Based Manual Instrumentation and Tracing API Introduction
> Explains manual code instrumentation with the OpenTelemetry Tracing API, how to create and export spans, configure SDKs, and best practices for tracing and context propagation.
In this lesson we dive into code-based (manual) instrumentation to understand how telemetry—traces, spans, metrics, and logs—is produced. Once you grasp manual instrumentation with the OpenTelemetry Tracing API, library-based auto-instrumentation becomes straightforward.
Instrumentation = explicit telemetry calls in application code (via the OpenTelemetry API) so you can control:
* which operations are traced,
* which metadata (attributes/events/exceptions) is captured, and
* which signals are produced and exported.
This lesson uses `ConsoleSpanExporter` so spans are visible on your console for demonstration. In production you would normally use an OTLP exporter (via the Collector) or a vendor-specific exporter.
OpenTelemetry architecture (quick recap)
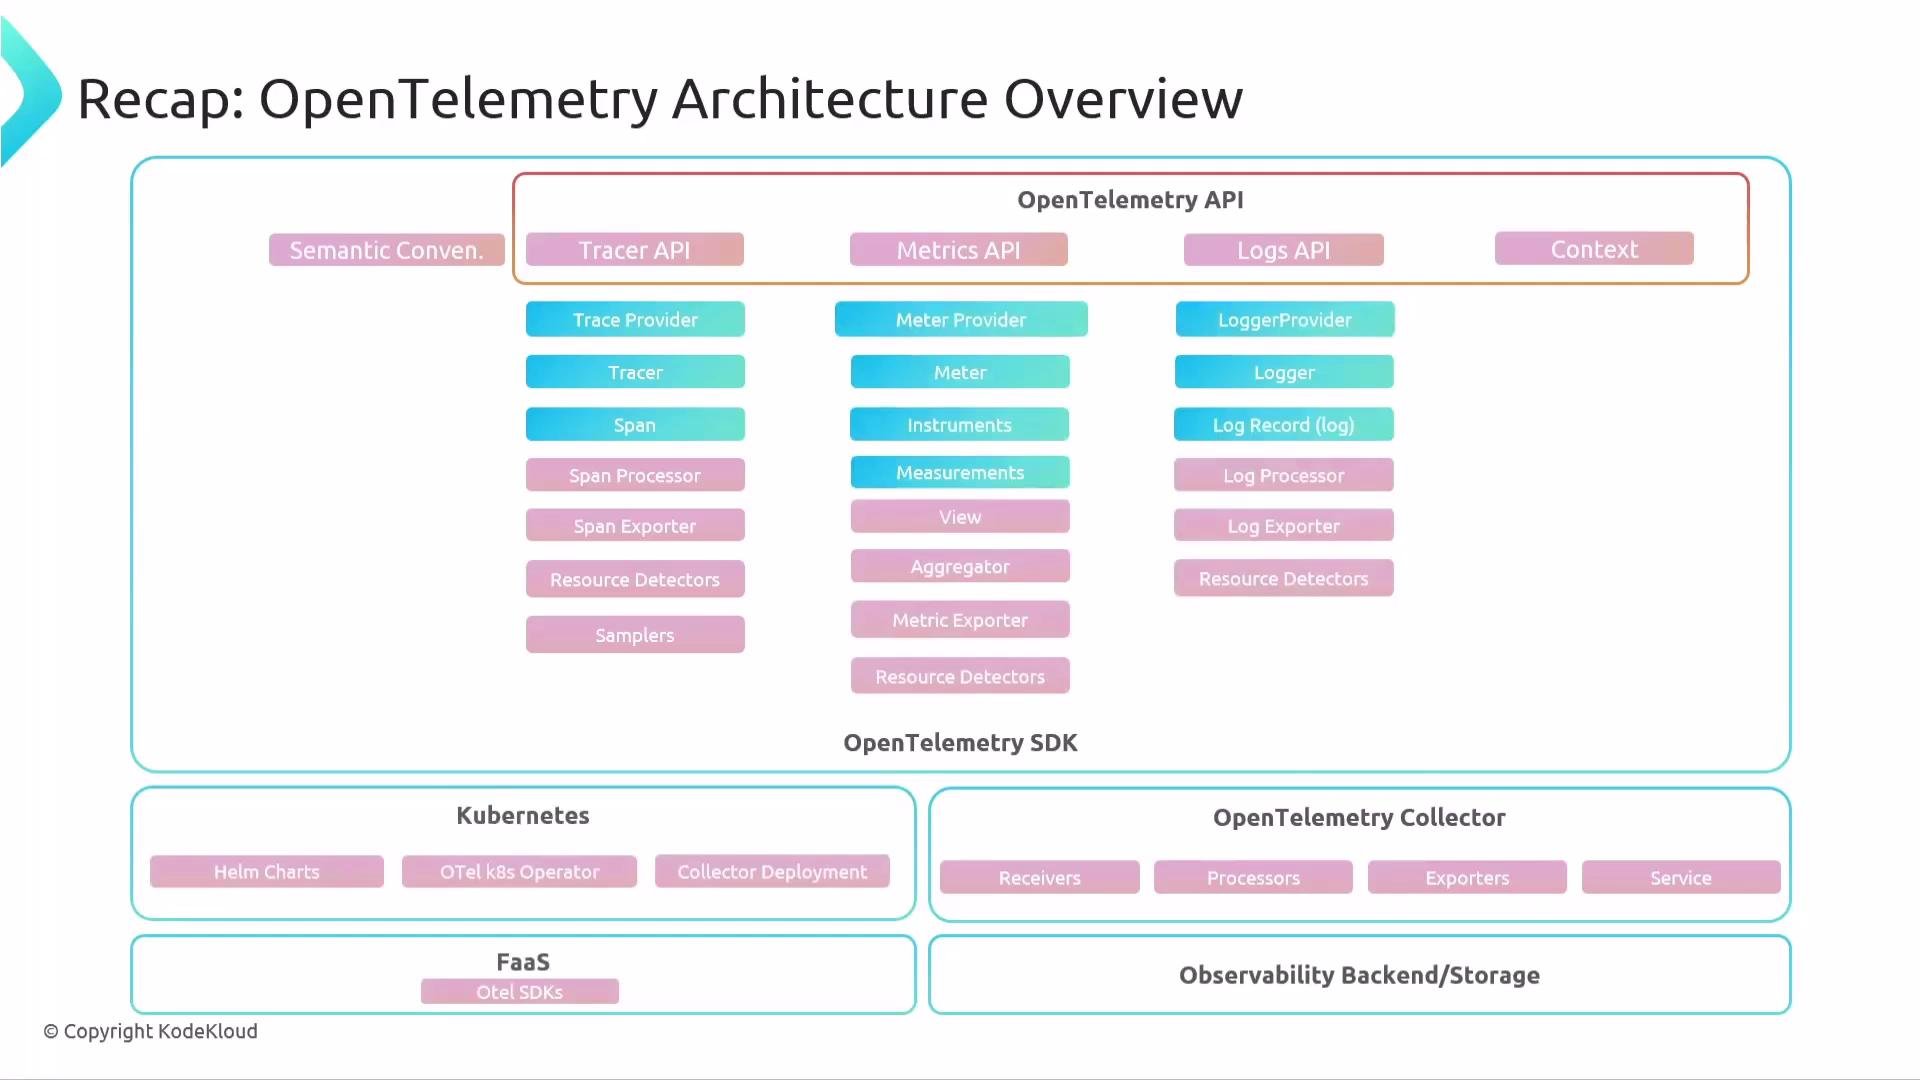 Key components and responsibilities:
| Component | Purpose | Example / Notes |
| -------------------- | ---------------------------------------------------------------------------- | ------------------------------------------- |
| OpenTelemetry API | Language-neutral contract you code against (tracing, metrics, logs, context) | `trace.get_tracer(...)`, `start_span` |
| SDK | Language-specific implementation that records, samples, batches | `TracerProvider`, `SpanProcessor` |
| Span export pipeline | Buffers/batches spans and passes to exporters | `SimpleSpanProcessor`, `BatchSpanProcessor` |
| Exporter | Sends spans to backends (Console, OTLP, vendor) | `ConsoleSpanExporter`, `OTLPSpanExporter` |
| Collector / Backend | Receives, stores, and visualizes telemetry | Jaeger, Tempo, commercial APMs |
What is manual (code-based) instrumentation?
Key components and responsibilities:
| Component | Purpose | Example / Notes |
| -------------------- | ---------------------------------------------------------------------------- | ------------------------------------------- |
| OpenTelemetry API | Language-neutral contract you code against (tracing, metrics, logs, context) | `trace.get_tracer(...)`, `start_span` |
| SDK | Language-specific implementation that records, samples, batches | `TracerProvider`, `SpanProcessor` |
| Span export pipeline | Buffers/batches spans and passes to exporters | `SimpleSpanProcessor`, `BatchSpanProcessor` |
| Exporter | Sends spans to backends (Console, OTLP, vendor) | `ConsoleSpanExporter`, `OTLPSpanExporter` |
| Collector / Backend | Receives, stores, and visualizes telemetry | Jaeger, Tempo, commercial APMs |
What is manual (code-based) instrumentation?
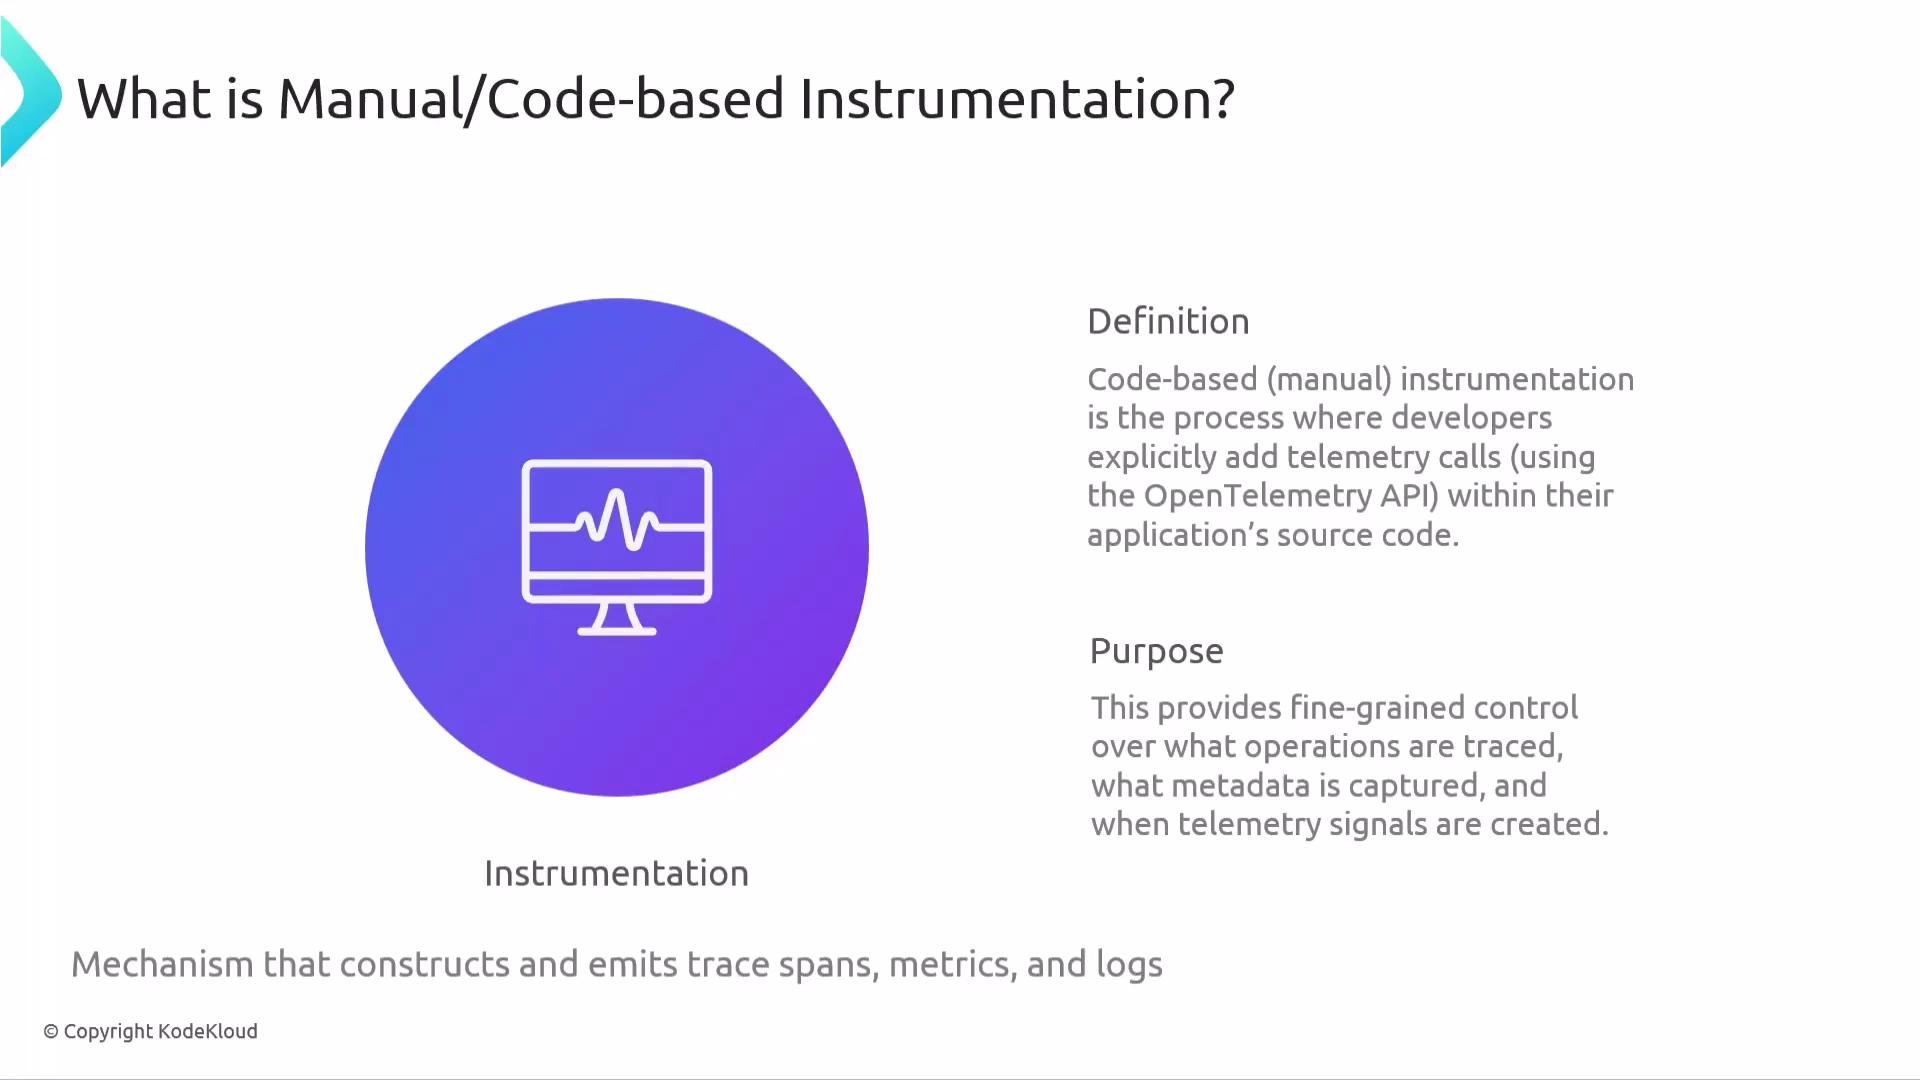 Manual instrumentation means you explicitly call the OpenTelemetry API in your source:
* create tracers,
* start and end spans,
* set attributes,
* add events or record exceptions,
* and handle context propagation.
This approach gives the most control and the most accurate representation of application behavior.
Tracing API workflow
Manual instrumentation means you explicitly call the OpenTelemetry API in your source:
* create tracers,
* start and end spans,
* set attributes,
* add events or record exceptions,
* and handle context propagation.
This approach gives the most control and the most accurate representation of application behavior.
Tracing API workflow
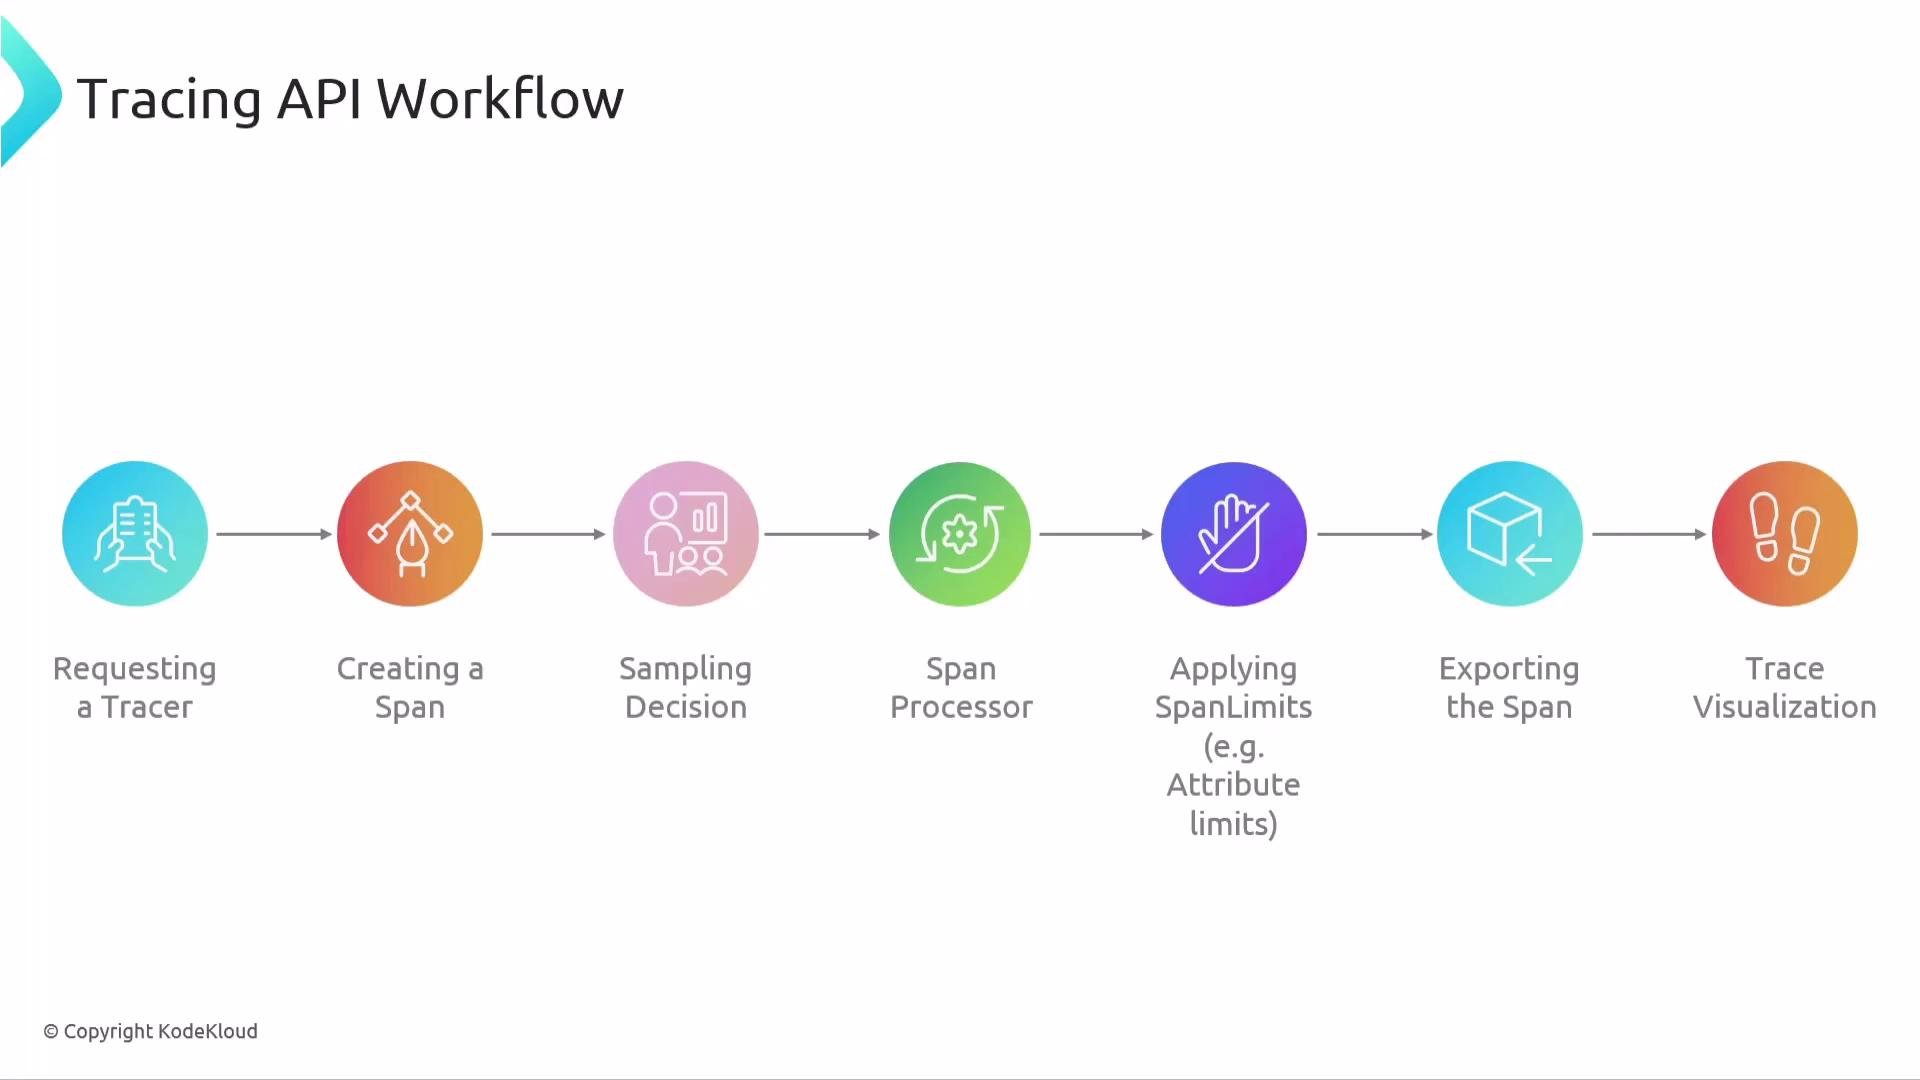 High-level flow:
1. Configure a TracerProvider (SDK wiring).
2. Request a `Tracer`.
3. Create spans (`start_span` / `start_as_current_span`).
4. Sampling decision — spans are recorded or dropped.
5. `SpanProcessor` receives spans and enforces `SpanLimits`, batching/retrying as needed.
6. `Exporter` sends spans to the configured backend (OTLP, Console, vendor exporter).
7. Backend visualizes traces.
TracerProvider is the factory and central access point for tracers. The Context API binds spans into traces and supports propagation across process/network boundaries.
Core Tracing API components and definitions
* TracerProvider: provides `Tracer` instances (SDK-managed).
* Tracer: used to start spans.
* Span: represents a single timed operation.
* SpanProcessor: processes spans (batching, exporting).
* SpanExporter: converts and sends span data to backends.
Examples
Basic application (no OpenTelemetry calls yet)
```python theme={null}
# 00_basic_app.py
def do_work():
print("doing some work...")
def main():
print("Calling the do_work function")
do_work()
print("End: Back from the main function")
if __name__ == "__main__":
main()
```
Instrumenting with the OpenTelemetry API only (no SDK configured)
* Calling `trace.get_tracer(...)` without setting a TracerProvider results in a no-op (non-recording) provider. Calls are safe, maintain context, and do not raise errors, but spans are non-recording and will not be exported.
Example (API-only; default no-op provider):
```python theme={null}
# 01_api_only_noop.py
from opentelemetry import trace
# Using the default no-op tracer provider (no SDK configured)
tracer = trace.get_tracer("my.tracer.name")
def do_work():
with tracer.start_as_current_span("parent"):
print("doing some work...")
with tracer.start_as_current_span("child"):
print("doing some nested work...")
def main():
with tracer.start_as_current_span("main_function_span"):
print("Calling the do_work function")
do_work()
print("End: Back from the main function")
if __name__ == "__main__":
main()
```
Run (no span output because no SDK exporter is configured):
```bash theme={null}
> python 01_api_only_noop.py
Calling the do_work function
doing some work...
doing some nested work...
End: Back from the main function
```
This is the no-op (non-recording) behavior: the API calls work and maintain context, but attributes, events, and spans are not recorded or exported until an SDK is configured.
No-op benefits
High-level flow:
1. Configure a TracerProvider (SDK wiring).
2. Request a `Tracer`.
3. Create spans (`start_span` / `start_as_current_span`).
4. Sampling decision — spans are recorded or dropped.
5. `SpanProcessor` receives spans and enforces `SpanLimits`, batching/retrying as needed.
6. `Exporter` sends spans to the configured backend (OTLP, Console, vendor exporter).
7. Backend visualizes traces.
TracerProvider is the factory and central access point for tracers. The Context API binds spans into traces and supports propagation across process/network boundaries.
Core Tracing API components and definitions
* TracerProvider: provides `Tracer` instances (SDK-managed).
* Tracer: used to start spans.
* Span: represents a single timed operation.
* SpanProcessor: processes spans (batching, exporting).
* SpanExporter: converts and sends span data to backends.
Examples
Basic application (no OpenTelemetry calls yet)
```python theme={null}
# 00_basic_app.py
def do_work():
print("doing some work...")
def main():
print("Calling the do_work function")
do_work()
print("End: Back from the main function")
if __name__ == "__main__":
main()
```
Instrumenting with the OpenTelemetry API only (no SDK configured)
* Calling `trace.get_tracer(...)` without setting a TracerProvider results in a no-op (non-recording) provider. Calls are safe, maintain context, and do not raise errors, but spans are non-recording and will not be exported.
Example (API-only; default no-op provider):
```python theme={null}
# 01_api_only_noop.py
from opentelemetry import trace
# Using the default no-op tracer provider (no SDK configured)
tracer = trace.get_tracer("my.tracer.name")
def do_work():
with tracer.start_as_current_span("parent"):
print("doing some work...")
with tracer.start_as_current_span("child"):
print("doing some nested work...")
def main():
with tracer.start_as_current_span("main_function_span"):
print("Calling the do_work function")
do_work()
print("End: Back from the main function")
if __name__ == "__main__":
main()
```
Run (no span output because no SDK exporter is configured):
```bash theme={null}
> python 01_api_only_noop.py
Calling the do_work function
doing some work...
doing some nested work...
End: Back from the main function
```
This is the no-op (non-recording) behavior: the API calls work and maintain context, but attributes, events, and spans are not recorded or exported until an SDK is configured.
No-op benefits
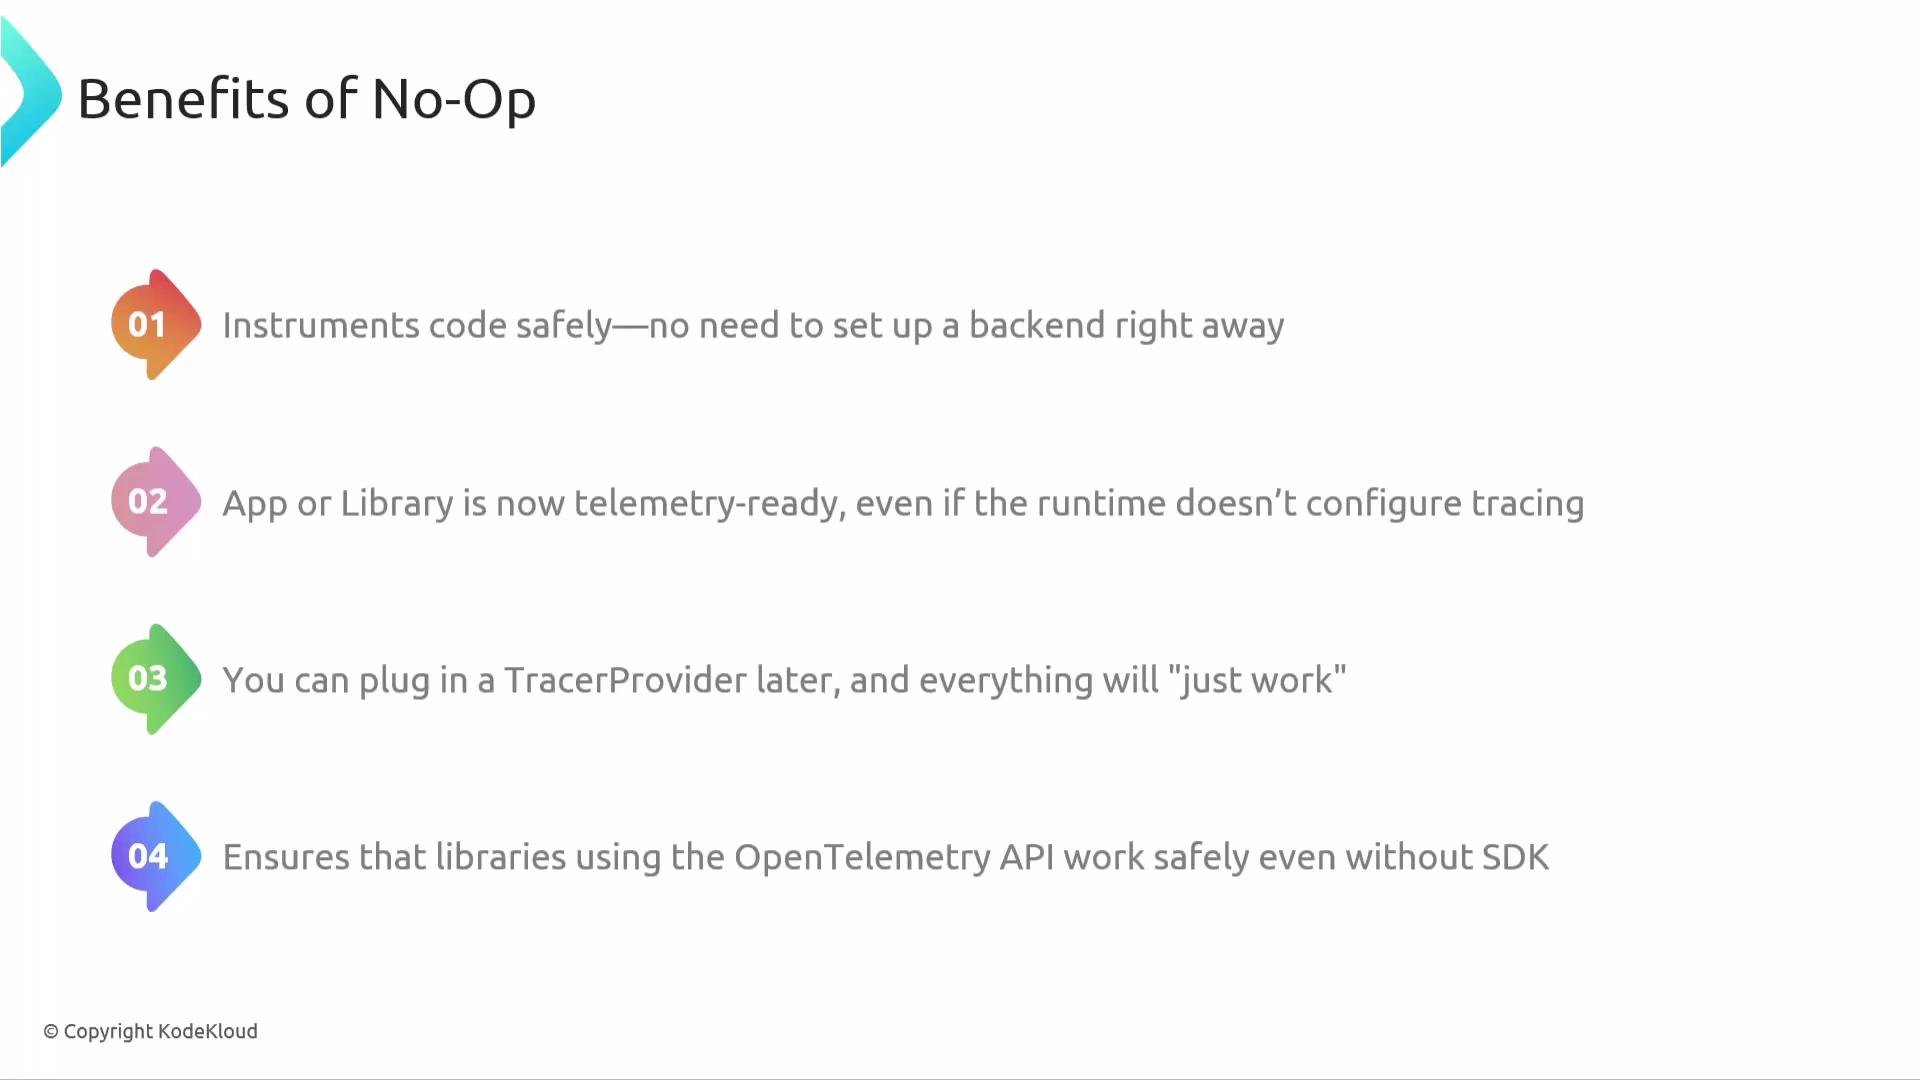 Why this design?
* Safe: instrumentation calls won't break an application if telemetry isn't configured.
* Telemetry-ready: libraries and apps can include instrumentation before choosing a backend.
* Swappable: plug a real SDK and exporter later without changing instrumentation code.
Wiring an SDK to produce recording spans
To record and export spans you must configure an SDK `TracerProvider` and add a `SpanProcessor` + `Exporter`. The demo below uses `SimpleSpanProcessor` with `ConsoleSpanExporter`.
```python theme={null}
# 02_with_sdk_console_exporter.py
from opentelemetry import trace
from opentelemetry.sdk.trace import TracerProvider
from opentelemetry.sdk.trace.export import SimpleSpanProcessor, ConsoleSpanExporter
# 1. Set up the tracer provider (enable SDK recording)
trace.set_tracer_provider(TracerProvider())
# 2. Configure a processor with a ConsoleSpanExporter
span_processor = SimpleSpanProcessor(ConsoleSpanExporter())
trace.get_tracer_provider().add_span_processor(span_processor)
# 3. Create a tracer (from the now-configured provider)
tracer = trace.get_tracer("my.tracer.name")
def do_work():
with tracer.start_as_current_span("parent"):
print("doing some work...")
with tracer.start_as_current_span("child"):
print("doing some nested work...")
def main():
with tracer.start_as_current_span("main_function_span"):
print("Calling the do_work function")
do_work()
print("End: Back from the main function")
if __name__ == "__main__":
main()
```
Run the instrumented application (Console exporter prints spans in a JSON-like format):
```bash theme={null}
> python 02_with_sdk_console_exporter.py
Calling the do_work function
doing some work...
doing some nested work...
{
"name": "child",
"context": {
"trace_id": "0x86637c13bf2e369e70c7962c33a3fd8d",
"span_id": "0x534e8bbda33f2f4d",
"trace_state": "[]"
},
"kind": "SpanKind.INTERNAL",
"parent_id": "0xd0070b7c88e250ff",
"start_time": "2025-10-21T10:25:30.348403Z",
"end_time": "2025-10-21T10:25:30.348508Z",
"status": {
"status_code": "UNSET"
},
"attributes": {},
"events": [],
"links": [],
"resource": {
"attributes": {
"telemetry.sdk.language": "python",
"telemetry.sdk.name": "opentelemetry",
"telemetry.sdk.version": "1.37.0",
"service.name": "unknown_service"
}
},
"schema_url": ""
}
```
Notes:
* The root span (`main_function_span`) will have `parent_id: null` indicating it is the root of the trace.
* Resource attributes default to `service.name: "unknown_service"` unless you explicitly configure the `Resource` when creating the `TracerProvider`.
* To send spans to a backend, swap `ConsoleSpanExporter` for an OTLP exporter (or another vendor exporter) and configure its endpoint (e.g., point it at your Collector).
Why the SDK is required
* The API defines the contract (`get_tracer`, `start_span`, `set_attribute`, `add_event`, etc.).
* The SDK defines how spans are recorded, sampled, batched, and exported.
* Without the SDK, your instrumentation code is a safe no-op.
Language idioms
* Python: `tracer.start_as_current_span(...)`
* Java: `tracer.spanBuilder(...).startSpan()`
* JavaScript: `tracer.startSpan(...)`
* .NET: Activity-based starts
Core Tracing API functions and features
Why this design?
* Safe: instrumentation calls won't break an application if telemetry isn't configured.
* Telemetry-ready: libraries and apps can include instrumentation before choosing a backend.
* Swappable: plug a real SDK and exporter later without changing instrumentation code.
Wiring an SDK to produce recording spans
To record and export spans you must configure an SDK `TracerProvider` and add a `SpanProcessor` + `Exporter`. The demo below uses `SimpleSpanProcessor` with `ConsoleSpanExporter`.
```python theme={null}
# 02_with_sdk_console_exporter.py
from opentelemetry import trace
from opentelemetry.sdk.trace import TracerProvider
from opentelemetry.sdk.trace.export import SimpleSpanProcessor, ConsoleSpanExporter
# 1. Set up the tracer provider (enable SDK recording)
trace.set_tracer_provider(TracerProvider())
# 2. Configure a processor with a ConsoleSpanExporter
span_processor = SimpleSpanProcessor(ConsoleSpanExporter())
trace.get_tracer_provider().add_span_processor(span_processor)
# 3. Create a tracer (from the now-configured provider)
tracer = trace.get_tracer("my.tracer.name")
def do_work():
with tracer.start_as_current_span("parent"):
print("doing some work...")
with tracer.start_as_current_span("child"):
print("doing some nested work...")
def main():
with tracer.start_as_current_span("main_function_span"):
print("Calling the do_work function")
do_work()
print("End: Back from the main function")
if __name__ == "__main__":
main()
```
Run the instrumented application (Console exporter prints spans in a JSON-like format):
```bash theme={null}
> python 02_with_sdk_console_exporter.py
Calling the do_work function
doing some work...
doing some nested work...
{
"name": "child",
"context": {
"trace_id": "0x86637c13bf2e369e70c7962c33a3fd8d",
"span_id": "0x534e8bbda33f2f4d",
"trace_state": "[]"
},
"kind": "SpanKind.INTERNAL",
"parent_id": "0xd0070b7c88e250ff",
"start_time": "2025-10-21T10:25:30.348403Z",
"end_time": "2025-10-21T10:25:30.348508Z",
"status": {
"status_code": "UNSET"
},
"attributes": {},
"events": [],
"links": [],
"resource": {
"attributes": {
"telemetry.sdk.language": "python",
"telemetry.sdk.name": "opentelemetry",
"telemetry.sdk.version": "1.37.0",
"service.name": "unknown_service"
}
},
"schema_url": ""
}
```
Notes:
* The root span (`main_function_span`) will have `parent_id: null` indicating it is the root of the trace.
* Resource attributes default to `service.name: "unknown_service"` unless you explicitly configure the `Resource` when creating the `TracerProvider`.
* To send spans to a backend, swap `ConsoleSpanExporter` for an OTLP exporter (or another vendor exporter) and configure its endpoint (e.g., point it at your Collector).
Why the SDK is required
* The API defines the contract (`get_tracer`, `start_span`, `set_attribute`, `add_event`, etc.).
* The SDK defines how spans are recorded, sampled, batched, and exported.
* Without the SDK, your instrumentation code is a safe no-op.
Language idioms
* Python: `tracer.start_as_current_span(...)`
* Java: `tracer.spanBuilder(...).startSpan()`
* JavaScript: `tracer.startSpan(...)`
* .NET: Activity-based starts
Core Tracing API functions and features
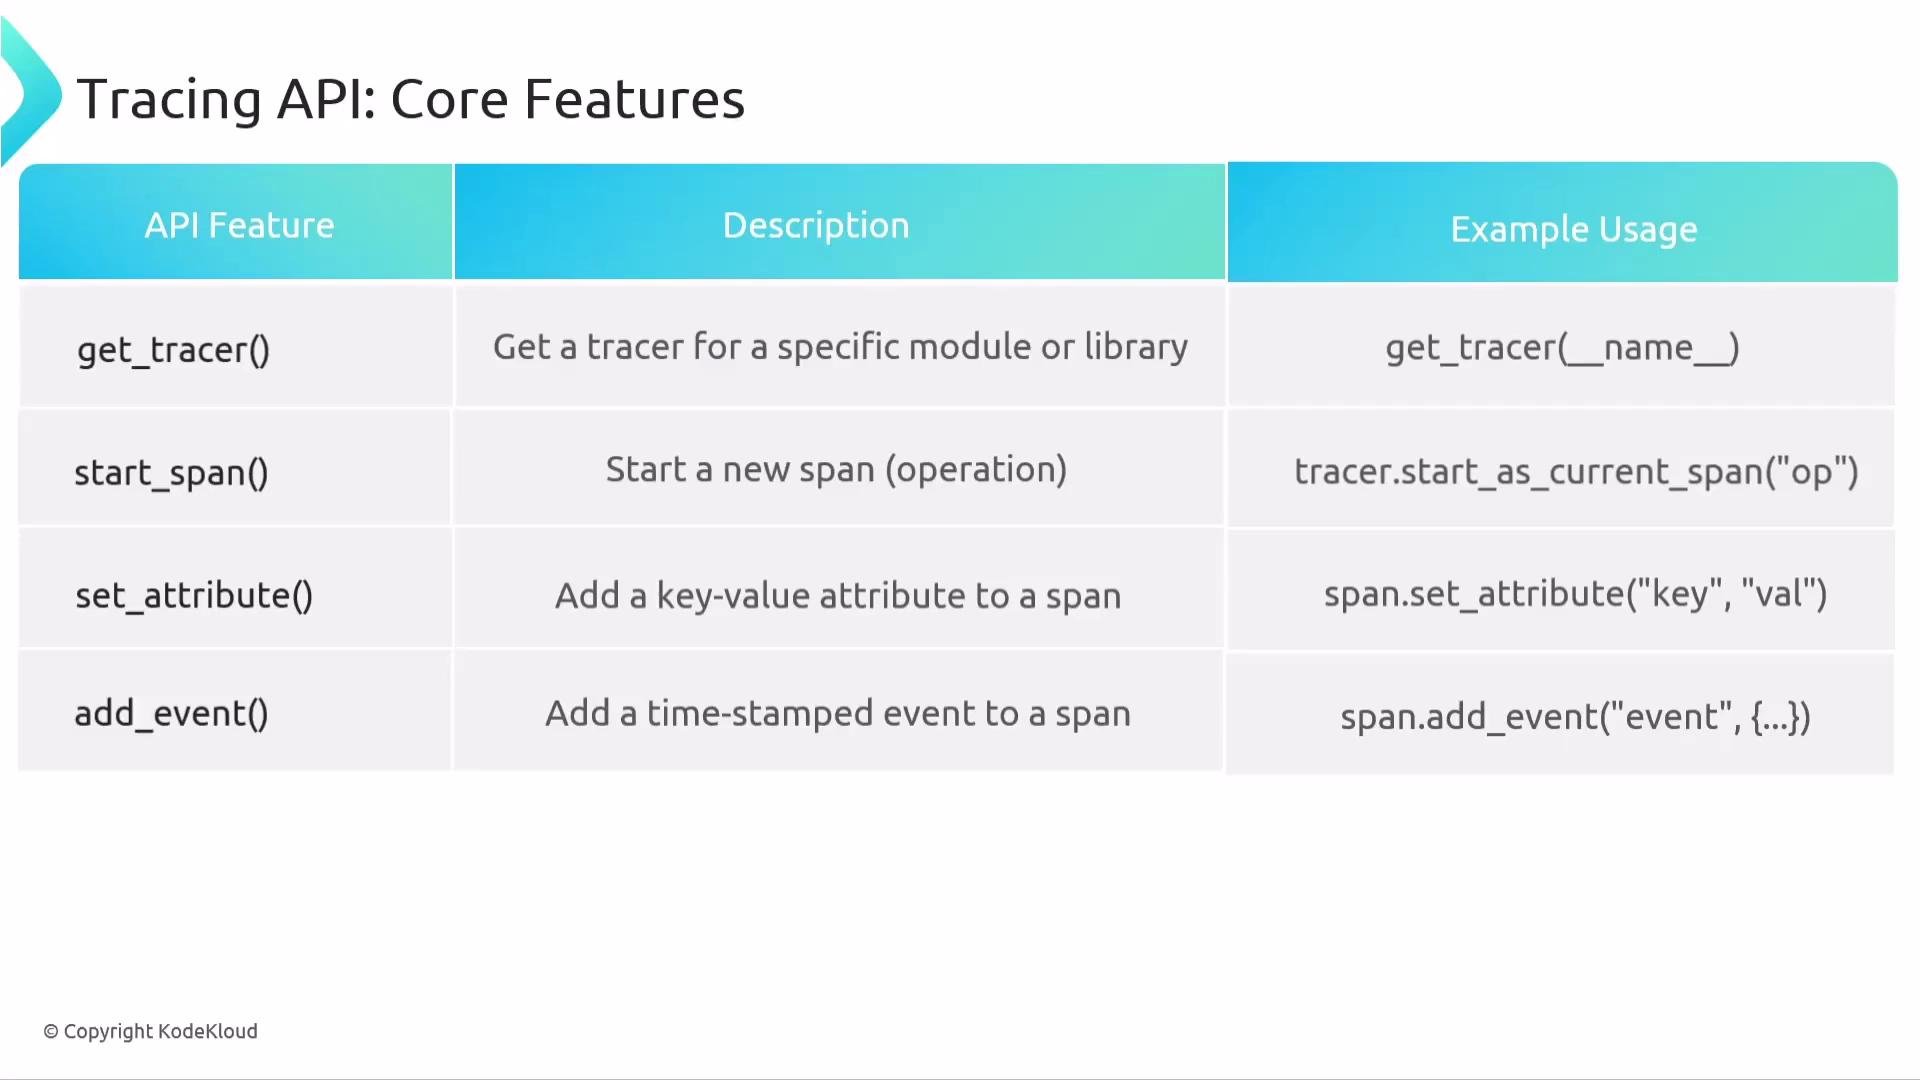 Common operations (Python examples):
```python theme={null}
from opentelemetry import trace
from opentelemetry.trace import StatusCode
tracer = trace.get_tracer(__name__)
with tracer.start_as_current_span("operation") as span:
span.set_attribute("http.method", "GET")
span.add_event("authorization_received", {"user": "alice"})
try:
# perform operation
pass
except Exception as exc:
span.record_exception(exc)
span.set_status(StatusCode.ERROR)
```
Key API operations:
* `get_tracer(module_name)`: organize telemetry per module.
* `start_span` / `start_as_current_span`: create spans and manage lifecycle.
* `set_attribute`: attach key-value metadata to spans.
* `add_event`: record transient events (e.g., `"request_received"`).
* `record_exception`: attach exception details to a span.
* `set_status`: mark span success/failure.
* End spans properly (use context managers / `with` blocks) to correctly measure duration.
* Context API & Propagators: preserve and propagate trace context across threads/processes and network boundaries.
* Baggage: small key-value pairs propagated across services.
No-op, safe defaults, and concurrency
Common operations (Python examples):
```python theme={null}
from opentelemetry import trace
from opentelemetry.trace import StatusCode
tracer = trace.get_tracer(__name__)
with tracer.start_as_current_span("operation") as span:
span.set_attribute("http.method", "GET")
span.add_event("authorization_received", {"user": "alice"})
try:
# perform operation
pass
except Exception as exc:
span.record_exception(exc)
span.set_status(StatusCode.ERROR)
```
Key API operations:
* `get_tracer(module_name)`: organize telemetry per module.
* `start_span` / `start_as_current_span`: create spans and manage lifecycle.
* `set_attribute`: attach key-value metadata to spans.
* `add_event`: record transient events (e.g., `"request_received"`).
* `record_exception`: attach exception details to a span.
* `set_status`: mark span success/failure.
* End spans properly (use context managers / `with` blocks) to correctly measure duration.
* Context API & Propagators: preserve and propagate trace context across threads/processes and network boundaries.
* Baggage: small key-value pairs propagated across services.
No-op, safe defaults, and concurrency
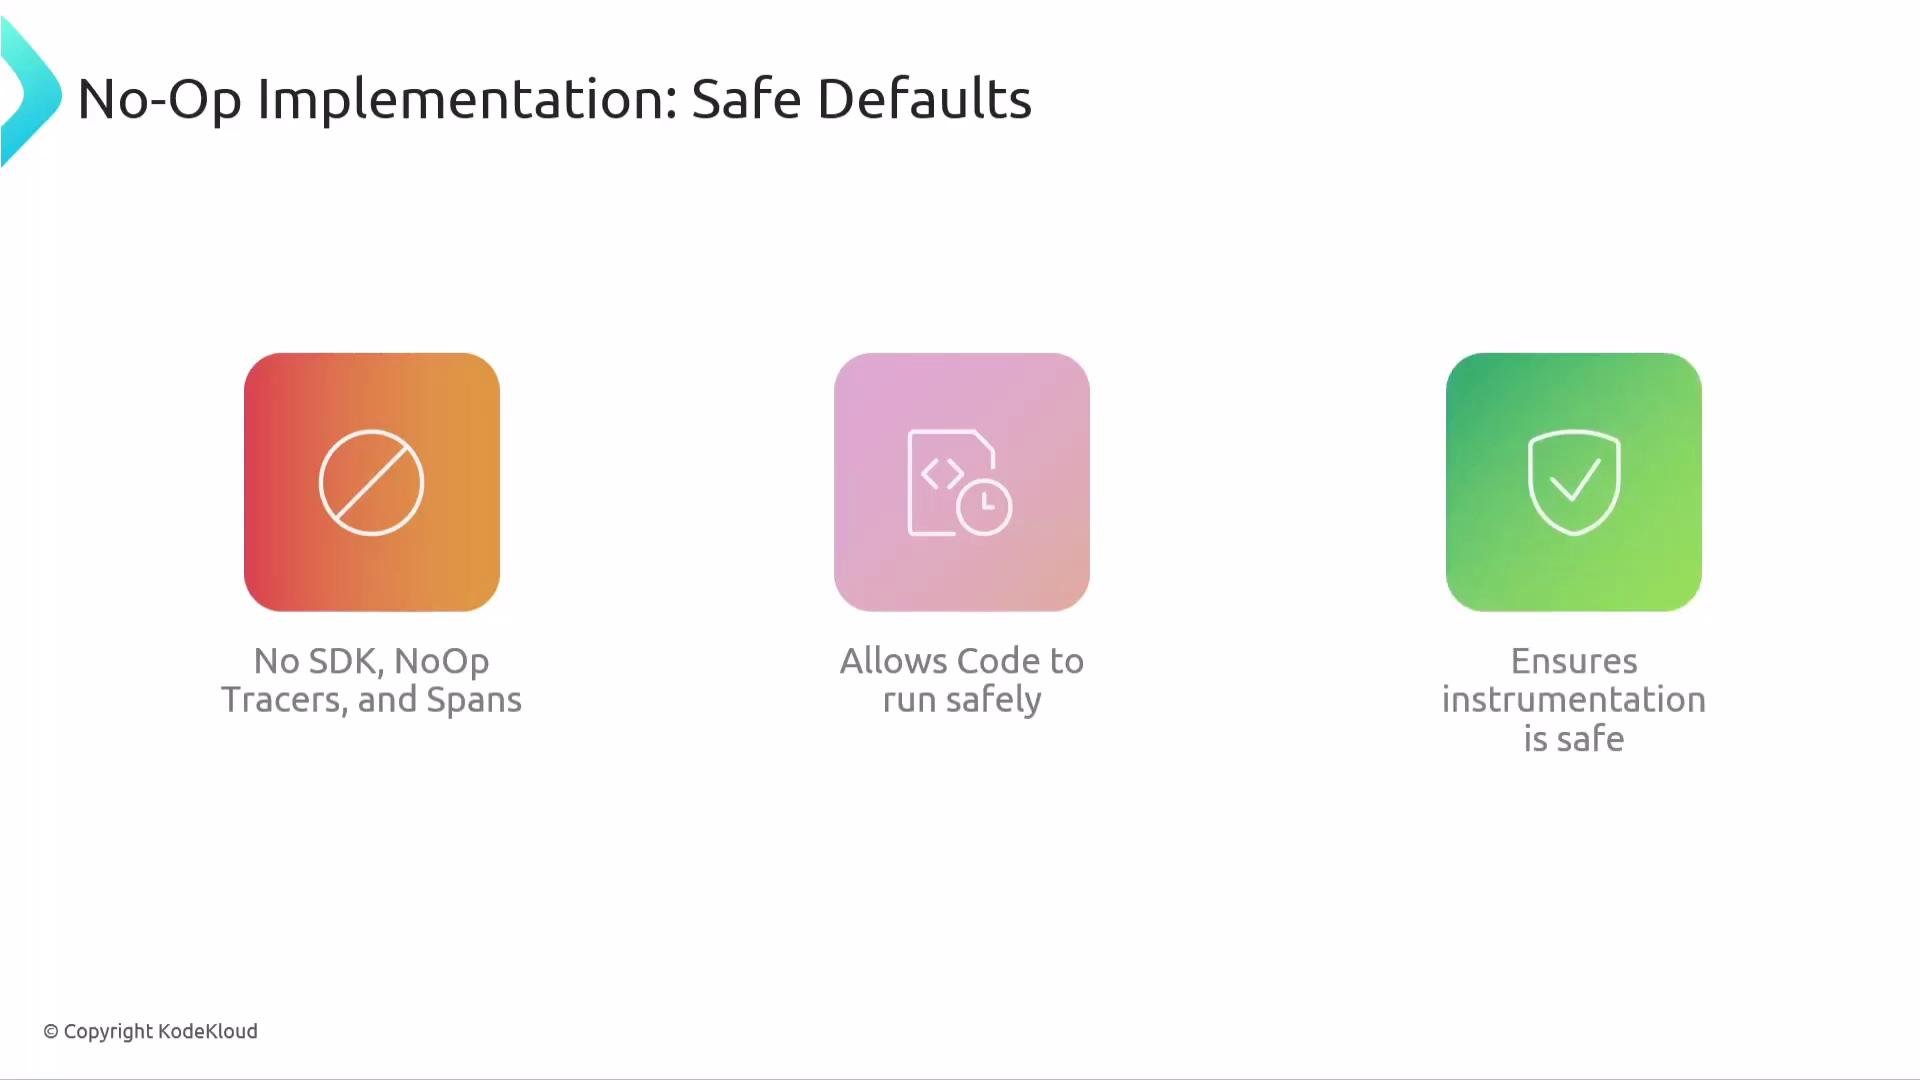 OpenTelemetry falls back to no-op providers if no SDK is installed. This guarantees:
* Instrumentation does not break applications.
* Libraries may safely include instrumentation.
* The same instrumentation starts producing telemetry when an SDK is wired.
All OpenTelemetry tracing components are safe for concurrent use.
OpenTelemetry falls back to no-op providers if no SDK is installed. This guarantees:
* Instrumentation does not break applications.
* Libraries may safely include instrumentation.
* The same instrumentation starts producing telemetry when an SDK is wired.
All OpenTelemetry tracing components are safe for concurrent use.
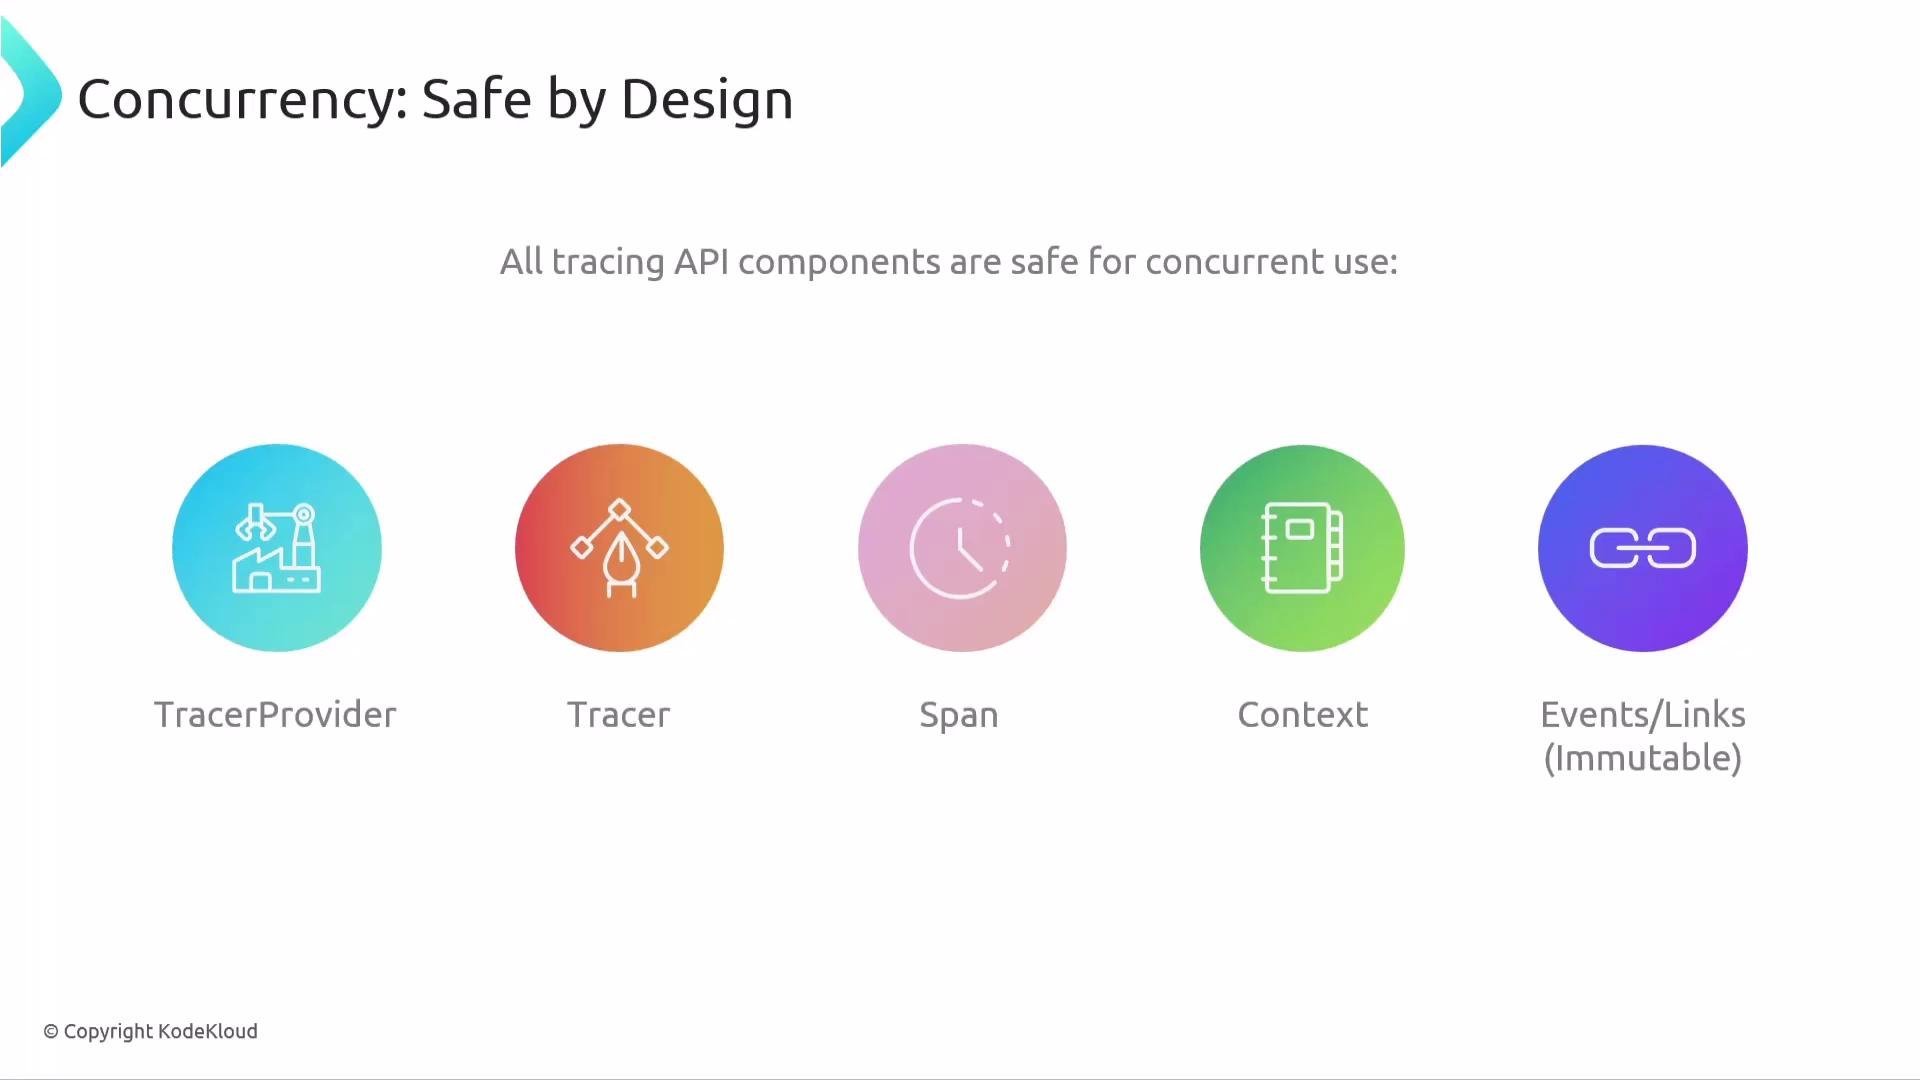 Example: a web server handling thousands of concurrent requests can use a single tracer instance; each request receives its own span context without manual locking.
Best practices
Example: a web server handling thousands of concurrent requests can use a single tracer instance; each request receives its own span context without manual locking.
Best practices
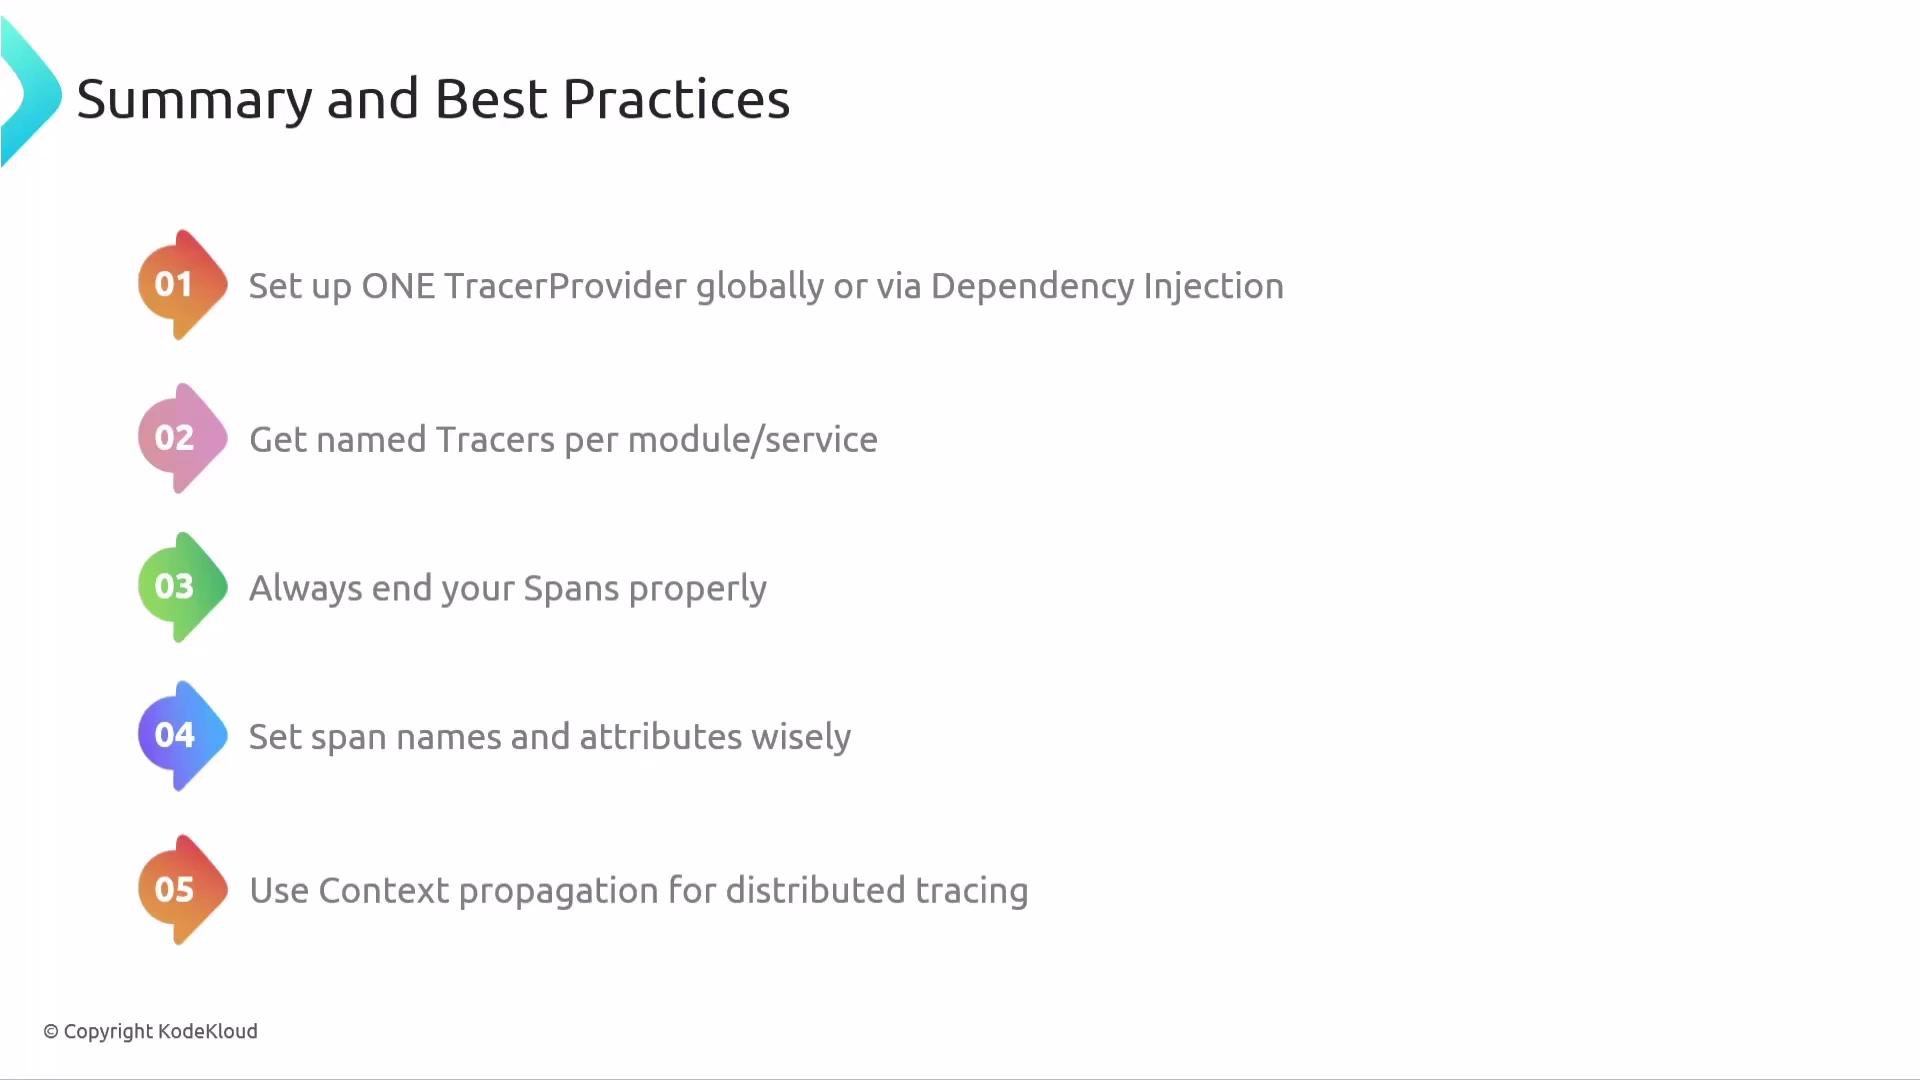 * Configure one `TracerProvider` per application (global or injected).
* Use `get_tracer(__name__)` or a per-module name to identify span origins.
* End spans properly (prefer context managers / `with`).
* Name spans after the operation type (e.g., `FetchUser`, `DatabaseQuery`) — avoid embedding identifiers (`FetchUser:alice`).
* Add attributes and follow semantic conventions whenever possible.
* Use context propagation (Propagators) for distributed tracing across services.
* Prefer configuring sampling and exporters outside application code so backends can be changed without modifying instrumentation.
That concludes this lesson on code-based (manual) instrumentation and the OpenTelemetry Tracing API.
Links and references
* OpenTelemetry Documentation: [https://opentelemetry.io/docs/](https://opentelemetry.io/docs/)
* Tracing specification: [https://opentelemetry.io/docs/specs/otel/trace/](https://opentelemetry.io/docs/specs/otel/trace/)
* OTLP Protocol: [https://github.com/open-telemetry/opentelemetry-proto](https://github.com/open-telemetry/opentelemetry-proto)
* Collector: [https://opentelemetry.io/docs/collector/intro/](https://opentelemetry.io/docs/collector/intro/)
* Configure one `TracerProvider` per application (global or injected).
* Use `get_tracer(__name__)` or a per-module name to identify span origins.
* End spans properly (prefer context managers / `with`).
* Name spans after the operation type (e.g., `FetchUser`, `DatabaseQuery`) — avoid embedding identifiers (`FetchUser:alice`).
* Add attributes and follow semantic conventions whenever possible.
* Use context propagation (Propagators) for distributed tracing across services.
* Prefer configuring sampling and exporters outside application code so backends can be changed without modifying instrumentation.
That concludes this lesson on code-based (manual) instrumentation and the OpenTelemetry Tracing API.
Links and references
* OpenTelemetry Documentation: [https://opentelemetry.io/docs/](https://opentelemetry.io/docs/)
* Tracing specification: [https://opentelemetry.io/docs/specs/otel/trace/](https://opentelemetry.io/docs/specs/otel/trace/)
* OTLP Protocol: [https://github.com/open-telemetry/opentelemetry-proto](https://github.com/open-telemetry/opentelemetry-proto)
* Collector: [https://opentelemetry.io/docs/collector/intro/](https://opentelemetry.io/docs/collector/intro/)