> ## Documentation Index
> Fetch the complete documentation index at: https://notes.kodekloud.com/llms.txt
> Use this file to discover all available pages before exploring further.
# Demo Connecting Two Services
> Guide to instrumenting two services with OpenTelemetry to propagate trace context across HTTP calls so client and server spans form a single correlated distributed trace
This guide shows how to connect two services so that an outgoing HTTP call from the Payment service to the Charge service is represented as a single correlated distributed trace. The objective: when the payment service executes its `charge_bank` step, it should call the charge service (`/charge`) and produce spans that are correlated across both services so a tracing backend like [Jaeger](https://www.jaegertracing.io/) can display one end-to-end trace.
What you'll learn
* How to configure a tracer provider for each service.
* How to instrument a Flask-based charge service (server).
* How to instrument the payment service (client) and inject trace context into HTTP headers.
* How to create client-side spans for outgoing requests.
* How to debug cases where two separate traces appear instead of a single correlated trace.
Quick overview
* Both services must establish a tracer provider (resource attributes: `service.name`, `service.version`) and a span processor + exporter.
* For local debugging use `ConsoleSpanExporter`; for production collection use the OTLP exporter to a collector or backend.
* Propagate context with `opentelemetry.propagate.inject` on the client and extract it on the server (or rely on automatic instrumentation).
Configure tracing (shared pattern)
Each service reuses a common tracer configuration module. This ensures consistent resource attributes and exporter configuration across services.
tracing\_config.py
```python theme={null}
# tracing_config.py
from opentelemetry import trace
from opentelemetry.sdk.trace import TracerProvider
from opentelemetry.sdk.trace.export import (
ConsoleSpanExporter,
BatchSpanProcessor,
)
from opentelemetry.exporter.otlp.proto.http.trace_exporter import OTLPSpanExporter
from opentelemetry.sdk.resources import Resource
def configure_tracer(service_name: str, service_version: str = "0.1.0", use_otlp: bool = True):
# Choose exporter: ConsoleSpanExporter for local debugging, OTLPSpanExporter for collectors
if use_otlp:
# Example collector endpoint - update to match your collector/backend
exporter = OTLPSpanExporter(endpoint="http://localhost:4318/v1/traces")
else:
exporter = ConsoleSpanExporter()
span_processor = BatchSpanProcessor(exporter)
resource = Resource.create({
"service.name": service_name,
"service.version": service_version,
})
provider = TracerProvider(resource=resource)
provider.add_span_processor(span_processor)
# Make this provider the global default
trace.set_tracer_provider(provider)
# Return a tracer for this module/service
return trace.get_tracer(service_name)
```
Charge service (Flask)
The charge service exposes a `/charge` endpoint and creates a server span that represents handling the incoming HTTP request. The server needs to receive the propagated trace context (via headers) and continue the same trace.
charge\_service.py
```python theme={null}
# charge_service.py
from flask import Flask, request
from opentelemetry import trace
from tracing_config import configure_tracer
app = Flask(__name__)
# Configure tracer for the charge service and get a tracer instance
tracer = configure_tracer(service_name="charge-service", service_version="0.5.0", use_otlp=True)
@tracer.start_as_current_span("Charge Account", kind=trace.SpanKind.SERVER)
def charge():
span = trace.get_current_span()
span.set_attributes({
"HTTP_METHOD": request.method,
"CLIENT_IP": request.remote_addr,
"HTTP_PATH": request.path
})
return "Charging user's bank account"
# Bind the Flask route to the function above
app.add_url_rule("/charge", endpoint="charge", view_func=charge, methods=["GET"])
if __name__ == "__main__":
app.run(debug=True, port=5000)
```
Call site (Payment service — client)
The payment service validates the payment details and then calls the charge service. For the outgoing HTTP call, create a CLIENT span, attach useful attributes, and inject the current trace context into the HTTP headers with `opentelemetry.propagate.inject`. The remote service will extract the context to continue the same trace.
payment\_service.py
```python theme={null}
# payment_service.py
import requests
from tracing_config import configure_tracer
from opentelemetry import trace, propagate
# Configure tracer and get a tracer for the payment service
tracer = configure_tracer(service_name="payment-service", service_version="0.2.0", use_otlp=True)
def validate_card():
print("validating card")
def charge_bank():
print("charging bank")
# Create a CLIENT span for the outgoing HTTP request
with tracer.start_as_current_span("Request to Charge API", kind=trace.SpanKind.CLIENT) as span:
url = "http://127.0.0.1:5000/charge"
# Add useful attributes to the client span
span.set_attributes({
"HTTP_METHOD": "GET",
"HTTP_URL": url
})
# Inject the current trace context into the headers so the charge service can continue the same trace
headers = {}
propagate.inject(headers)
# Perform the HTTP request with the injected headers
resp = requests.get(url, headers=headers)
# Record response information on the span
span.set_attribute("HTTP_STATUS_CODE", resp.status_code)
# Optionally capture limited body information if appropriate (avoid sensitive data)
# span.set_attribute("HTTP_RESPONSE_BODY", resp.text[:200])
def process_payment():
print("processing payment")
validate_card()
charge_bank()
if __name__ == "__main__":
# Create a top-level span representing the payment workflow
with tracer.start_as_current_span("Payment Service"):
process_payment()
```
Why context propagation matters
If you run both services but do not inject the trace context into the outgoing HTTP request, the charge service will start a new trace (different trace ID). That results in two separate traces in Jaeger rather than one correlated trace spanning both services.
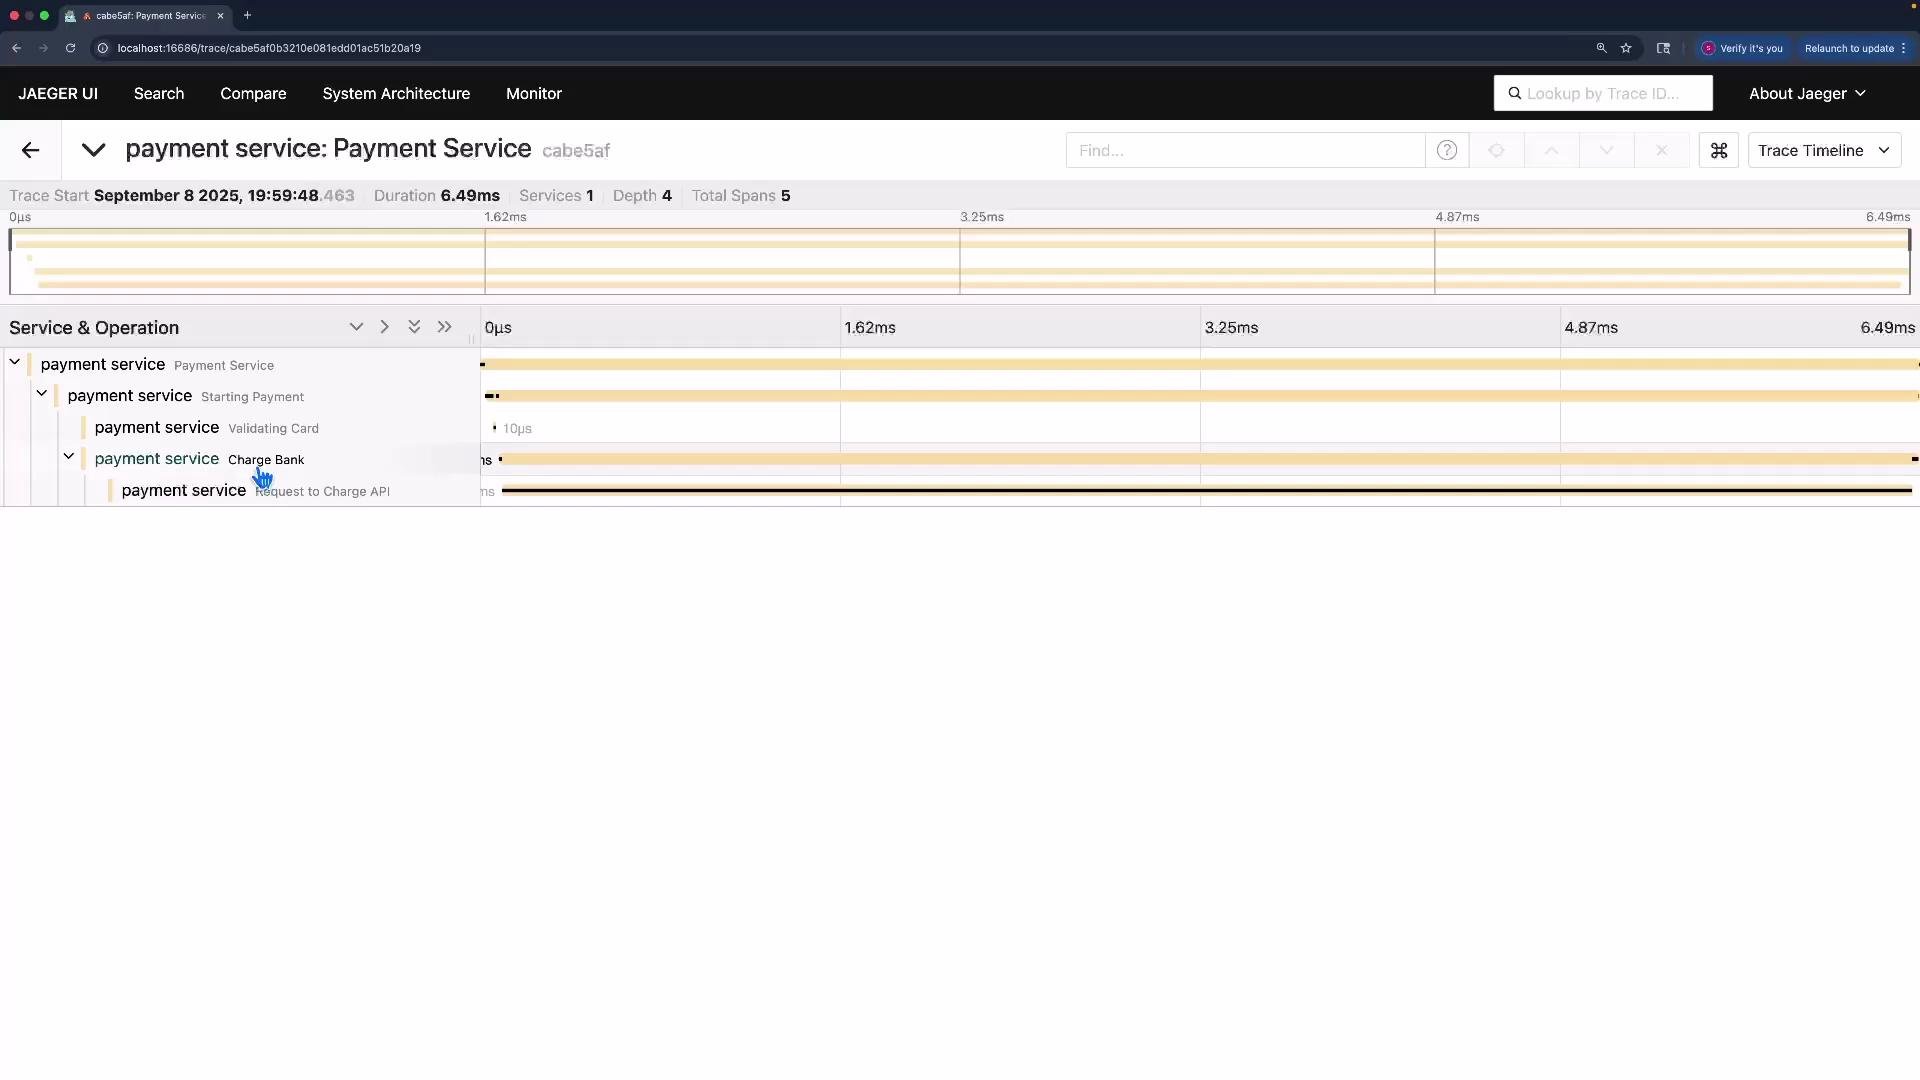
Screenshots below illustrate the common symptom: a trace for the payment service (with a CLIENT span) and a separate trace for the charge service (server span) that has a different trace id.
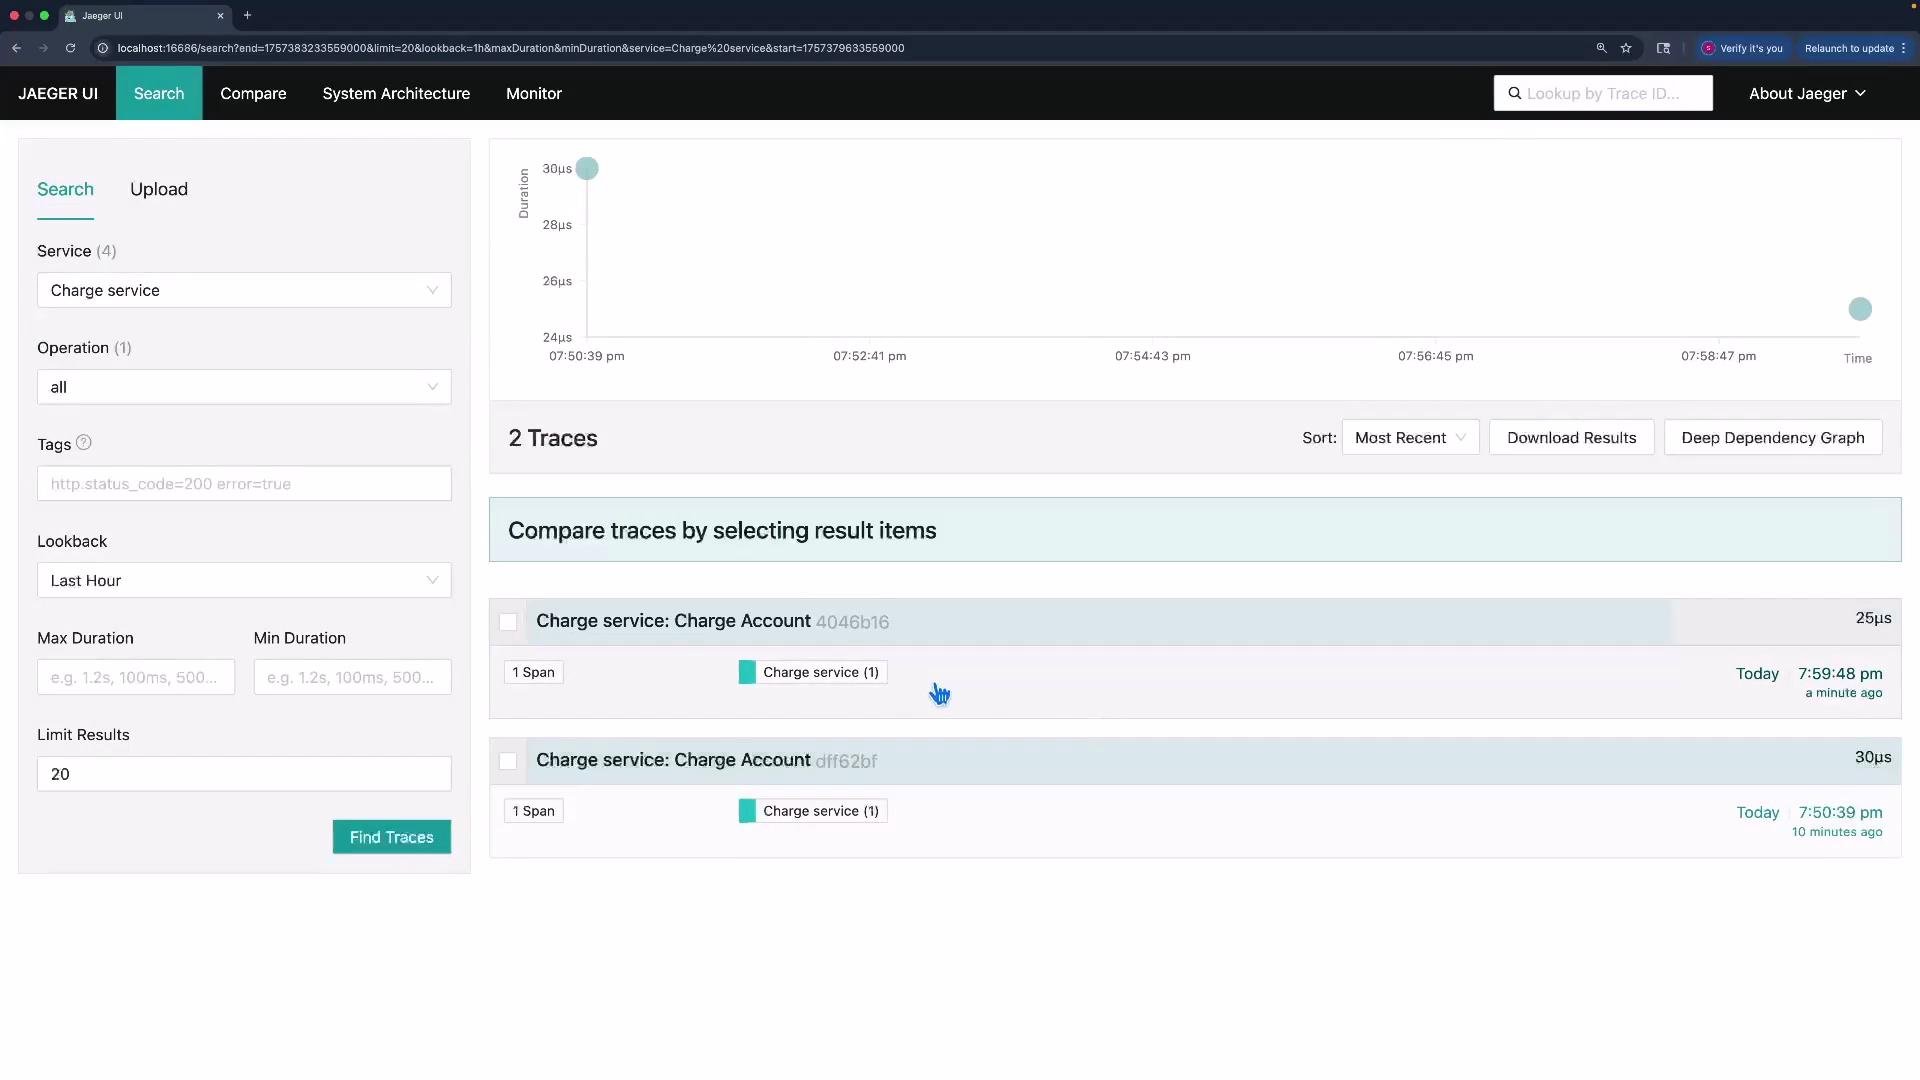
 You can also inspect the charge service traces in [Jaeger](https://www.jaegertracing.io/) and observe a different trace id for the server span:
 To correlate client and server spans into a single distributed trace you must propagate the trace context (for example, via HTTP headers). You can accomplish this manually using `opentelemetry.propagate.inject` / `opentelemetry.propagate.extract`, or by enabling automatic instrumentation for your HTTP client and web framework, which will handle propagation for you.
Debugging locally with ConsoleSpanExporter
Switching both services to use `ConsoleSpanExporter` prints spans to stdout. Use this to verify trace IDs and parent-child relationships:
* When context is correctly injected, the client span and the server span will share the same `trace_id`.
* When context is not injected, you will see different `trace_id`s and separate traces.
Common causes for separate traces and quick fixes
| Cause | Symptom | Fix |
| ------------------------------------- | ------------------------------------------------------ | -------------------------------------------------------------------------------------------------------- |
| No propagation | Client span and server span have different `trace_id`s | Inject context on client (`propagate.inject`) and extract on server (automatic in many instrumentations) |
| Different propagation formats | Headers not understood by receiving service | Use default W3C Trace Context headers or ensure both sides use the same propagator |
| Services export to different backends | Traces not visible together in one UI | Configure both services to use the same OTLP endpoint/collector |
| Missing instrumentation | Server does not extract context | Add server instrumentation or manual extraction logic |
Best practices and security notes
* Use the default W3C Trace Context for cross-service interoperability.
* Avoid recording sensitive information (PII, full card numbers) as span attributes or events.
* Ensure both services export telemetry to the same collector/backend (`OTLPSpanExporter` endpoint).
Next steps (what to change if you see separate traces)
* Ensure both services use the same propagation format (W3C Trace Context recommended).
* Either:
* Manually inject the trace context into outgoing request headers (as shown above) and ensure the server extracts it (or uses automatic server instrumentation), or
* Use OpenTelemetry instrumentation libraries for your HTTP client and server framework to automatically propagate context and create appropriate spans.
* Confirm both services export to the same backend (same OTLP endpoint/collector) and that the tracer resource `service.name` is set appropriately for each service.
References and further reading
* [OpenTelemetry Python Documentation](https://opentelemetry.io/docs/instrumentation/python/)
* [Jaeger — Distributed Tracing](https://www.jaegertracing.io/)
* [OTLP Exporter Specification](https://opentelemetry.io/docs/reference/specification/protocol/otlp/)
* [W3C Trace Context](https://www.w3.org/TR/trace-context/)
When adding span attributes, never include sensitive information such as full credit card numbers, authentication tokens, or PII. Use truncated or hashed values if you must record identifying information for debugging.
To correlate client and server spans into a single distributed trace you must propagate the trace context (for example, via HTTP headers). You can accomplish this manually using `opentelemetry.propagate.inject` / `opentelemetry.propagate.extract`, or by enabling automatic instrumentation for your HTTP client and web framework, which will handle propagation for you.
Debugging locally with ConsoleSpanExporter
Switching both services to use `ConsoleSpanExporter` prints spans to stdout. Use this to verify trace IDs and parent-child relationships:
* When context is correctly injected, the client span and the server span will share the same `trace_id`.
* When context is not injected, you will see different `trace_id`s and separate traces.
Common causes for separate traces and quick fixes
| Cause | Symptom | Fix |
| ------------------------------------- | ------------------------------------------------------ | -------------------------------------------------------------------------------------------------------- |
| No propagation | Client span and server span have different `trace_id`s | Inject context on client (`propagate.inject`) and extract on server (automatic in many instrumentations) |
| Different propagation formats | Headers not understood by receiving service | Use default W3C Trace Context headers or ensure both sides use the same propagator |
| Services export to different backends | Traces not visible together in one UI | Configure both services to use the same OTLP endpoint/collector |
| Missing instrumentation | Server does not extract context | Add server instrumentation or manual extraction logic |
Best practices and security notes
* Use the default W3C Trace Context for cross-service interoperability.
* Avoid recording sensitive information (PII, full card numbers) as span attributes or events.
* Ensure both services export telemetry to the same collector/backend (`OTLPSpanExporter` endpoint).
Next steps (what to change if you see separate traces)
* Ensure both services use the same propagation format (W3C Trace Context recommended).
* Either:
* Manually inject the trace context into outgoing request headers (as shown above) and ensure the server extracts it (or uses automatic server instrumentation), or
* Use OpenTelemetry instrumentation libraries for your HTTP client and server framework to automatically propagate context and create appropriate spans.
* Confirm both services export to the same backend (same OTLP endpoint/collector) and that the tracer resource `service.name` is set appropriately for each service.
References and further reading
* [OpenTelemetry Python Documentation](https://opentelemetry.io/docs/instrumentation/python/)
* [Jaeger — Distributed Tracing](https://www.jaegertracing.io/)
* [OTLP Exporter Specification](https://opentelemetry.io/docs/reference/specification/protocol/otlp/)
* [W3C Trace Context](https://www.w3.org/TR/trace-context/)
When adding span attributes, never include sensitive information such as full credit card numbers, authentication tokens, or PII. Use truncated or hashed values if you must record identifying information for debugging.