> ## Documentation Index
> Fetch the complete documentation index at: https://notes.kodekloud.com/llms.txt
> Use this file to discover all available pages before exploring further.
# Demo Exceptions
> Demonstrates recording exceptions in OpenTelemetry traces, showing add_event, record_exception, and best practices for capturing error metadata and annotating spans
In this lesson we'll show how to record exceptions in your OpenTelemetry traces. Exceptions occur when something unexpected fails — for example, a request to an external Charge API might fail because the remote service is down or the network is unavailable. Attaching exception details to spans helps you answer: what failed, when did it fail, and where in the trace timeline the failure occurred.
Below are three progressively richer examples that demonstrate:
* creating a client span for an outgoing HTTP request,
* annotating spans with events and attributes,
* recording exceptions explicitly, and
* using the built-in helper to capture exception type, message, and stack trace.
First, a simple, clean example that creates a client span and annotates it with events and attributes:
```python theme={null}
# payment.py
import requests
from opentelemetry import trace
from opentelemetry.trace import SpanKind
from opentelemetry.propagate import inject
tracer = trace.get_tracer(__name__)
def charge_bank():
print("charging bank")
with tracer.start_as_current_span("Request to Charge API", kind=SpanKind.CLIENT) as span:
url = "http://127.0.0.1:5000/charge"
span.set_attributes({
"http.method": "GET",
"http.url": url,
})
headers = {}
inject(headers)
span.add_event("Sending Request")
resp = requests.get(url, headers=headers)
span.add_event("Request sent", {"url": url})
span.set_attribute("http.status_code", resp.status_code)
if __name__ == "__main__":
with tracer.start_as_current_span("Payment Service"):
charge_bank()
```
If the remote service is unreachable (for example, if you mistakenly target port 5002 where nothing is listening) the `requests.get` call will raise an exception. You can catch that exception and add it to the span as a plain event:
```python theme={null}
# payment.py (with explicit try/except)
import requests
from opentelemetry import trace
from opentelemetry.trace import SpanKind
from opentelemetry.propagate import inject
tracer = trace.get_tracer(__name__)
def charge_bank():
print("charging bank")
with tracer.start_as_current_span("Request to Charge API", kind=SpanKind.CLIENT) as span:
try:
url = "http://127.0.0.1:5002/charge" # intentionally incorrect port to force failure
span.set_attributes({
"http.method": "GET",
"http.url": url,
})
headers = {}
inject(headers)
span.add_event("Sending Request")
resp = requests.get(url, headers=headers)
span.add_event("Request sent", {"url": url})
span.set_attribute("http.status_code", resp.status_code)
except Exception as err:
# Record the exception as an event (string form)
span.add_event("exception", attributes={"error": str(err)})
if __name__ == "__main__":
with tracer.start_as_current_span("Payment Service"):
charge_bank()
```
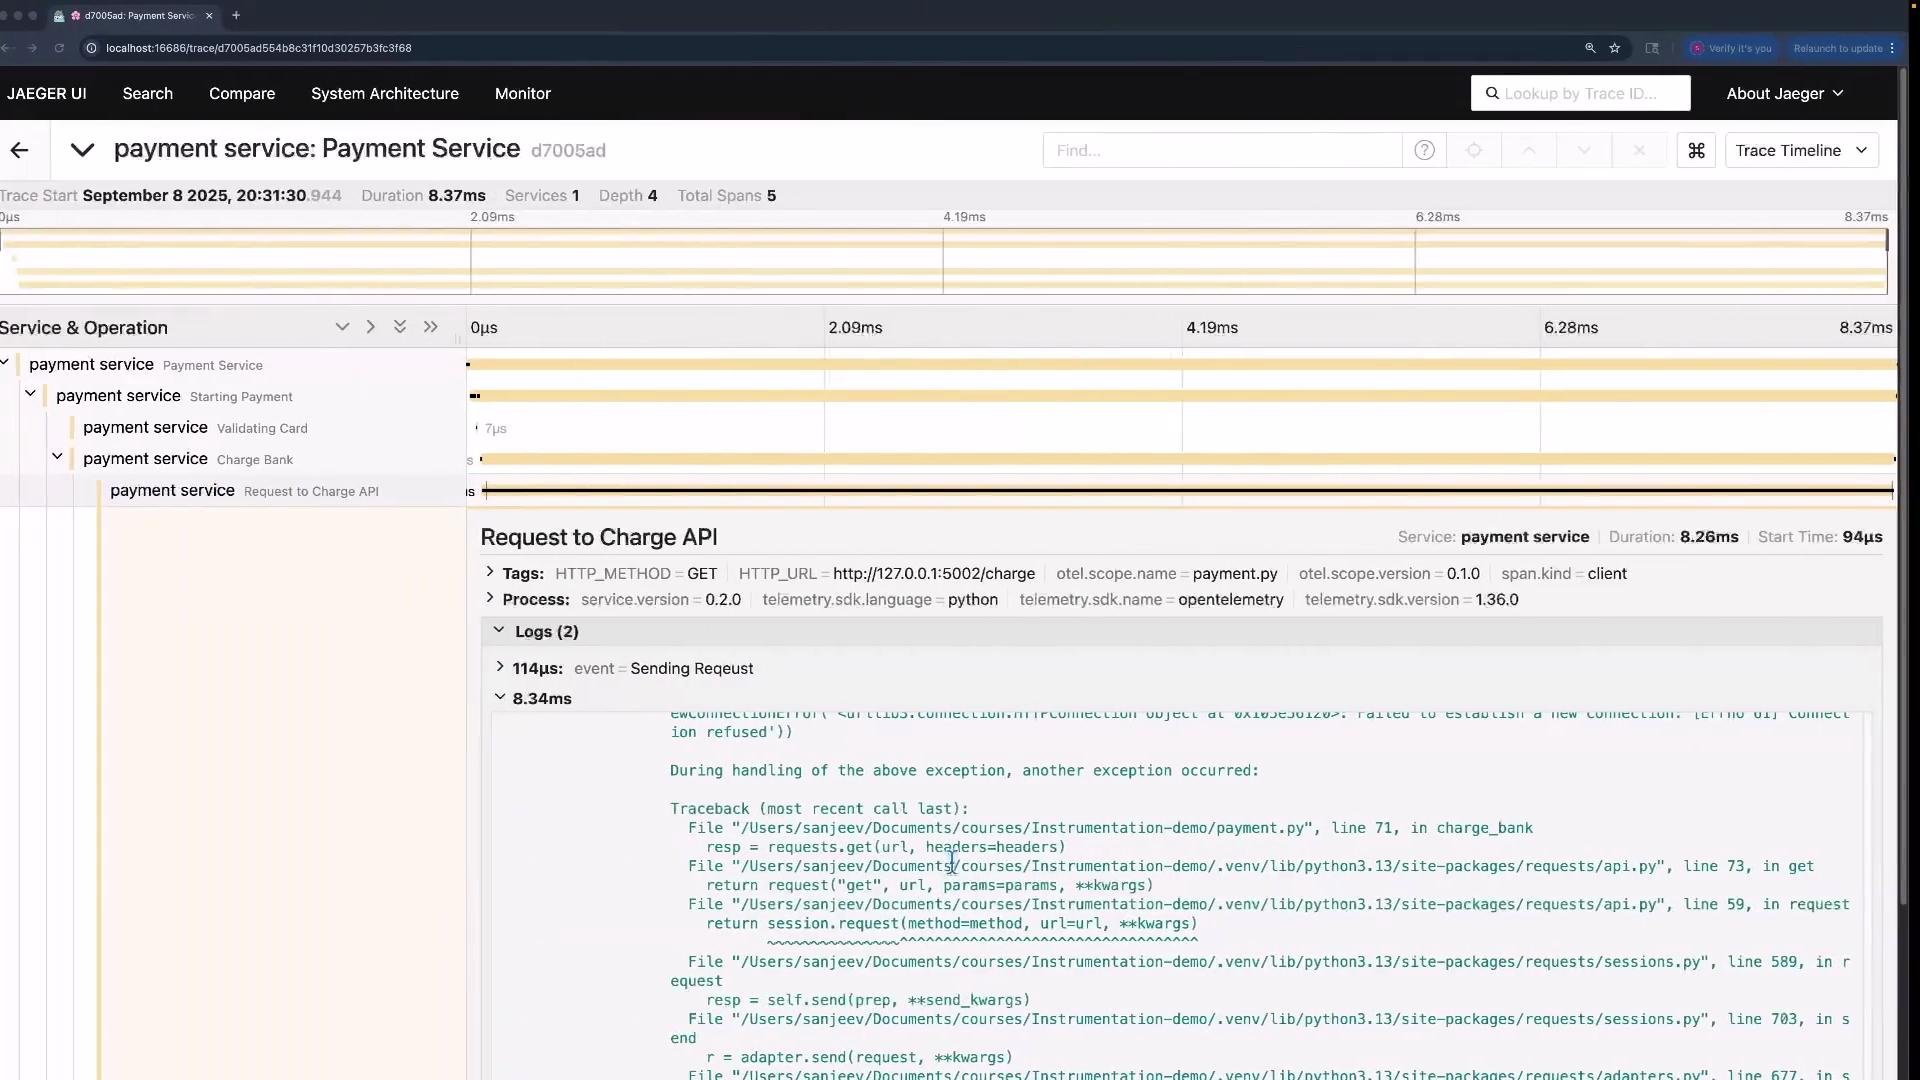
This approach attaches an "exception" event to the span and includes the error message as an attribute. A better approach is to use the span API's built-in helper so the instrumentation captures richer exception metadata (type, message, and stack trace):
```python theme={null}
# payment.py (use record_exception)
import requests
from opentelemetry import trace
from opentelemetry.trace import SpanKind
from opentelemetry.propagate import inject
tracer = trace.get_tracer(__name__)
def charge_bank():
print("charging bank")
with tracer.start_as_current_span("Request to Charge API", kind=SpanKind.CLIENT) as span:
try:
url = "http://127.0.0.1:5002/charge" # intentionally incorrect port to force failure
span.set_attributes({
"http.method": "GET",
"http.url": url,
})
headers = {}
inject(headers)
span.add_event("Sending Request")
resp = requests.get(url, headers=headers)
span.add_event("Request sent", {"url": url})
span.set_attribute("http.status_code", resp.status_code)
except Exception as err:
# record_exception captures type, message and stack trace
span.record_exception(err)
# Optionally set the span status to error (if desired)
span.set_status(trace.Status(trace.StatusCode.ERROR, str(err)))
if __name__ == "__main__":
with tracer.start_as_current_span("Payment Service"):
charge_bank()
```
Using `span.record_exception(err)` will include the exception type, message, and stack trace in the span. You can also set the span status to error with `span.set_status(...)` to make the error state explicit.
Best practices and behavior
* Prefer `span.record_exception(err)` when you want structured exception data (type, message, stack trace) in the span.
* Use `span.set_status(trace.Status(trace.StatusCode.ERROR, "..."))` if you want the span to be explicitly marked as an error in UI/analytics.
* You do not always need an explicit try/except: if an exception propagates out of a span and your instrumentation/exporter is configured to capture uncaught exceptions, the tracing system may automatically record the exception on that span.
* For richer context, include relevant attributes (HTTP method, URL, status code, and other request metadata) so backends can correlate exceptions with request details.
Comparison: event vs record\_exception vs automatic capture
| Approach | Captures | Use when |
| ----------------------------------------------- | --------------------------------------------------------------------- | ------------------------------------------------------------------------------- |
| `span.add_event("exception", attributes={...})` | Arbitrary attributes you add (e.g. `{"error": "Connection refused"}`) | You want custom, lightweight event data. |
| `span.record_exception(err)` | Exception type, message, stack trace | You want structured exception data for debugging and stack traces. |
| Automatic capture by instrumentation | Depends on instrumentation/exporter configuration | You rely on automatic capture for uncaught exceptions and minimal code changes. |
When recorded, tracing backends such as [Jaeger](https://www.jaegertracing.io/) will display the exception event and stack trace in the trace timeline, making it easy to correlate a failure with the specific span and service.
References
* OpenTelemetry Python API: [https://opentelemetry.io/docs/instrumentation/python/](https://opentelemetry.io/docs/instrumentation/python/)
* Jaeger tracing: [https://www.jaegertracing.io/](https://www.jaegertracing.io/)