> ## Documentation Index
> Fetch the complete documentation index at: https://notes.kodekloud.com/llms.txt
> Use this file to discover all available pages before exploring further.
# Demo Exporters
> Guide to replacing ConsoleSpanExporter with an OTLP HTTP exporter to send OpenTelemetry traces to Jaeger, including configuration, installation, and verification steps.
In this lesson we'll replace the ConsoleSpanExporter (which prints spans to stdout) with an exporter that sends traces to a tracing backend. Printing spans to the console is useful for local debugging, but production systems typically send traces to a backend such as Jaeger or a hosted OTLP-compatible service.
Why this matters:
* ConsoleSpanExporter: good for quick debugging and tests.
* OTLP exporter: sends traces to real backends for storage, visualization, and correlation across services.
## Current tracer configuration (ConsoleSpanExporter)
Example: a minimal tracer setup that prints spans to the console:
```python theme={null}
from opentelemetry import trace
from opentelemetry.sdk.trace import TracerProvider
from opentelemetry.sdk.trace.export import ConsoleSpanExporter, BatchSpanProcessor
def configure_tracer():
exporter = ConsoleSpanExporter()
span_processor = BatchSpanProcessor(exporter)
provider = TracerProvider()
provider.add_span_processor(span_processor)
trace.set_tracer_provider(provider) # trace.get_tracer(...)
```
A typical ConsoleSpanExporter output for a span might look like this JSON representation:
```json theme={null}
{
"span_id": "0x3bad5c03252174ba",
"trace_state": "{}",
"kind": "SpanKind.INTERNAL",
"parent_id": null,
"start_time": "2025-09-01T01:10:06.523273Z",
"end_time": "2025-09-01T01:10:06.523365Z",
"status": {}
}
```
## Exporting to Jaeger via OTLP
Rather than printing spans locally, we’ll send them to Jaeger. Jaeger accepts traces via the OpenTelemetry Protocol (OTLP), so we can use the OTLP HTTP exporter provided by OpenTelemetry instead of a Jaeger‑specific exporter. This keeps your instrumentation portable to any OTLP-compatible backend.
Jaeger supports OTLP (HTTP and gRPC). Using the OTLP exporter keeps your instrumentation portable to any backend that accepts OTLP, not just Jaeger.
Install the OTLP HTTP exporter package:
```bash theme={null}
pip install opentelemetry-exporter-otlp-proto-http
```
Verify installation (example output; versions may differ):
```plaintext theme={null}
importlib_metadata==8.7.0
opentelemetry-api==1.36.0
opentelemetry-exporter-otlp-proto-common==1.36.0
opentelemetry-exporter-otlp-proto-http==1.36.0
opentelemetry-proto==1.36.0
opentelemetry-sdk==1.36.0
opentelemetry-semantic-conventions==0.57b0
protobuf==6.32.0
requests==2.32.5
typing_extensions==4.15.0
urllib3==2.5.0
zipp==3.23.0
```
### Update tracer configuration to use OTLPSpanExporter
When sending to a local Jaeger instance, the OTLP HTTP endpoint is typically `http://localhost:4318/v1/traces`. Update your tracer configuration to use the OTLP HTTP exporter:
```python theme={null}
from opentelemetry import trace
from opentelemetry.sdk.trace import TracerProvider
from opentelemetry.sdk.trace.export import BatchSpanProcessor
from opentelemetry.exporter.otlp.proto.http.trace_exporter import OTLPSpanExporter
def configure_tracer():
exporter = OTLPSpanExporter(endpoint="http://localhost:4318/v1/traces")
span_processor = BatchSpanProcessor(exporter)
provider = TracerProvider()
provider.add_span_processor(span_processor)
trace.set_tracer_provider(provider) # trace.get_tracer(...)
```
Notes:
* Use `BatchSpanProcessor` in production; it buffers spans and sends them efficiently. `SimpleSpanProcessor` sends synchronously and can hurt performance.
* OTLP over HTTP commonly uses port `4318` and the `/v1/traces` path. If using OTLP/gRPC or a hosted service, verify the endpoint and protocol in the backend docs.
Make sure the endpoint, protocol (HTTP vs gRPC), and any required authentication match your Jaeger or hosted OTLP service. Sending to the wrong endpoint or protocol will result in dropped traces.
## Quick comparison
| Exporter | Use case | Example configuration |
| ----------------------- | ---------------------------------------------------- | -------------------------------------------------------------- |
| ConsoleSpanExporter | Local debugging and development | `ConsoleSpanExporter()` |
| OTLPSpanExporter (HTTP) | Send traces to Jaeger or any OTLP-compatible backend | `OTLPSpanExporter(endpoint="http://localhost:4318/v1/traces")` |
## Run your instrumented application
Save the updated configuration and run your application. The application’s runtime output (print statements) will remain the same, but span data will be exported to Jaeger:
```bash theme={null}
python payment.py
# Expected stdout:
# processing payment
# validating card
# charging bank
```
After running, open the Jaeger UI (usually at `http://localhost:16686`) and search for traces. In this example the traces appear, but the service is shown as `unknown_service` — we’ll fix the service/resource name in the next step.
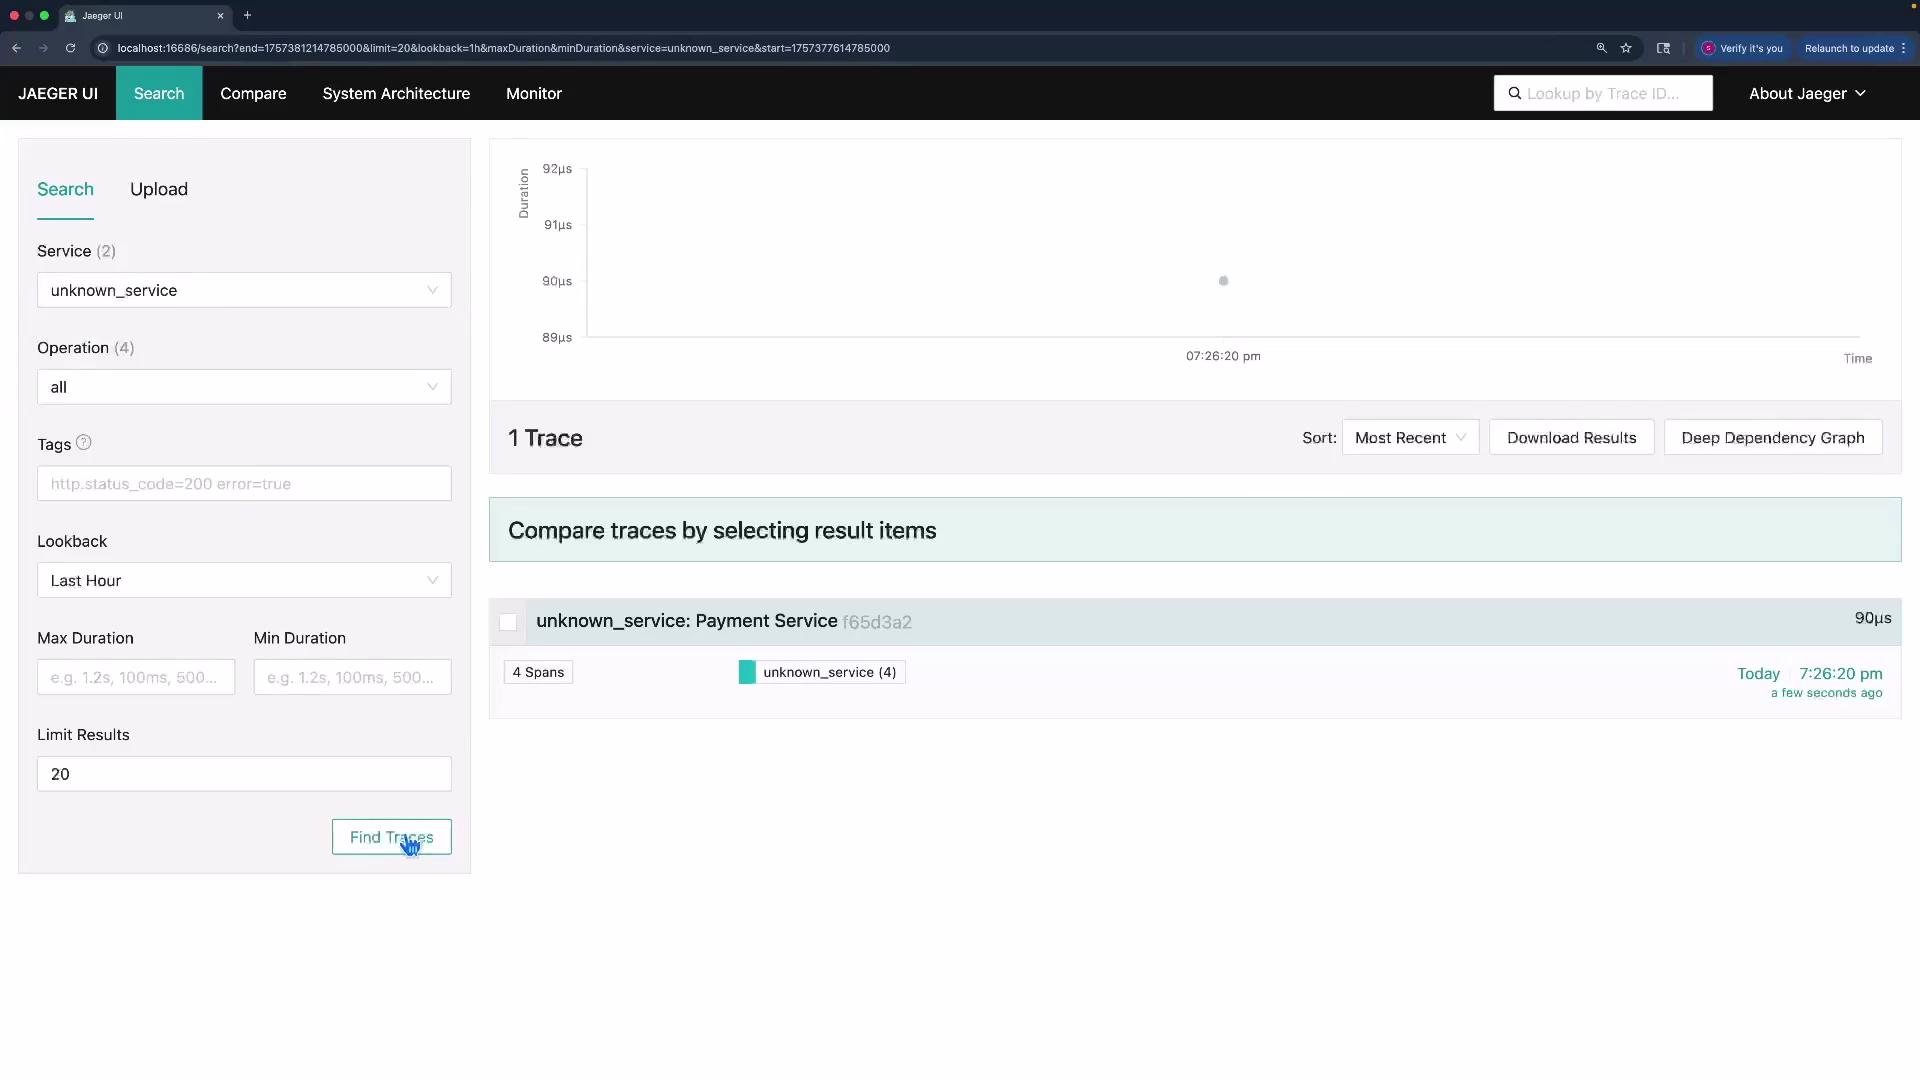 The trace shown includes spans for the payment flow (start payment, validating card, charge bank), confirming that OTLP export to Jaeger is working. In the following lesson we’ll configure the Resource (service name and attributes) so traces display with a meaningful service name in Jaeger.
## References
* Jaeger: [https://www.jaegertracing.io/](https://www.jaegertracing.io/)
* OpenTelemetry OTLP spec: [https://opentelemetry.io/docs/reference/specification/protocol/otlp/](https://opentelemetry.io/docs/reference/specification/protocol/otlp/)
The trace shown includes spans for the payment flow (start payment, validating card, charge bank), confirming that OTLP export to Jaeger is working. In the following lesson we’ll configure the Resource (service name and attributes) so traces display with a meaningful service name in Jaeger.
## References
* Jaeger: [https://www.jaegertracing.io/](https://www.jaegertracing.io/)
* OpenTelemetry OTLP spec: [https://opentelemetry.io/docs/reference/specification/protocol/otlp/](https://opentelemetry.io/docs/reference/specification/protocol/otlp/)