> ## Documentation Index
> Fetch the complete documentation index at: https://notes.kodekloud.com/llms.txt
> Use this file to discover all available pages before exploring further.
# Demo Propagating Context
> Explains propagating OpenTelemetry trace context across HTTP between payment client and charge server using inject and extract in Python Flask.
In this guide you'll learn how to fix a common tracing problem: two services (payment and charge) producing separate traces for the same user request. The root cause is that the OpenTelemetry context (trace id, span, trace state) is not being propagated across the HTTP boundary. The solution is to inject the current context as headers on the client side and to extract and activate that context on the server side.
Overview
* Client (payment service): inject the current OpenTelemetry context into outgoing HTTP headers.
* Server (charge service): extract the context from incoming headers, attach it for the request lifecycle, and detach it in teardown.
We inject the context into an HTTP carrier (headers) with `inject(...)` and retrieve it on the server with `extract(...)`. Both utilities are available from `opentelemetry.propagate`.
Quick reference
| Action | Function | Typical use |
| ------------------------------------- | -------------------------- | ----------------------------------------------------- |
| Inject context into outgoing carrier | `inject(headers)` | Client: add propagation fields to `requests` headers |
| Extract context from incoming carrier | `extract(request.headers)` | Server: read propagation fields from incoming request |
## Payment service (client) — inject context into request headers
Goals
* Configure the tracer provider and exporter for the payment service.
* Create a client span for the outgoing HTTP request.
* Call `inject(headers)` before sending the request so propagation fields are added to the HTTP headers.
* Pass `headers` to `requests.get(..., headers=headers)`.
Example payment service (simplified):
```python theme={null}
# payment.py
import requests
from opentelemetry.propagate import inject
from opentelemetry import trace
from opentelemetry.sdk.trace import TracerProvider
from opentelemetry.sdk.resources import Resource
from opentelemetry.sdk.trace.export import ConsoleSpanExporter, BatchSpanProcessor
# Optional OTLP exporter:
def configure_tracer():
resource = Resource.create({
"service.name": "payment service",
"service.version": "0.2.0",
})
provider = TracerProvider(resource=resource)
exporter = ConsoleSpanExporter()
# exporter = OTLPSpanExporter(endpoint="http://localhost:4318/v1/traces")
span_processor = BatchSpanProcessor(exporter)
provider.add_span_processor(span_processor)
trace.set_tracer_provider(provider)
return trace.get_tracer(__name__)
tracer = configure_tracer()
@tracer.start_as_current_span("Charge Bank")
def charge_bank():
print("charging bank")
# Create a client span for the outgoing HTTP request
with tracer.start_as_current_span("Request to Charge API", kind=trace.SpanKind.CLIENT) as span:
url = "http://127.0.0.1:5000/charge"
# Set useful attributes for the request span
span.set_attribute("http.method", "GET")
span.set_attribute("http.url", url)
# Inject current context into headers
headers = {}
inject(headers)
# Make the HTTP request with the propagated headers
resp = requests.get(url, headers=headers)
span.set_attribute("http.status_code", resp.status_code)
if __name__ == "__main__":
charge_bank()
```
Key points
* `inject(headers)` mutates your headers dictionary to include propagation fields (traceparent, tracestate, etc.).
* Use `headers=headers` when calling `requests.get()` so the downstream service receives the context.
## Charge service (server) — extract and attach context from incoming headers
Goals
* Configure tracer provider and exporter for the charge service.
* Extract the incoming context from request headers and attach it so the propagated trace becomes active for the request handler.
* Save the returned token to `request.environ` and detach it in `teardown_request` to restore the previous context.
Important functions: `opentelemetry.propagate.extract`, `opentelemetry.context.attach`, and `opentelemetry.context.detach`.
Example charge service:
```python theme={null}
# charge.py
from flask import Flask, request
from opentelemetry.propagate import extract
from opentelemetry import trace
from opentelemetry.context import attach, detach
from opentelemetry.sdk.trace import TracerProvider
from opentelemetry.sdk.resources import Resource
from opentelemetry.sdk.trace.export import ConsoleSpanExporter, BatchSpanProcessor
# Optional OTLP exporter:
def configure_tracer():
resource = Resource.create({
"service.name": "charge service",
"service.version": "0.5.0",
})
provider = TracerProvider(resource=resource)
exporter = ConsoleSpanExporter()
# exporter = OTLPSpanExporter(endpoint="http://localhost:4318/v1/traces")
span_processor = BatchSpanProcessor(exporter)
provider.add_span_processor(span_processor)
trace.set_tracer_provider(provider)
return trace.get_tracer(__name__)
tracer = configure_tracer()
app = Flask(__name__)
@app.before_request
def before_request_func():
# Extract the context from incoming request headers and make it active
token = attach(extract(request.headers))
# Save the token so we can detach in teardown
request.environ["context_token"] = token
@app.teardown_request
def teardown_request_func(exc):
# Detach previously attached context token to restore previous context
token = request.environ.get("context_token", None)
if token:
detach(token)
@app.route("/charge")
@tracer.start_as_current_span("Charge Account", kind=trace.SpanKind.SERVER)
def charge():
span = trace.get_current_span()
span.set_attribute("http.method", request.method)
span.set_attribute("client.ip", request.remote_addr)
span.set_attribute("http.path", request.path)
return "Charging Users Bank Account"
if __name__ == "__main__":
app.run(debug=True)
```
Flask passes an exception argument to `teardown_request`. The teardown function must accept that parameter (for example `def teardown_request_func(exc):`) even if you don't use it, otherwise Flask will raise an error.
## Run and verify
1. Start the charge service (server): `python charge.py`
2. Start the payment service (client) and trigger the request: `python payment.py`
3. Observe the console output or your tracing backend. With the Console exporter you will see both client and server spans logged; with OTLP -> Jaeger you will see a single distributed trace containing both services.
Expected behavior
* Both client and server spans should share the same `trace_id`.
* The server span's `parent_id` should match the client span's `span_id`, indicating correct parent/child relationships.
Example of a client span (trimmed):
```json theme={null}
{
"name": "Request to Charge API",
"context": {
"trace_id": "0x026ef7be217ce0d83fe16a255578eb4",
"span_id": "0xafb59c6fb586f176",
"trace_state": "[]"
},
"kind": "SpanKind.CLIENT",
"attributes": {
"http.method": "GET",
"http.url": "http://127.0.0.1:5000/charge",
"http.status_code": 200
}
}
```
Corresponding server span (trimmed):
```json theme={null}
{
"name": "Charge Account",
"context": {
"trace_id": "0x026ef7be217ce0d83fe16a255578eb4",
"span_id": "0xbfdc2355760919cb",
"trace_state": "[]"
},
"kind": "SpanKind.SERVER",
"parent_id": "0xafb59c6fb586f176",
"attributes": {
"http.method": "GET",
"client.ip": "127.0.0.1",
"http.path": "/charge"
}
}
```
Notice:
* Shared `trace_id` confirms both spans belong to the same distributed trace.
* `parent_id` on the server span matches the client span's `span_id`, confirming the correct parent-child relationship.
If you use OTLP -> Jaeger or another backend, you should see a single trace containing both services (payment and charge). Example screenshot of Jaeger UI showing both services inside the same trace:
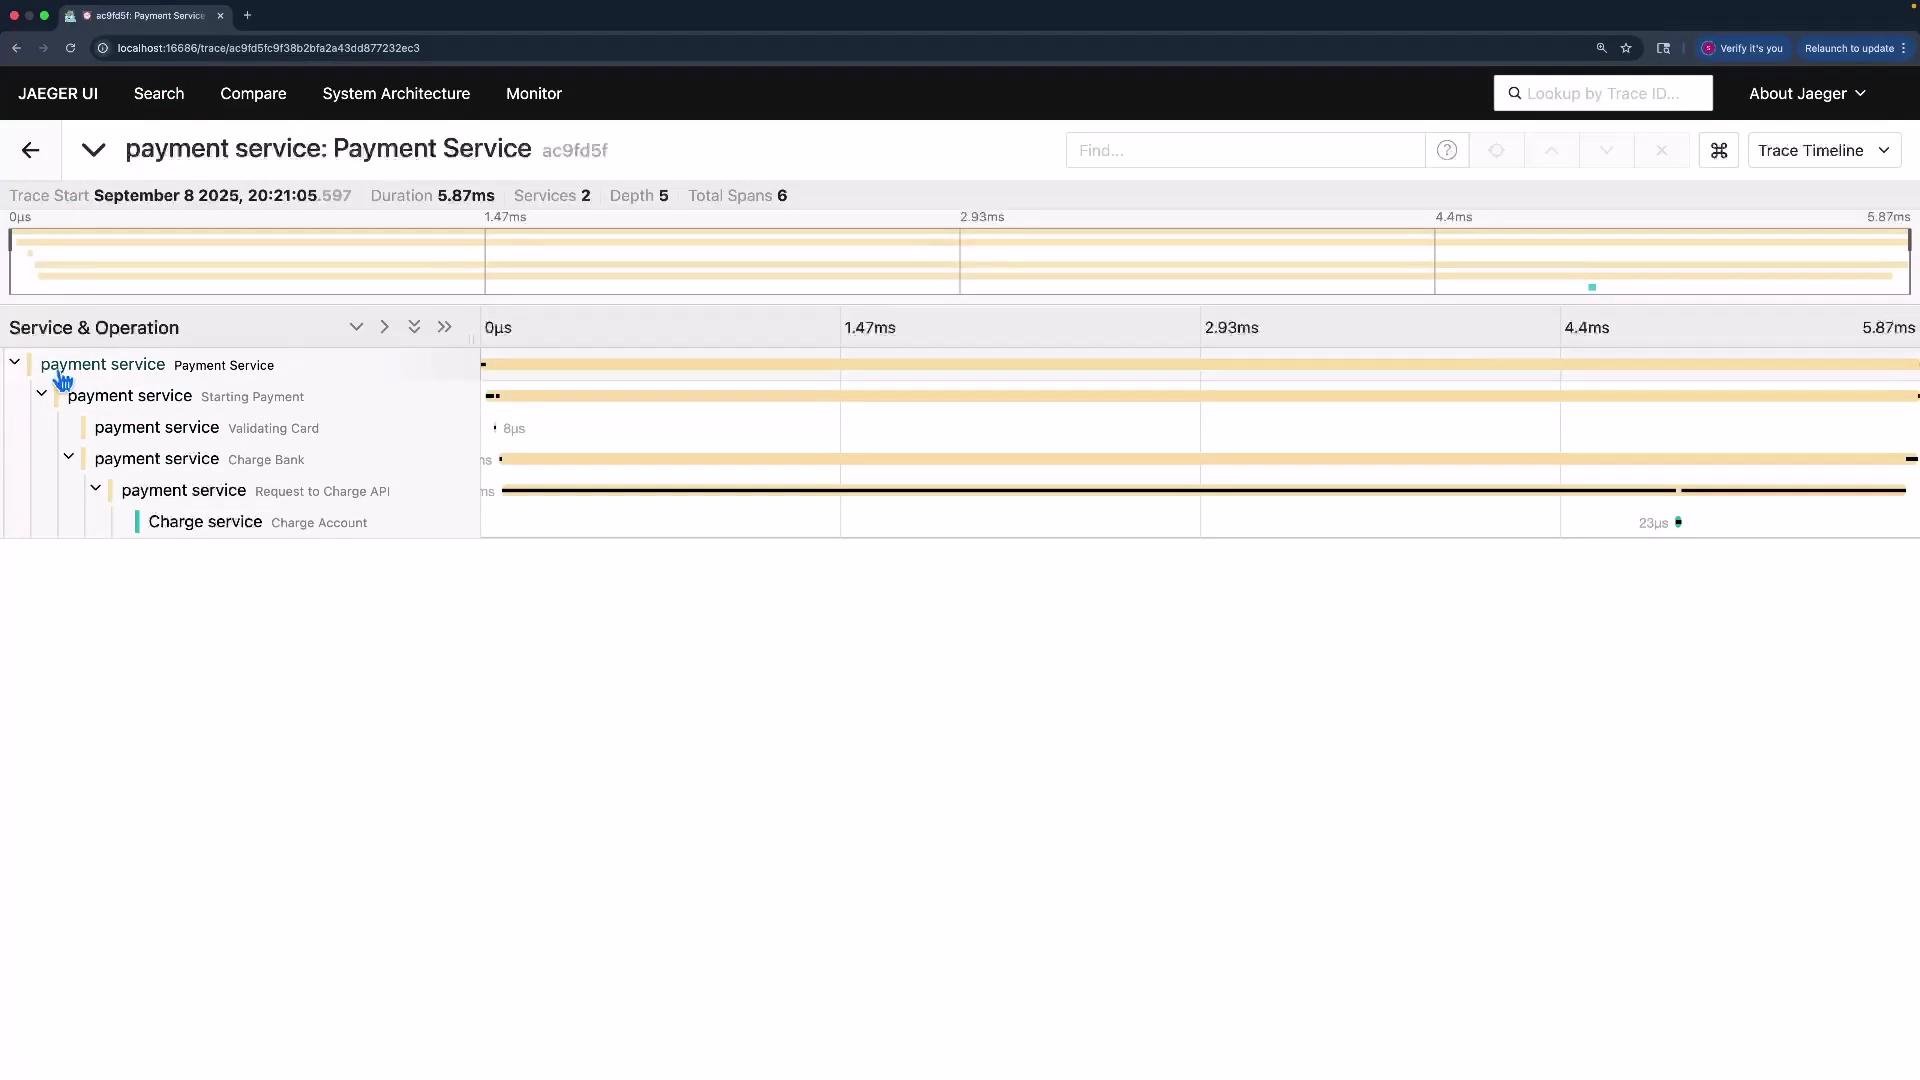 With these propagation changes the two services are connected in the same trace, enabling end-to-end visibility across the request path.
Links and references
* [OpenTelemetry](https://opentelemetry.io/)
* [OpenTelemetry Python API docs](https://opentelemetry-python.readthedocs.io/en/latest/)
* [Flask documentation](https://flask.palletsprojects.com/)
* [Jaeger project](https://www.jaegertracing.io/)
With these propagation changes the two services are connected in the same trace, enabling end-to-end visibility across the request path.
Links and references
* [OpenTelemetry](https://opentelemetry.io/)
* [OpenTelemetry Python API docs](https://opentelemetry-python.readthedocs.io/en/latest/)
* [Flask documentation](https://flask.palletsprojects.com/)
* [Jaeger project](https://www.jaegertracing.io/)