> ## Documentation Index
> Fetch the complete documentation index at: https://notes.kodekloud.com/llms.txt
> Use this file to discover all available pages before exploring further.
# Demo Resource Attributes
> How to set OpenTelemetry resource attributes so traces include service metadata and appear correctly in Jaeger for better filtering and identification
In this lesson we address a common issue: traces showing up in Jaeger as `unknown_service`, which makes it difficult to identify which application produced them. The fix is to configure resource attributes. Resource attributes are an immutable set of key/value pairs that describe the entity producing telemetry (for example, service name, service version, host, and environment). When set correctly, observability backends such as Jaeger and Tempo can surface and filter traces by these attributes.
Dependencies used in this demo:
```text theme={null}
opentelemetry-api==1.36.0
opentelemetry-exporter-otlp-proto-common==1.36.0
opentelemetry-exporter-otlp-proto-http==1.36.0
opentelemetry-proto==1.36.0
opentelemetry-sdk==1.36.0
opentelemetry-semantic-conventions==0.57b0
protobuf==6.32.0
requests==2.32.5
typing_extensions==4.15.0
urllib3==2.5.0
zipp==3.23.0
```
Example run before configuring resource attributes:
```bash theme={null}
python payment.py
processing payment
validating card
charging bank
```
What to change
* Import `Resource` from `opentelemetry.sdk.resources`.
* Create a `Resource` instance with semantic keys such as `service.name` and `service.version`.
* Pass the `Resource` to the `TracerProvider` so spans inherit the resource metadata.
Compact, corrected tracer configuration and example payment function:
```python theme={null}
from opentelemetry import trace
from opentelemetry.sdk.resources import Resource
from opentelemetry.sdk.trace import TracerProvider
from opentelemetry.sdk.trace.export import BatchSpanProcessor
from opentelemetry.exporter.otlp.proto.http.trace_exporter import OTLPSpanExporter
def configure_tracer():
exporter = OTLPSpanExporter(endpoint="http://localhost:4318/v1/traces")
span_processor = BatchSpanProcessor(exporter)
# Create a Resource that identifies this service
resource = Resource.create({
"service.name": "payment-service",
"service.version": "0.2.0"
})
provider = TracerProvider(resource=resource)
provider.add_span_processor(span_processor)
trace.set_tracer_provider(provider)
# Return an instrumented tracer for the application code
return trace.get_tracer("payment.py", "0.1.0")
tracer = configure_tracer()
@tracer.start_as_current_span("Starting Payment")
def process_payment():
print("processing payment")
print("validating card")
print("charging bank")
if __name__ == "__main__":
process_payment()
```
Quick checklist
* Use standard semantic keys (for example, `service.name`, `service.version`) so observability backends can detect and display them.
* Prefer attributes that describe the resource (the entity producing telemetry), not attributes that belong on individual spans.
* Add other resource attributes as needed (for example: `host.name`, `host.ip`, `deployment.environment`) to support searching and filtering.
Common resource attribute examples
| Attribute | Description | Example |
| --------------------------: | ------------------------------------------------- | ------------------------------------------------------------------------------------ |
| `service.name` | Canonical name of the service producing telemetry | `payment-service` |
| `service.version` | Version of the service | `0.2.0` |
| `deployment.environment` | Deployment environment (prod, staging, dev) | `production` |
| `host.name` | Hostname of the machine/container | `web-01` |
| `host.ip` | IP address of the host | `10.0.0.5` |
| `resource` creation example | How to create a Resource in code | `Resource.create({ "service.name": "payment-service", "service.version": "0.2.0" })` |
Before configuring resource attributes, traces appeared as `unknown_service` in Jaeger (screenshot below). After adding the Resource to the tracer and rerunning the script, the CLI output remains the same but spans include the resource attributes (service name, service.version), and Jaeger now lists the correct service.
```bash theme={null}
python payment.py
processing payment
validating card
charging bank
```
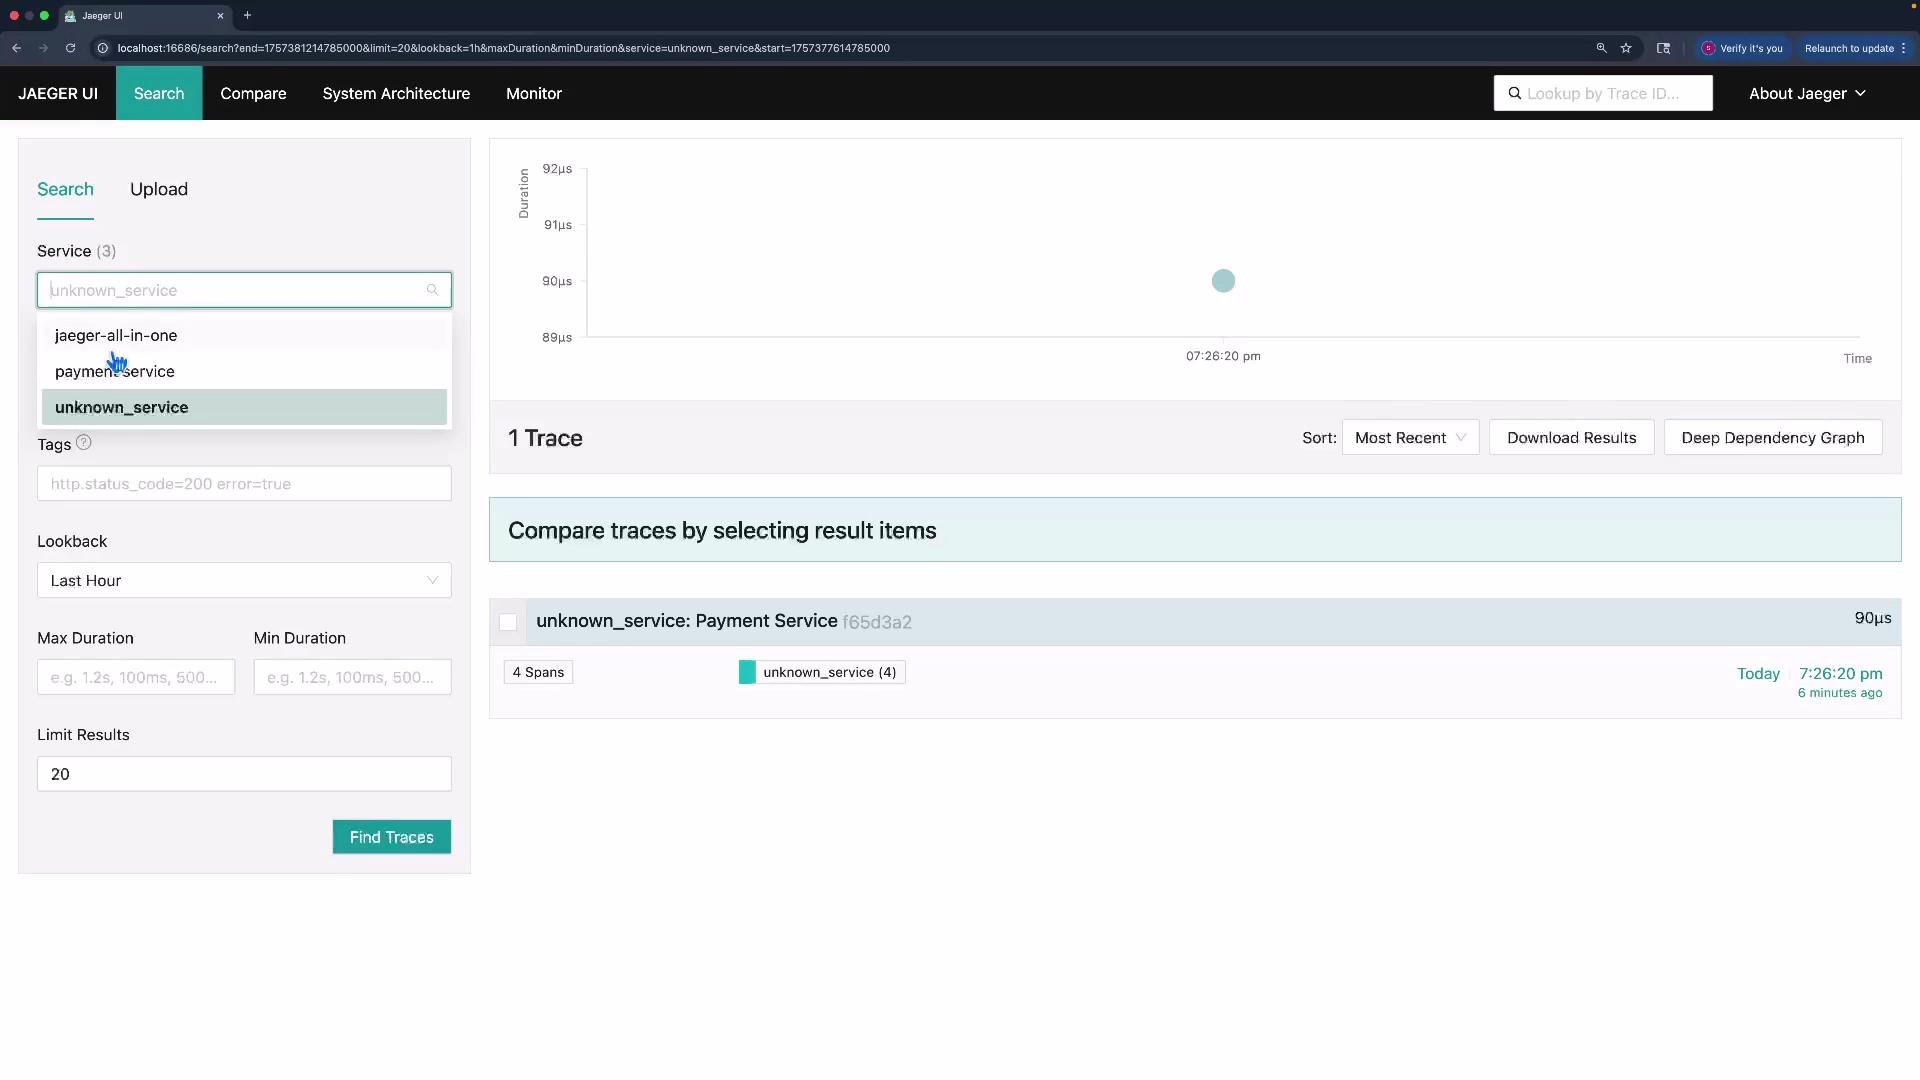 Now the Jaeger UI shows the correct service name (`payment-service`) in the service list, making it much easier to find and analyze relevant traces.
Resource attributes are intended to describe the entity producing telemetry and are treated as immutable metadata for that entity. Use standard keys (for example, `service.name`, `service.version`) to maximize interoperability with observability backends.
Now the Jaeger UI shows the correct service name (`payment-service`) in the service list, making it much easier to find and analyze relevant traces.
Resource attributes are intended to describe the entity producing telemetry and are treated as immutable metadata for that entity. Use standard keys (for example, `service.name`, `service.version`) to maximize interoperability with observability backends.
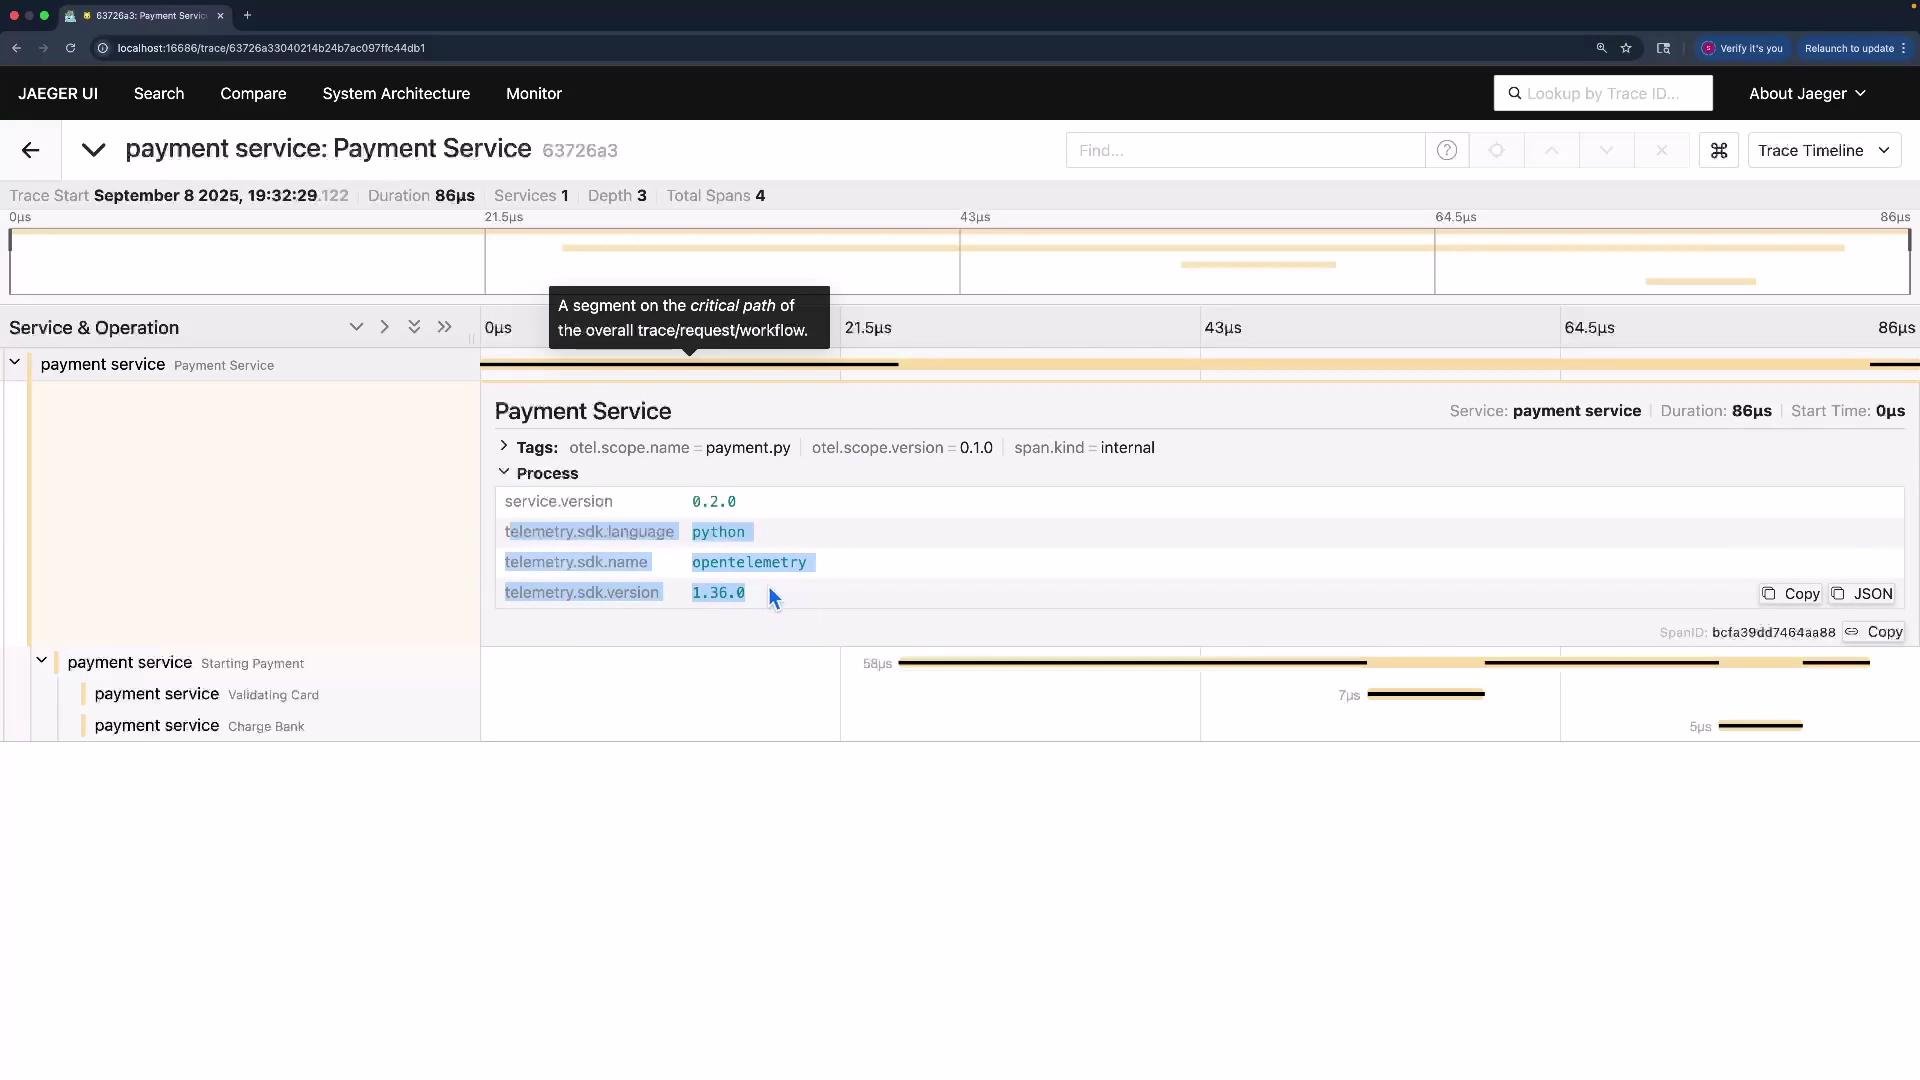 Inspecting individual traces in Jaeger will show the attached resource attributes (service name and version), along with automatically added SDK attributes such as the OpenTelemetry SDK language and version. These attributes make traces far easier to filter, group, and interpret.
Links and references
* [OpenTelemetry — Resources](https://opentelemetry.io/docs/reference/specification/resource/semantic_conventions/)
* [Jaeger Tracing](https://www.jaegertracing.io/)
* [OpenTelemetry Python SDK](https://opentelemetry.io/docs/instrumentation/python/)
Inspecting individual traces in Jaeger will show the attached resource attributes (service name and version), along with automatically added SDK attributes such as the OpenTelemetry SDK language and version. These attributes make traces far easier to filter, group, and interpret.
Links and references
* [OpenTelemetry — Resources](https://opentelemetry.io/docs/reference/specification/resource/semantic_conventions/)
* [Jaeger Tracing](https://www.jaegertracing.io/)
* [OpenTelemetry Python SDK](https://opentelemetry.io/docs/instrumentation/python/)