> ## Documentation Index
> Fetch the complete documentation index at: https://notes.kodekloud.com/llms.txt
> Use this file to discover all available pages before exploring further.
# Demo Zero Code Techniques in Python
> Demonstrates zero-code OpenTelemetry auto-instrumentation for Python Flask applications using opentelemetry-distro, bootstrap and opentelemetry-instrument to capture traces, metrics and database and HTTP spans
This article demonstrates zero-code (auto) instrumentation for Python applications using OpenTelemetry. We'll:
* Start with a minimal Flask app that has no OpenTelemetry packages.
* Install the OpenTelemetry distro and OTLP exporter.
* Use the auto-instrumentation tooling to capture traces and metrics without modifying application code.
* Show a slightly more complex example that exercises HTTP and database instrumentation.
Relevant links:
* OpenTelemetry: [https://opentelemetry.io/](https://opentelemetry.io/)
* Flask: [https://palletsprojects.com/p/flask/](https://palletsprojects.com/p/flask/)
* OTLP spec: [https://opentelemetry.io/docs/reference/specification/protocol/otlp/](https://opentelemetry.io/docs/reference/specification/protocol/otlp/)
## 1. Minimal Flask app (products.py)
This tiny Flask application is the whole codebase used for the initial demo.
```python theme={null}
# products.py
from flask import Flask
app = Flask(__name__)
@app.route("/")
def charge():
return "Here are all of the available products"
if __name__ == "__main__":
app.run(debug=False, use_reloader=False)
```
Run it locally:
```bash theme={null}
python products.py
```
Quick verification with curl:
```bash theme={null}
curl 127.0.0.1:5000/
# Output:
Here are all of the available products
```
At this point there are no OpenTelemetry packages installed. Example `pip freeze` output (showing common packages but no OpenTelemetry):
```bash theme={null}
pip freeze
# Example output:
blinker==1.9.0
certifi==2025.8.3
charset-normalizer==3.4.3
click==8.2.1
Flask==3.1.2
idna==3.10
itsdangerous==2.2.0
Jinja2==3.1.6
MarkupSafe==3.0.2
psycopg2-binary==2.9.10
requests==2.32.5
urllib3==2.5.0
Werkzeug==3.1.3
```
Because this repository contains only `products.py` and no OpenTelemetry imports, it's a perfect candidate to demonstrate zero-code (auto) instrumentation: we will add observability without changing application source.
## 2. Install OpenTelemetry distro and bootstrap instrumentation
Install the OpenTelemetry distro and the OTLP exporter, then let the bootstrapper add matching instrumentation libraries for installed packages:
```bash theme={null}
pip install opentelemetry-distro opentelemetry-exporter-otlp
opentelemetry-bootstrap -a install
```
What the bootstrap command does:
* Scans installed packages in the environment (e.g., Flask, requests, psycopg).
* Installs `opentelemetry-instrumentation-*` packages that correspond to detected libraries (for example `opentelemetry-instrumentation-flask`, `opentelemetry-instrumentation-requests`, `opentelemetry-instrumentation-psycopg2`).
You should see output naming the installed instrumentation packages:
```text theme={null}
Successfully installed opentelemetry-instrumentation-flask-0.57b0 opentelemetry-instrumentation-urllib3-0.57b0
```
## 3. Run the app with the OpenTelemetry auto-instrumentation tool
There are two equivalent ways to configure auto-instrumentation:
* Pass configuration as CLI flags to `opentelemetry-instrument`.
* Set `OTEL_` environment variables and run `opentelemetry-instrument` without flags.
Compare the two approaches:
| Configuration method | Example usage | Notes |
| --------------------- | --------------------------------------------------------------------------------------------------------------------------------------------------------------------------------------------------------------------------------------------------------------------------: | --------------------------------------------------------------------------------------------------------- |
| CLI flags | `opentelemetry-instrument --traces_exporter console,otlp --metrics_exporter console --service_name products-service --exporter_otlp_endpoint http://localhost:4318 python products.py` | Flags can be convenient for one-off runs. |
| Environment variables | `export OTEL_SERVICE_NAME=products-service`
`export OTEL_TRACES_EXPORTER=console,otlp`
`export OTEL_METRICS_EXPORTER=console`
`export OTEL_EXPORTER_OTLP_TRACES_ENDPOINT=http://localhost:4318/v1/traces`
`opentelemetry-instrument python products.py` | Use env vars for reproducible deployments or containerized apps. See note about OTLP HTTP endpoint below. |
When configuring OTLP over HTTP via environment variables, include the full path `.../v1/traces` (for traces). The CLI flag `--exporter_otlp_endpoint` may accept a host-only value and append the proper path automatically, but the environment variable `OTEL_EXPORTER_OTLP_TRACES_ENDPOINT` typically must include the full `http://:/v1/traces` URL.
### Example: instrumenting and generating a trace (products)
Start the instrumented app using CLI flags (console exporter prints spans to stdout and OTLP forwards to the configured endpoint):
```bash theme={null}
opentelemetry-instrument \
--traces_exporter console,otlp \
--metrics_exporter console \
--service_name products-service \
--exporter_otlp_endpoint http://localhost:4318 \
python products.py
```
Generate a request:
```bash theme={null}
curl 127.0.0.1:5000/
# Response:
Here are all of the available products
```
The console exporter will emit JSON representations of spans. Representative (shortened) span output:
```json theme={null}
{
"name": "GET /",
"context": {
"trace_id": "0x2be0962ba5391c2e8255ba691123dd02",
"span_id": "0x6315774311f175e3",
"trace_state": ""
},
"kind": "SpanKind.SERVER",
"parent_id": null,
"start_time": "2025-09-10T01:05:15.588182Z",
"end_time": "2025-09-10T01:05:15.589007Z",
"status": { "status_code": "UNSET" },
"attributes": {
"http.method": "GET",
"http.server_name": "127.0.0.1",
"http.scheme": "http",
"http.host": "127.0.0.1:5000",
"http.target": "/",
"net.peer.ip": "127.0.0.1",
"http.user_agent": "curl/8.7.1",
"http.flavor": "1.1",
"http.route": "/",
"http.status_code": 200
},
"resource": {
"attributes": { "telemetry.sdk.language": "python" }
}
}
```
This trace shows the route, trace ID, span ID, span kind, start/end times and several automatically-added attributes provided by the Flask instrumentation package.
If you export to a backend such as Jaeger (via an OpenTelemetry Collector or an OTLP receiver forwarding to Jaeger), you can view traces in the Jaeger UI:
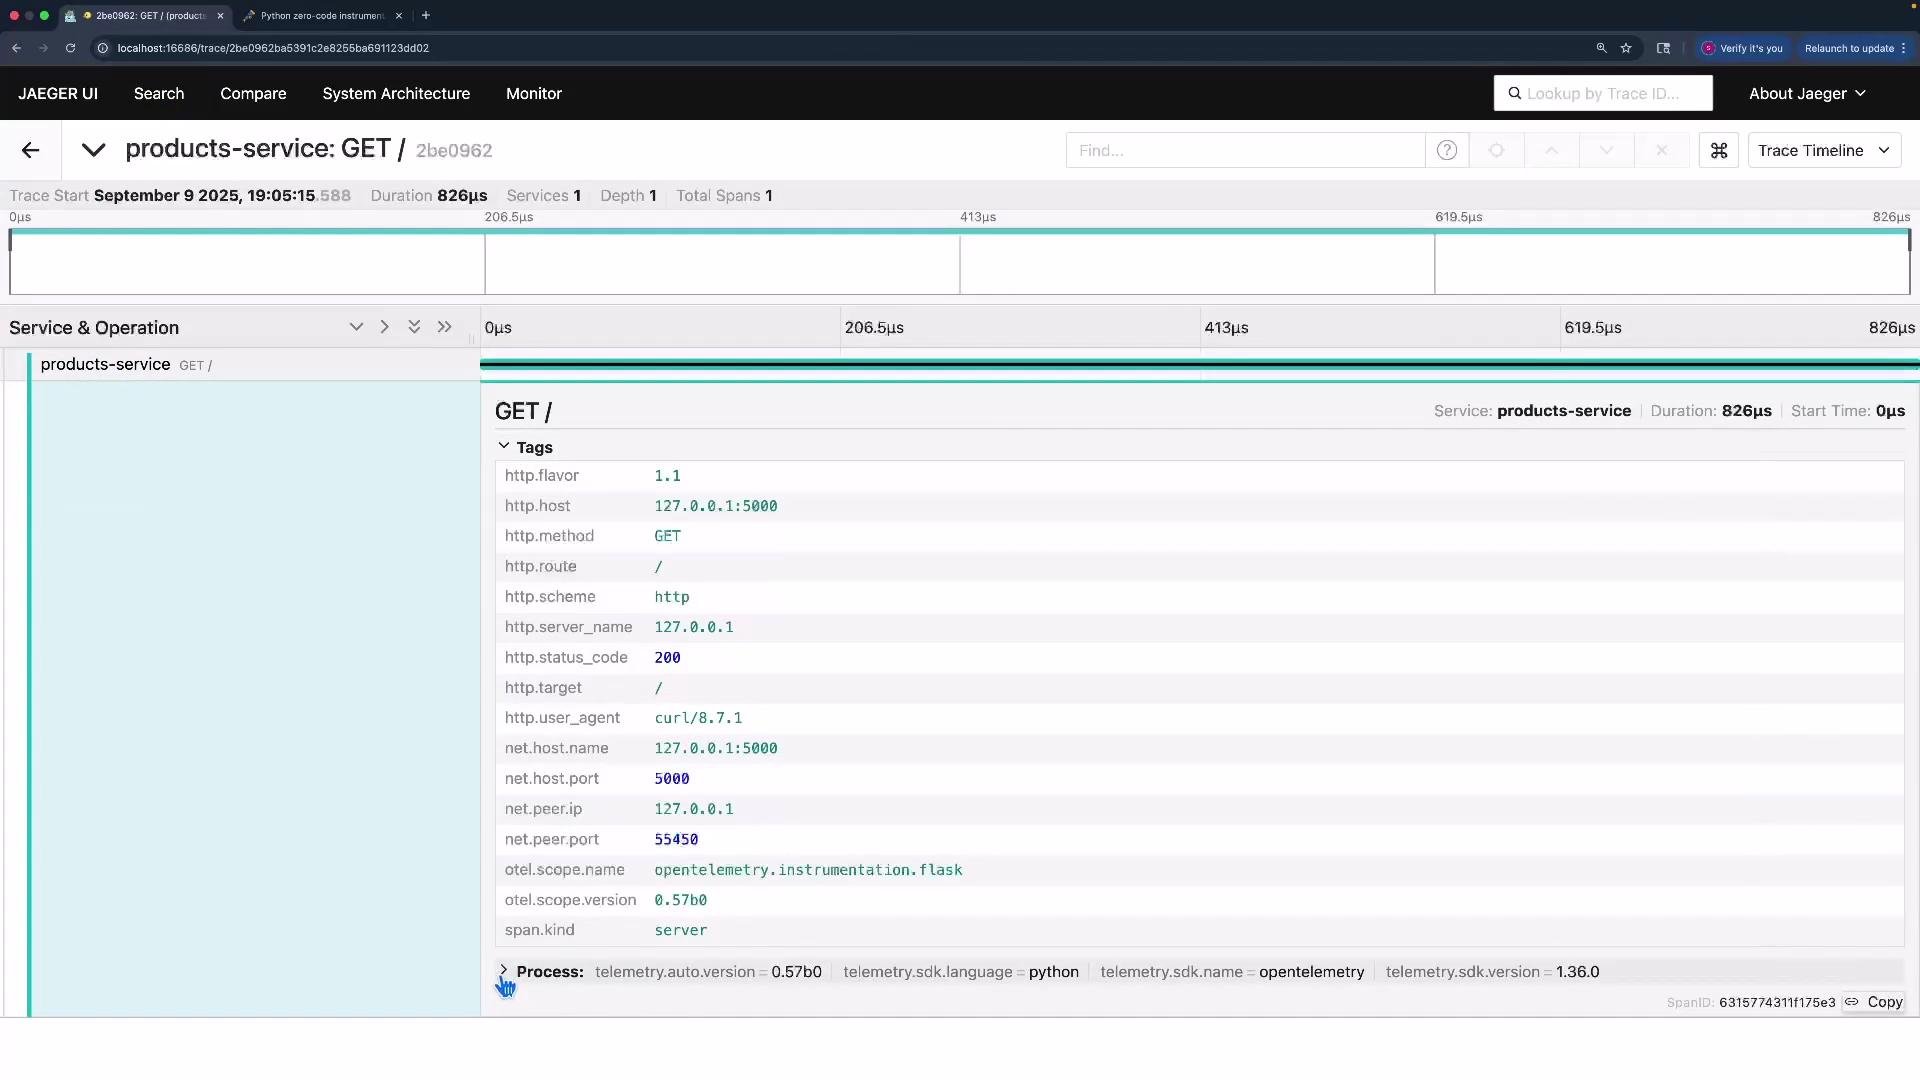 All telemetry above was produced automatically by the Flask instrumentation package that `opentelemetry-bootstrap -a install` added—no changes to `products.py` were required.
## 4. Configure with environment variables (example)
A concise env-var example:
```bash theme={null}
export OTEL_SERVICE_NAME=products-service
export OTEL_TRACES_EXPORTER=console,otlp
export OTEL_METRICS_EXPORTER=console
# Include /v1/traces when using env var for OTLP HTTP traces endpoint:
export OTEL_EXPORTER_OTLP_TRACES_ENDPOINT=http://localhost:4318/v1/traces
opentelemetry-instrument python products.py
```
Verify environment variables:
```bash theme={null}
printenv | grep -i OTEL
# Example:
OTEL_EXPORTER_OTLP_TRACES_PROTOCOL=http/protobuf
OTEL_SERVICE_NAME=products-service
OTEL_TRACES_EXPORTER=console,otlp
OTEL_METRICS_EXPORTER=console
OTEL_EXPORTER_OTLP_TRACES_ENDPOINT=http://localhost:4318/v1/traces
```
If `OTEL_EXPORTER_OTLP_TRACES_ENDPOINT` omits `/v1/traces`, you may observe export failures such as "failed to export span batch" or HTTP 404/400 responses from the OTLP HTTP receiver. Including `/v1/traces` typically resolves that issue.
## 5. Demonstration: a slightly more complex app (crypto.py)
Next, we instrument a slightly richer example that uses Flask, requests, and psycopg2. Because instrumentation packages for these libraries are available and were installed by the bootstrap step, the application is auto-instrumented without source changes.
Representative excerpts from `crypto.py`:
```python theme={null}
# crypto.py (excerpts)
from flask import Flask
import requests
import psycopg2
import pprint
from datetime import datetime
DB_CONFIG = {
"dbname": "crypto",
"user": "postgres",
"password": "postgres",
"host": "localhost",
"port": 5432,
}
CMC_API_KEY = "YOUR_COINMARKETCAP_API_KEY"
CMC_URL = "https://pro-api.coinmarketcap.com/v2/cryptocurrency/quotes/latest"
```
Flask route:
```python theme={null}
app = Flask(__name__)
@app.route("/price")
def charge():
price = fetch_bitcoin_price()
store_price_in_db(price)
return {"data": price}
if __name__ == "__main__":
app.run(debug=False, use_reloader=False)
```
Fetch current Bitcoin price (HTTP call via requests):
```python theme={null}
def fetch_bitcoin_price():
url = CMC_URL
params = {"symbol": "BTC"}
headers = {
"Accepts": "application/json",
"X-CMC_PRO_API_KEY": CMC_API_KEY,
}
response = requests.get(url, params=params, headers=headers)
response.raise_for_status()
data = response.json()
btc_data = data["data"]["BTC"]
if not btc_data:
raise ValueError("No BTC data found")
# Extract numeric price in USD from returned structure (example key)
price = btc_data["quote"]["USD"]["price"]
return price
```
Store the price in PostgreSQL (psycopg2):
```python theme={null}
def store_price_in_db(price):
conn = psycopg2.connect(**DB_CONFIG)
cursor = conn.cursor()
cursor.execute("""
CREATE TABLE IF NOT EXISTS bitcoin_prices (
id SERIAL PRIMARY KEY,
price_usd NUMERIC,
fetched_at TIMESTAMP DEFAULT CURRENT_TIMESTAMP
);
""")
cursor.execute(
"INSERT INTO bitcoin_prices (price_usd, fetched_at) VALUES (%s, %s)",
(price, datetime.utcnow())
)
conn.commit()
cursor.close()
conn.close()
print(f"Stored Bitcoin price ${price} in database.")
```
Because Flask, requests, and psycopg2 were instrumented by the bootstrap step, running this application with `opentelemetry-instrument` captures multiple spans in a single trace:
* Incoming Flask server span (HTTP server).
* Outgoing HTTP client span (requests → CoinMarketCap).
* Database spans for SQL statements (psycopg2) with `db.*` semantic attributes.
Run the instrumented crypto app:
```bash theme={null}
opentelemetry-instrument \
--traces_exporter console,otlp \
--metrics_exporter console \
--service_name crypto-service \
--exporter_otlp_endpoint http://localhost:4318 \
python crypto.py
```
Trigger the endpoint:
```bash theme={null}
curl 127.0.0.1:5000/price
# Example JSON response:
{"data": 111084.935888223}
```
Inspect the trace in Jaeger or another OTLP-compatible backend to see the Flask server span, the outgoing HTTP span to `pro-api.coinmarketcap.com`, and DB spans showing executed SQL statements.
All telemetry above was produced automatically by the Flask instrumentation package that `opentelemetry-bootstrap -a install` added—no changes to `products.py` were required.
## 4. Configure with environment variables (example)
A concise env-var example:
```bash theme={null}
export OTEL_SERVICE_NAME=products-service
export OTEL_TRACES_EXPORTER=console,otlp
export OTEL_METRICS_EXPORTER=console
# Include /v1/traces when using env var for OTLP HTTP traces endpoint:
export OTEL_EXPORTER_OTLP_TRACES_ENDPOINT=http://localhost:4318/v1/traces
opentelemetry-instrument python products.py
```
Verify environment variables:
```bash theme={null}
printenv | grep -i OTEL
# Example:
OTEL_EXPORTER_OTLP_TRACES_PROTOCOL=http/protobuf
OTEL_SERVICE_NAME=products-service
OTEL_TRACES_EXPORTER=console,otlp
OTEL_METRICS_EXPORTER=console
OTEL_EXPORTER_OTLP_TRACES_ENDPOINT=http://localhost:4318/v1/traces
```
If `OTEL_EXPORTER_OTLP_TRACES_ENDPOINT` omits `/v1/traces`, you may observe export failures such as "failed to export span batch" or HTTP 404/400 responses from the OTLP HTTP receiver. Including `/v1/traces` typically resolves that issue.
## 5. Demonstration: a slightly more complex app (crypto.py)
Next, we instrument a slightly richer example that uses Flask, requests, and psycopg2. Because instrumentation packages for these libraries are available and were installed by the bootstrap step, the application is auto-instrumented without source changes.
Representative excerpts from `crypto.py`:
```python theme={null}
# crypto.py (excerpts)
from flask import Flask
import requests
import psycopg2
import pprint
from datetime import datetime
DB_CONFIG = {
"dbname": "crypto",
"user": "postgres",
"password": "postgres",
"host": "localhost",
"port": 5432,
}
CMC_API_KEY = "YOUR_COINMARKETCAP_API_KEY"
CMC_URL = "https://pro-api.coinmarketcap.com/v2/cryptocurrency/quotes/latest"
```
Flask route:
```python theme={null}
app = Flask(__name__)
@app.route("/price")
def charge():
price = fetch_bitcoin_price()
store_price_in_db(price)
return {"data": price}
if __name__ == "__main__":
app.run(debug=False, use_reloader=False)
```
Fetch current Bitcoin price (HTTP call via requests):
```python theme={null}
def fetch_bitcoin_price():
url = CMC_URL
params = {"symbol": "BTC"}
headers = {
"Accepts": "application/json",
"X-CMC_PRO_API_KEY": CMC_API_KEY,
}
response = requests.get(url, params=params, headers=headers)
response.raise_for_status()
data = response.json()
btc_data = data["data"]["BTC"]
if not btc_data:
raise ValueError("No BTC data found")
# Extract numeric price in USD from returned structure (example key)
price = btc_data["quote"]["USD"]["price"]
return price
```
Store the price in PostgreSQL (psycopg2):
```python theme={null}
def store_price_in_db(price):
conn = psycopg2.connect(**DB_CONFIG)
cursor = conn.cursor()
cursor.execute("""
CREATE TABLE IF NOT EXISTS bitcoin_prices (
id SERIAL PRIMARY KEY,
price_usd NUMERIC,
fetched_at TIMESTAMP DEFAULT CURRENT_TIMESTAMP
);
""")
cursor.execute(
"INSERT INTO bitcoin_prices (price_usd, fetched_at) VALUES (%s, %s)",
(price, datetime.utcnow())
)
conn.commit()
cursor.close()
conn.close()
print(f"Stored Bitcoin price ${price} in database.")
```
Because Flask, requests, and psycopg2 were instrumented by the bootstrap step, running this application with `opentelemetry-instrument` captures multiple spans in a single trace:
* Incoming Flask server span (HTTP server).
* Outgoing HTTP client span (requests → CoinMarketCap).
* Database spans for SQL statements (psycopg2) with `db.*` semantic attributes.
Run the instrumented crypto app:
```bash theme={null}
opentelemetry-instrument \
--traces_exporter console,otlp \
--metrics_exporter console \
--service_name crypto-service \
--exporter_otlp_endpoint http://localhost:4318 \
python crypto.py
```
Trigger the endpoint:
```bash theme={null}
curl 127.0.0.1:5000/price
# Example JSON response:
{"data": 111084.935888223}
```
Inspect the trace in Jaeger or another OTLP-compatible backend to see the Flask server span, the outgoing HTTP span to `pro-api.coinmarketcap.com`, and DB spans showing executed SQL statements.
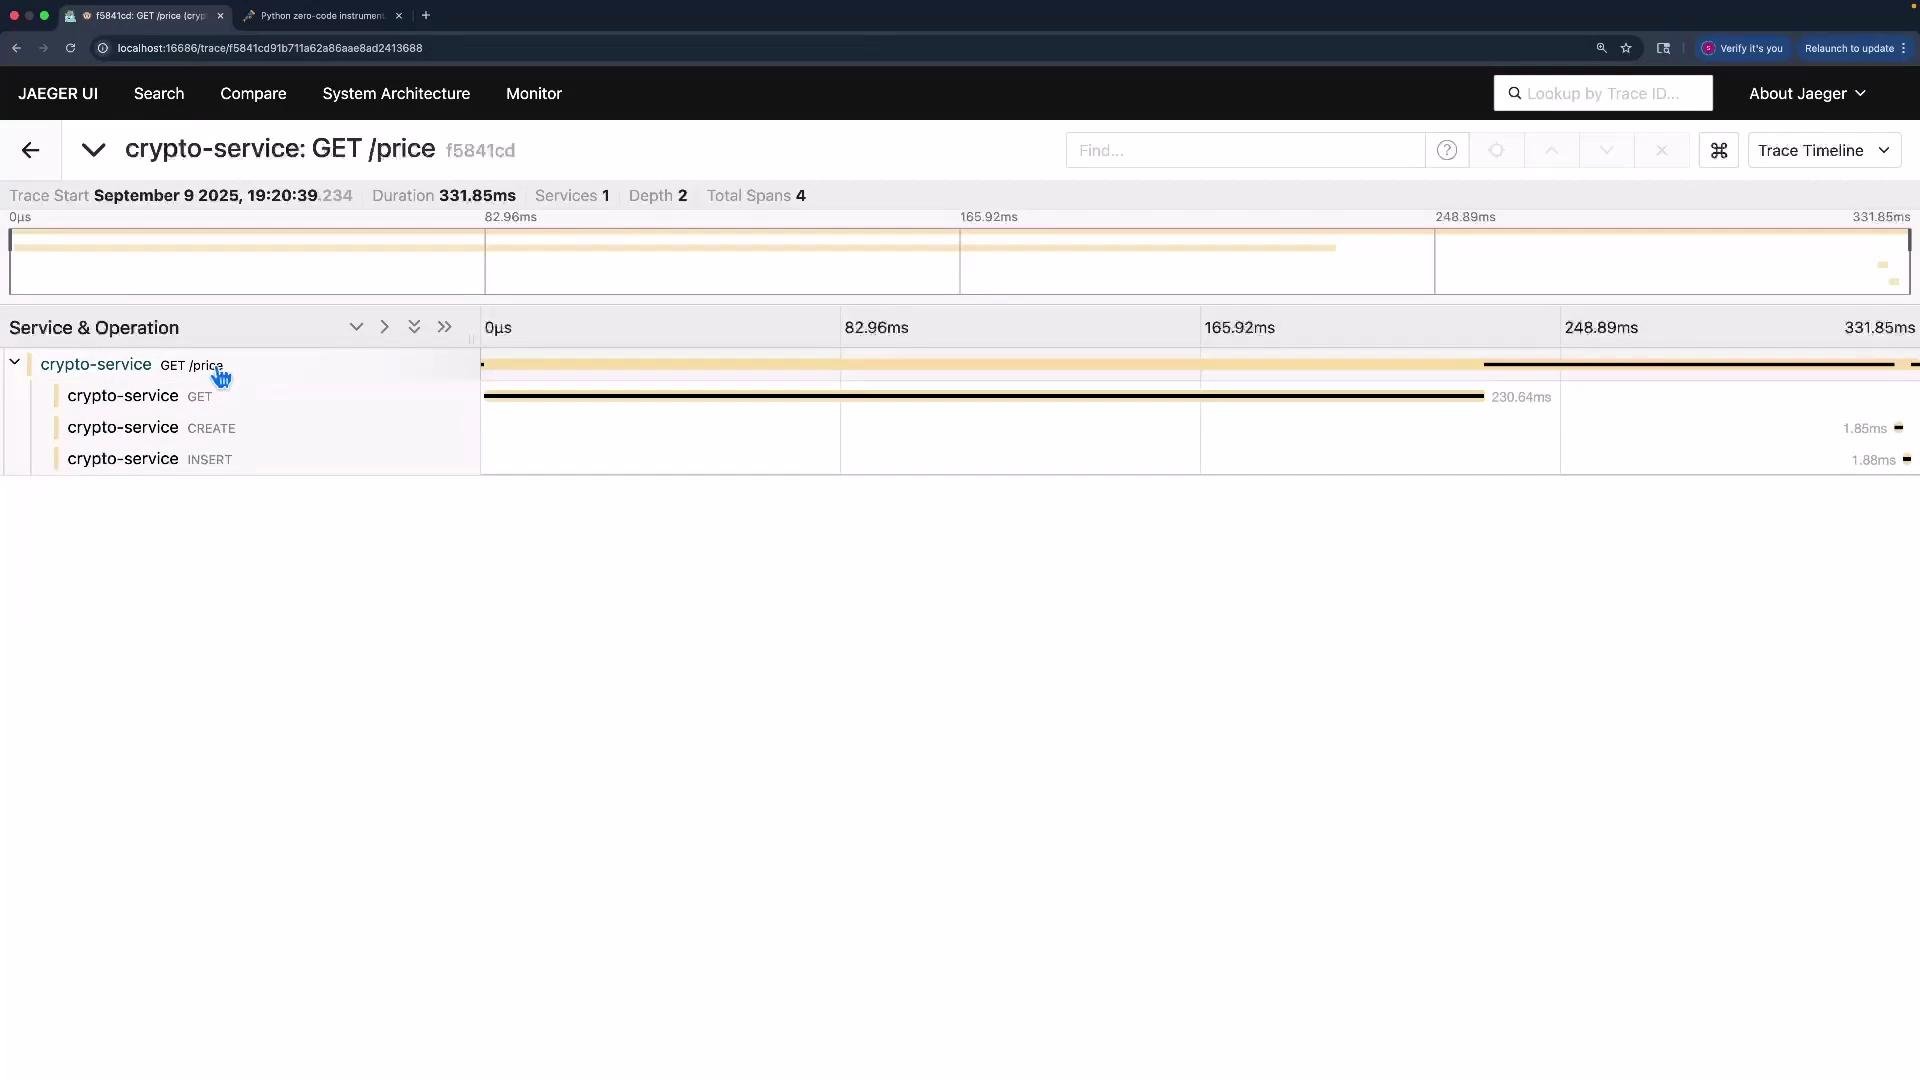 Examples of DB statements that appear as spans (captured automatically):
```sql theme={null}
CREATE TABLE IF NOT EXISTS bitcoin_prices (
id SERIAL PRIMARY KEY,
price_usd NUMERIC,
fetched_at TIMESTAMP DEFAULT CURRENT_TIMESTAMP
);
```
```sql theme={null}
INSERT INTO bitcoin_prices (price_usd, fetched_at) VALUES (%s, %s)
```
All telemetry was produced automatically by the instrumentation libraries that were added by `opentelemetry-bootstrap -a install`—no code changes to `crypto.py` were required.
## Summary & best practices
* Auto-instrumentation enables zero-code observability for supported libraries (Flask, requests, psycopg2, etc.).
* Install `opentelemetry-distro` and `opentelemetry-exporter-otlp`, then run:
* `opentelemetry-bootstrap -a install` to add matching `opentelemetry-instrumentation-*` packages.
* Run your application with `opentelemetry-instrument` using CLI flags or `OTEL_` environment variables.
* When using environment variables for OTLP HTTP traces endpoint, include `/v1/traces` in `OTEL_EXPORTER_OTLP_TRACES_ENDPOINT`.
* Exported telemetry can be sent to console for debugging or to OTLP-compatible backends (via OpenTelemetry Collector) such as Jaeger.
## Links and references
* OpenTelemetry: [https://opentelemetry.io/](https://opentelemetry.io/)
* OpenTelemetry Python distro (PyPI): [https://pypi.org/project/opentelemetry-distro/](https://pypi.org/project/opentelemetry-distro/)
* OpenTelemetry OTLP exporter (PyPI): [https://pypi.org/project/opentelemetry-exporter-otlp/](https://pypi.org/project/opentelemetry-exporter-otlp/)
* OpenTelemetry Collector: [https://opentelemetry.io/docs/collector/](https://opentelemetry.io/docs/collector/)
* Jaeger: [https://www.jaegertracing.io/](https://www.jaegertracing.io/)
* Flask: [https://palletsprojects.com/p/flask/](https://palletsprojects.com/p/flask/)
* requests: [https://docs.python-requests.org/](https://docs.python-requests.org/)
* psycopg2: [https://www.psycopg.org/](https://www.psycopg.org/)
Examples of DB statements that appear as spans (captured automatically):
```sql theme={null}
CREATE TABLE IF NOT EXISTS bitcoin_prices (
id SERIAL PRIMARY KEY,
price_usd NUMERIC,
fetched_at TIMESTAMP DEFAULT CURRENT_TIMESTAMP
);
```
```sql theme={null}
INSERT INTO bitcoin_prices (price_usd, fetched_at) VALUES (%s, %s)
```
All telemetry was produced automatically by the instrumentation libraries that were added by `opentelemetry-bootstrap -a install`—no code changes to `crypto.py` were required.
## Summary & best practices
* Auto-instrumentation enables zero-code observability for supported libraries (Flask, requests, psycopg2, etc.).
* Install `opentelemetry-distro` and `opentelemetry-exporter-otlp`, then run:
* `opentelemetry-bootstrap -a install` to add matching `opentelemetry-instrumentation-*` packages.
* Run your application with `opentelemetry-instrument` using CLI flags or `OTEL_` environment variables.
* When using environment variables for OTLP HTTP traces endpoint, include `/v1/traces` in `OTEL_EXPORTER_OTLP_TRACES_ENDPOINT`.
* Exported telemetry can be sent to console for debugging or to OTLP-compatible backends (via OpenTelemetry Collector) such as Jaeger.
## Links and references
* OpenTelemetry: [https://opentelemetry.io/](https://opentelemetry.io/)
* OpenTelemetry Python distro (PyPI): [https://pypi.org/project/opentelemetry-distro/](https://pypi.org/project/opentelemetry-distro/)
* OpenTelemetry OTLP exporter (PyPI): [https://pypi.org/project/opentelemetry-exporter-otlp/](https://pypi.org/project/opentelemetry-exporter-otlp/)
* OpenTelemetry Collector: [https://opentelemetry.io/docs/collector/](https://opentelemetry.io/docs/collector/)
* Jaeger: [https://www.jaegertracing.io/](https://www.jaegertracing.io/)
* Flask: [https://palletsprojects.com/p/flask/](https://palletsprojects.com/p/flask/)
* requests: [https://docs.python-requests.org/](https://docs.python-requests.org/)
* psycopg2: [https://www.psycopg.org/](https://www.psycopg.org/)