> ## Documentation Index
> Fetch the complete documentation index at: https://notes.kodekloud.com/llms.txt
> Use this file to discover all available pages before exploring further.
# OpenTelemetry Instrumentation Approaches
> Overview of OpenTelemetry instrumentation approaches including manual, library-based, and auto-instrumentation, how to create custom spans, evaluate trade-offs, and practical recommendations for application observability
This lesson explains the primary OpenTelemetry instrumentation approaches, when to use each, and how to create custom spans with the OpenTelemetry API. You'll learn how to instrument applications for traces, metrics, and logs to gain visibility into performance and reliability.
By the end of this section you should be able to:
* Distinguish manual, automatic, and library-based instrumentation and know when to use each.
* Create custom spans using the OpenTelemetry API.
* Enable auto-instrumentation for applications without source-code changes (with minimal setup).
* Use instrumentation libraries for common frameworks and evaluate trade-offs between approaches.
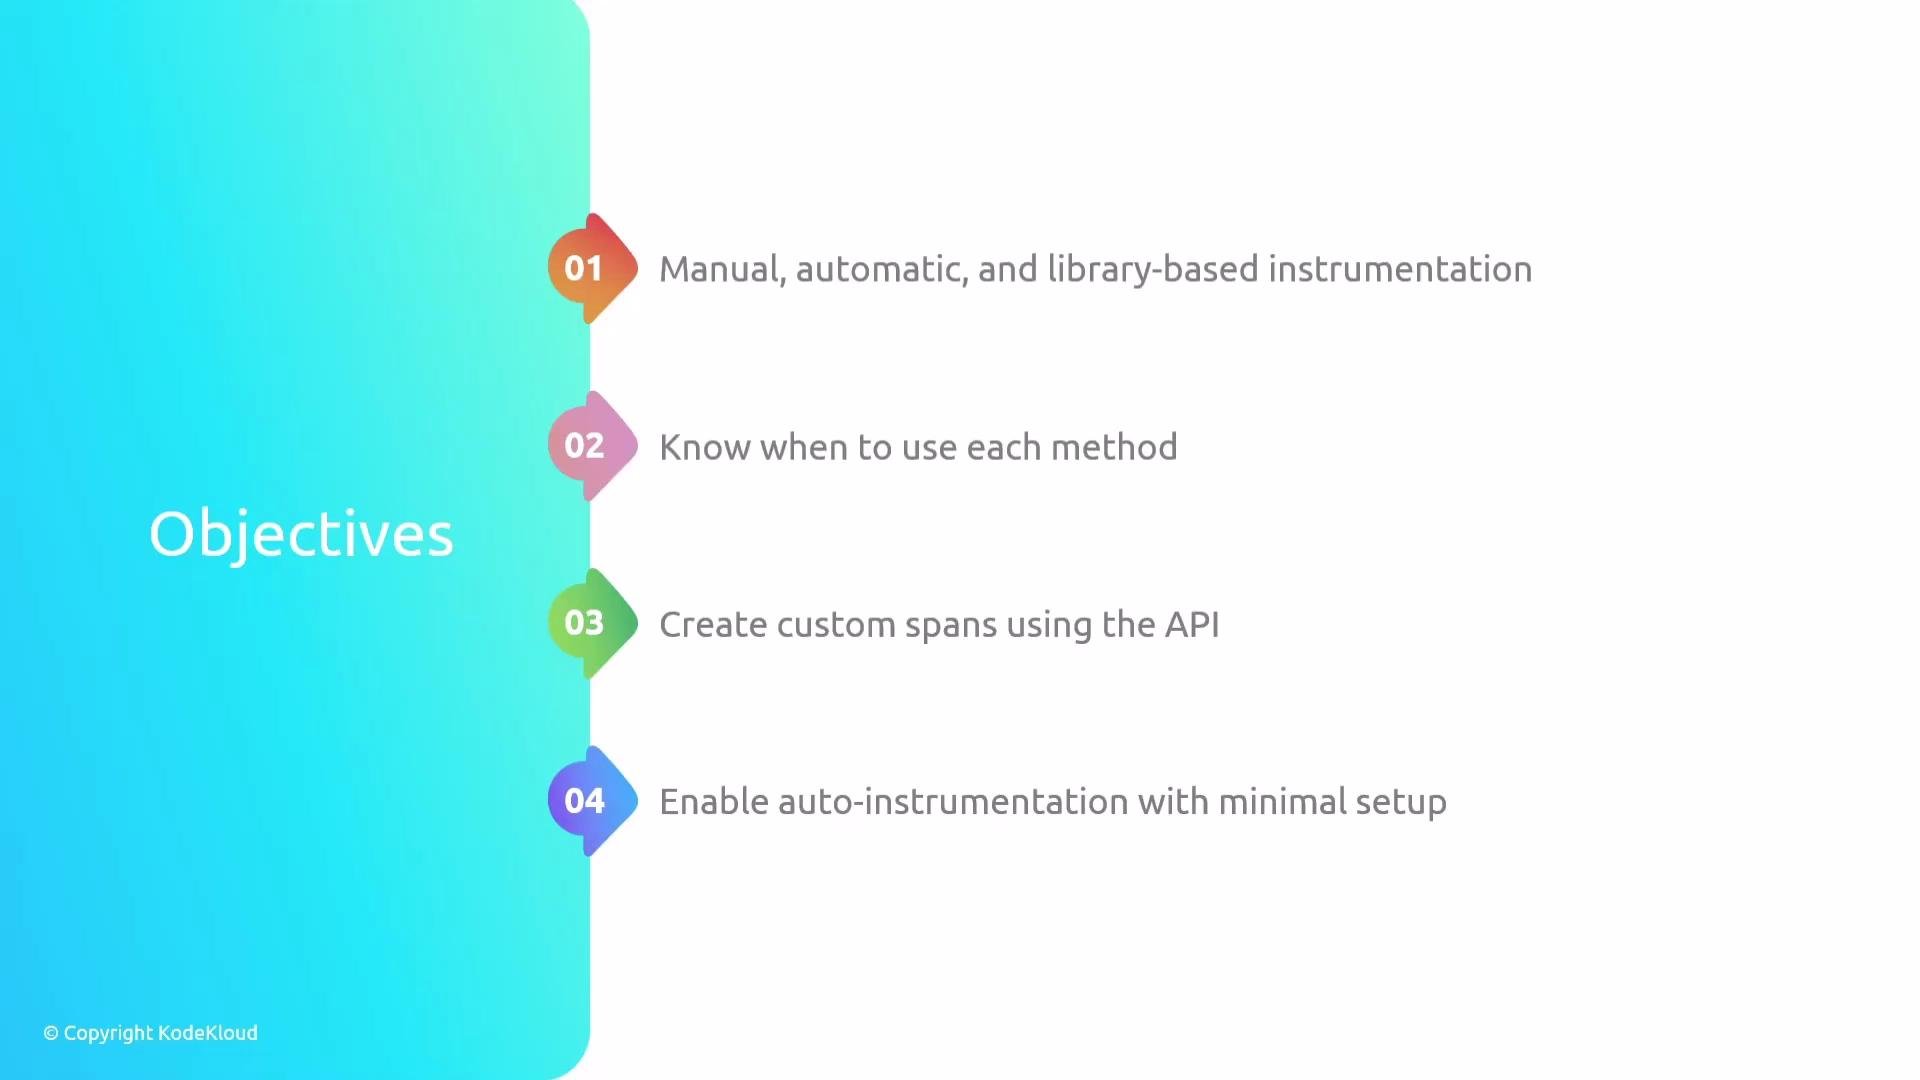 You should also be able to decide when to adopt library-based instrumentation for frameworks you commonly use, and weigh trade-offs such as control, effort, and setup speed.
 ## What is instrumentation?
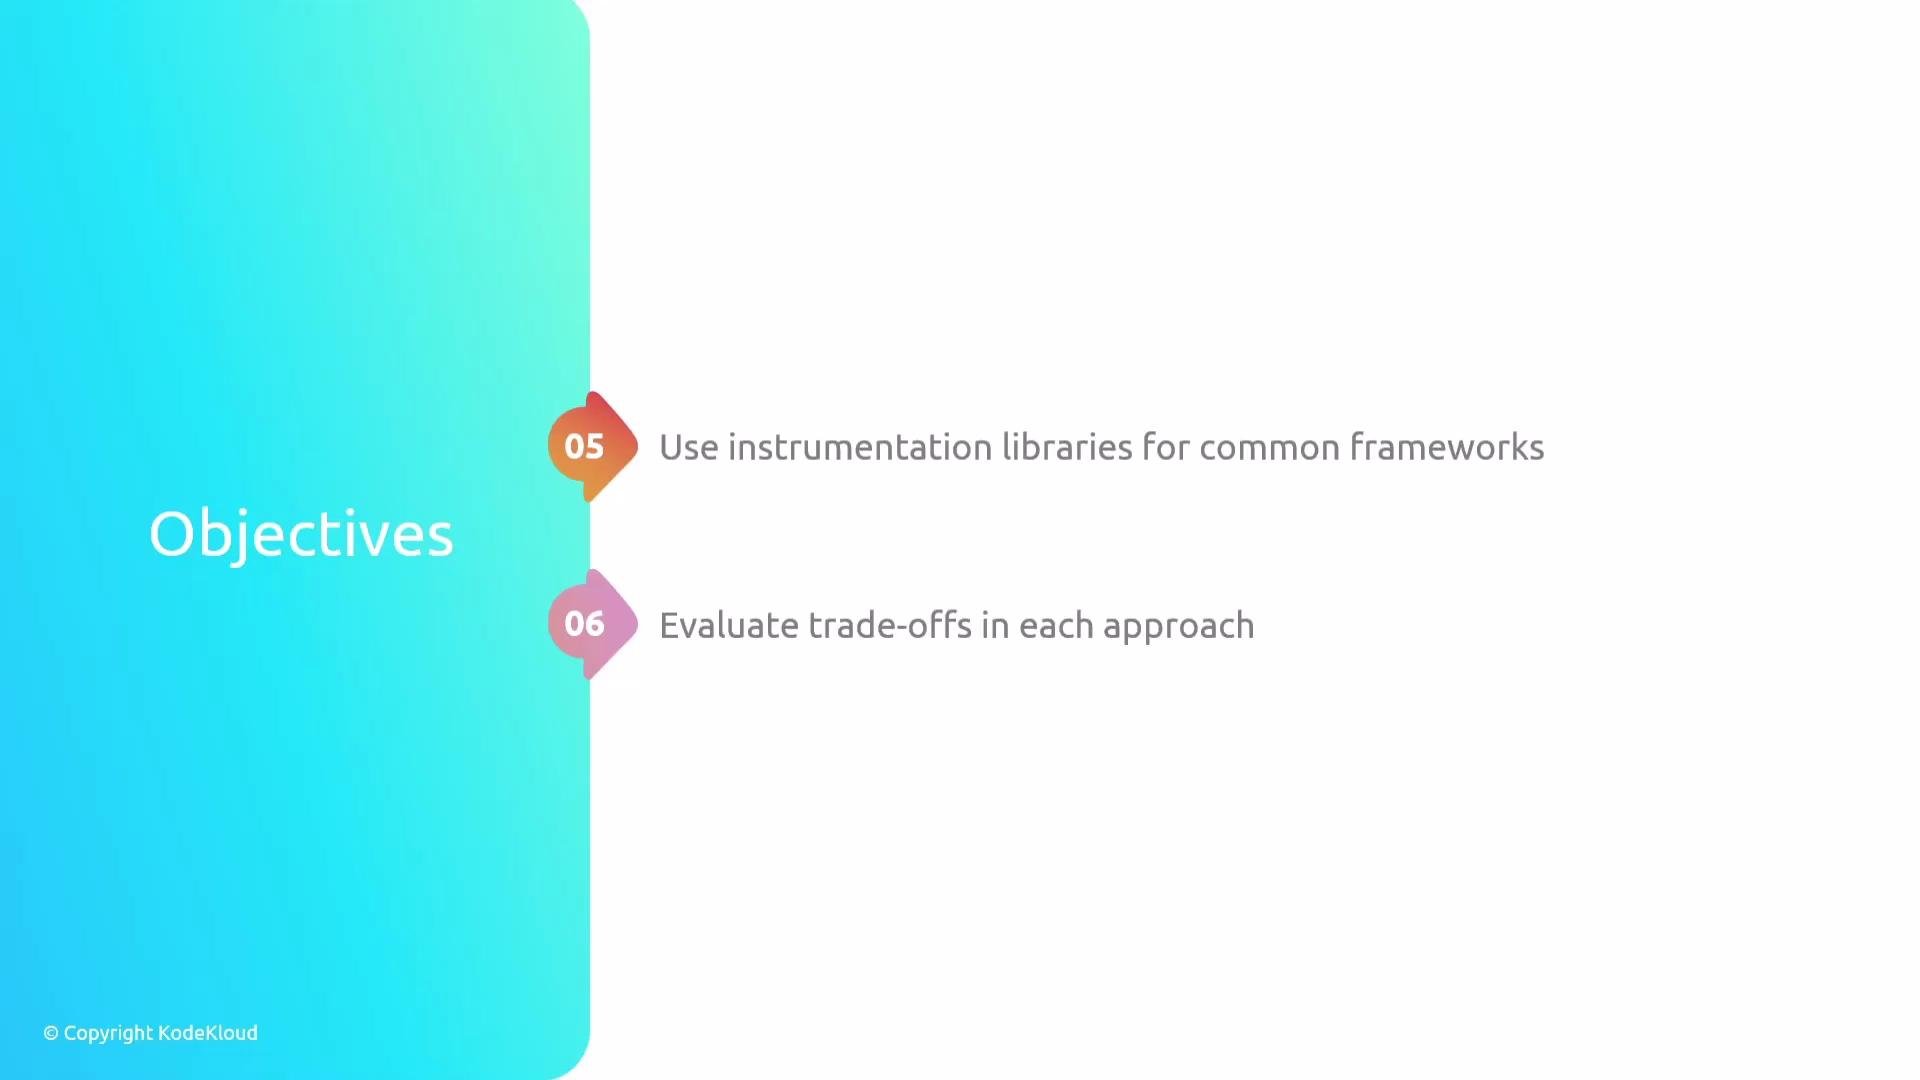
Instrumentation is the practice of adding code or runtime tooling that generates telemetry—traces, metrics, and logs—so you can observe application behavior. Think of instrumentation like installing meters or probes in a system: it enables measurement and helps you understand how components perform and interact.
## What is instrumentation?
Instrumentation is the practice of adding code or runtime tooling that generates telemetry—traces, metrics, and logs—so you can observe application behavior. Think of instrumentation like installing meters or probes in a system: it enables measurement and helps you understand how components perform and interact.
 ## Why instrumentation matters
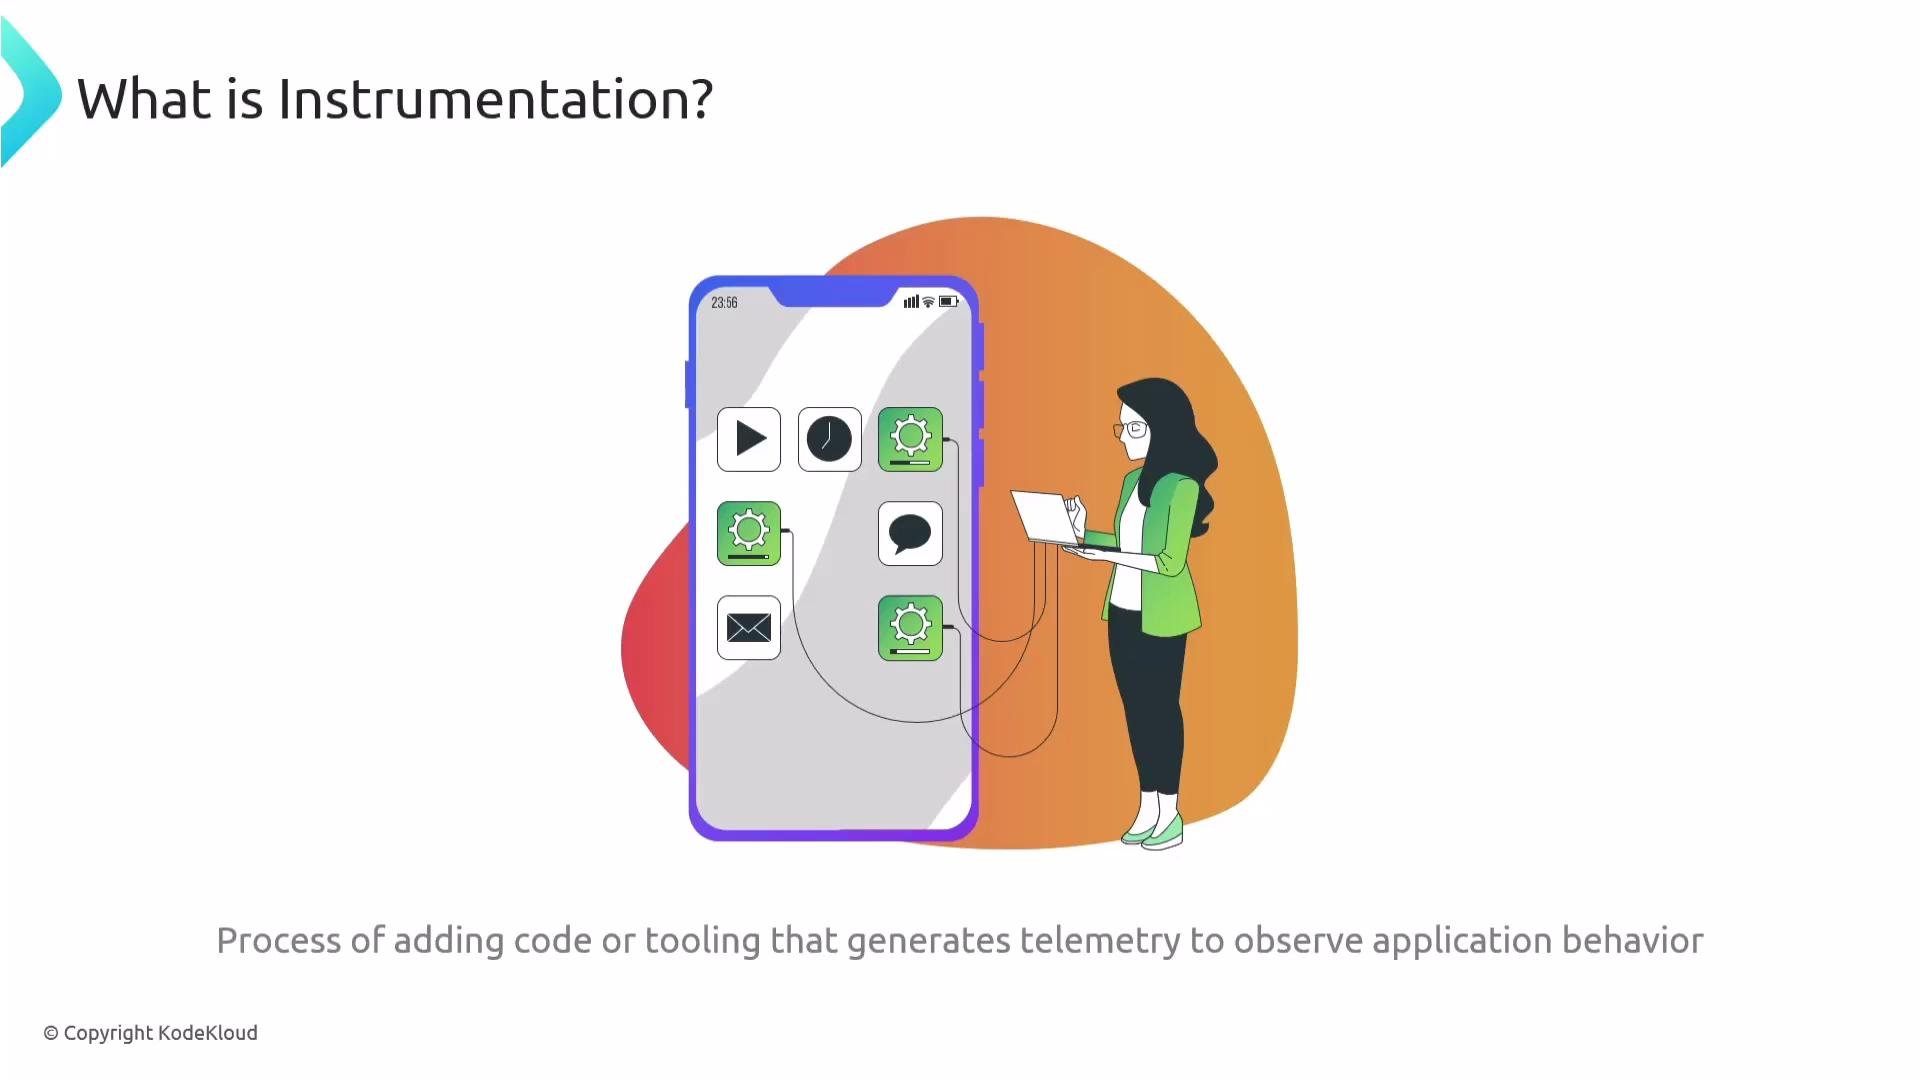
Instrumentation provides the visibility required for diagnosing performance issues, improving reliability, and automating operational responses. Without instrumentation, troubleshooting becomes guesswork—similar to trying to manage electricity usage without meters. Instrumentation is essential in production, but also valuable during development and testing.
## Why instrumentation matters
Instrumentation provides the visibility required for diagnosing performance issues, improving reliability, and automating operational responses. Without instrumentation, troubleshooting becomes guesswork—similar to trying to manage electricity usage without meters. Instrumentation is essential in production, but also valuable during development and testing.
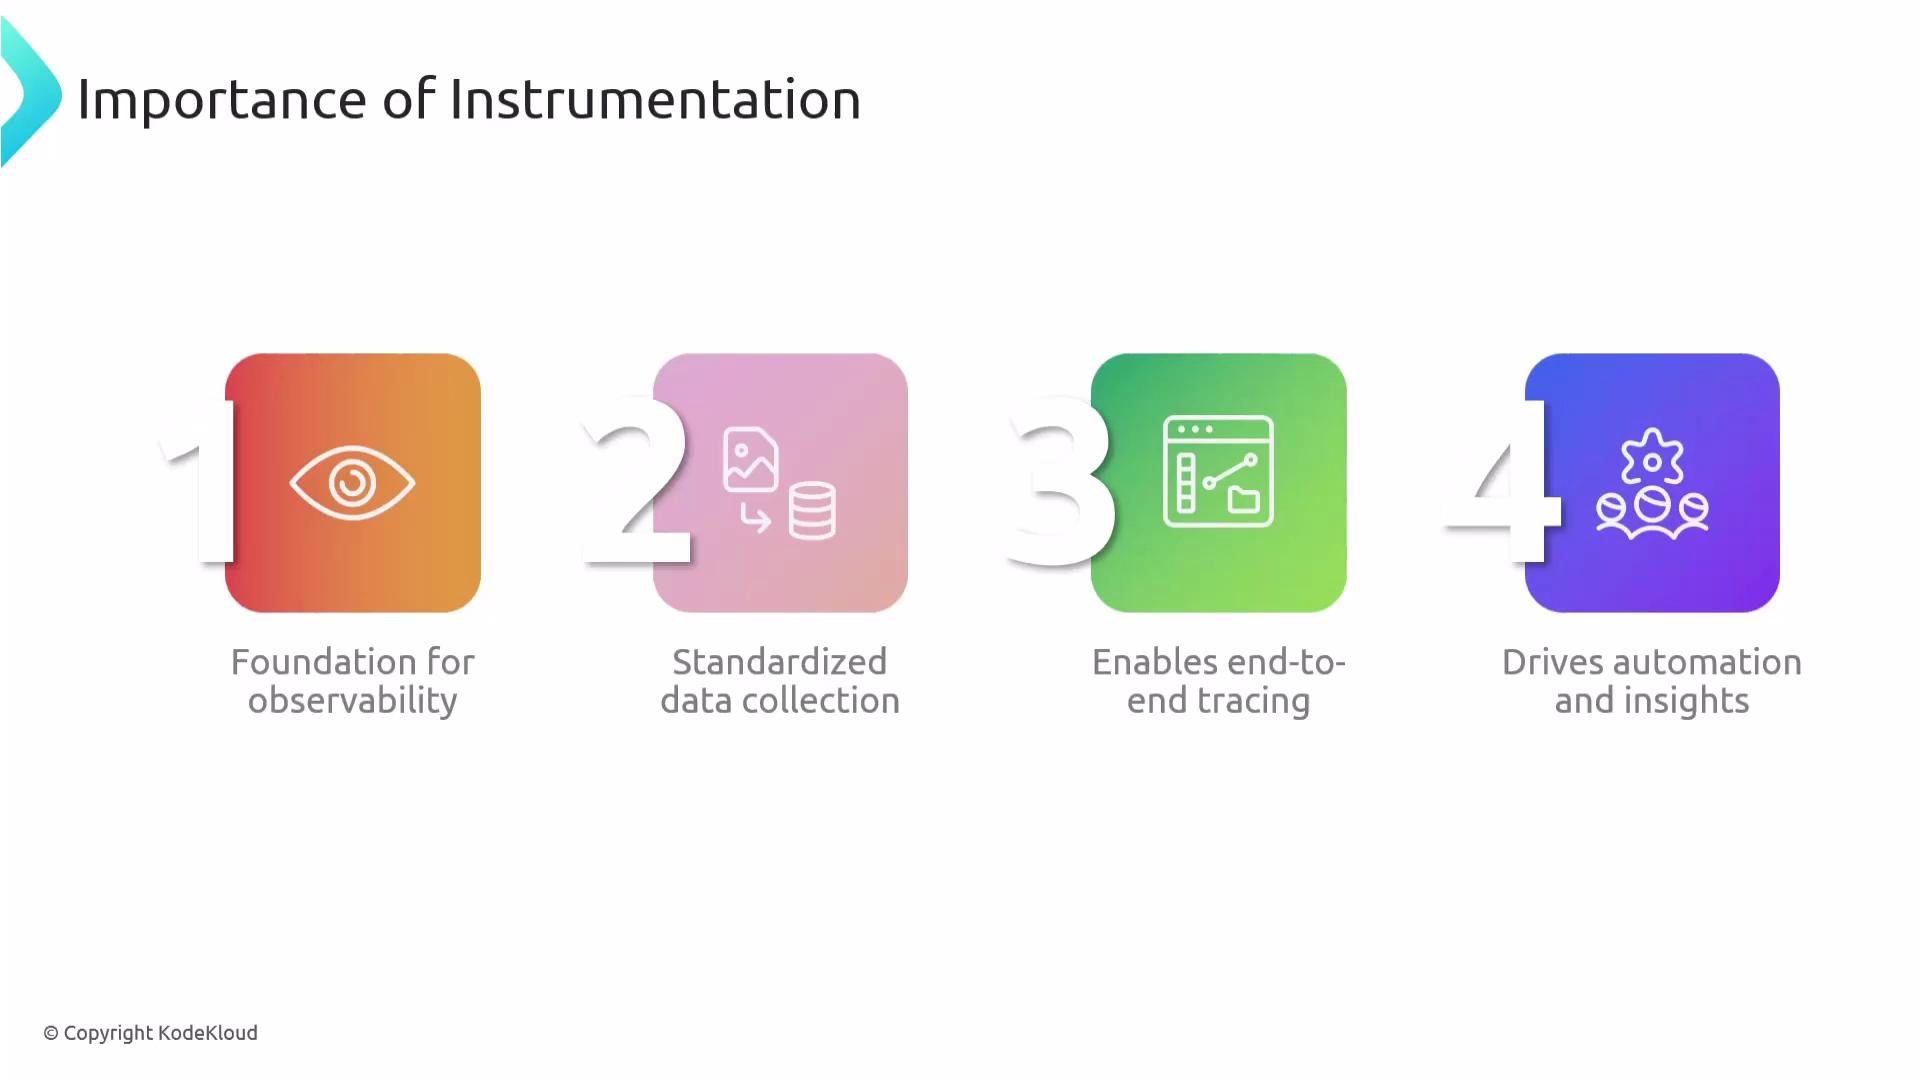
 Instrumentation is the foundation for observability: it standardizes how telemetry is collected, enables end-to-end tracing of requests, and unlocks automation and actionable insights.
 ## Three main instrumentation approaches
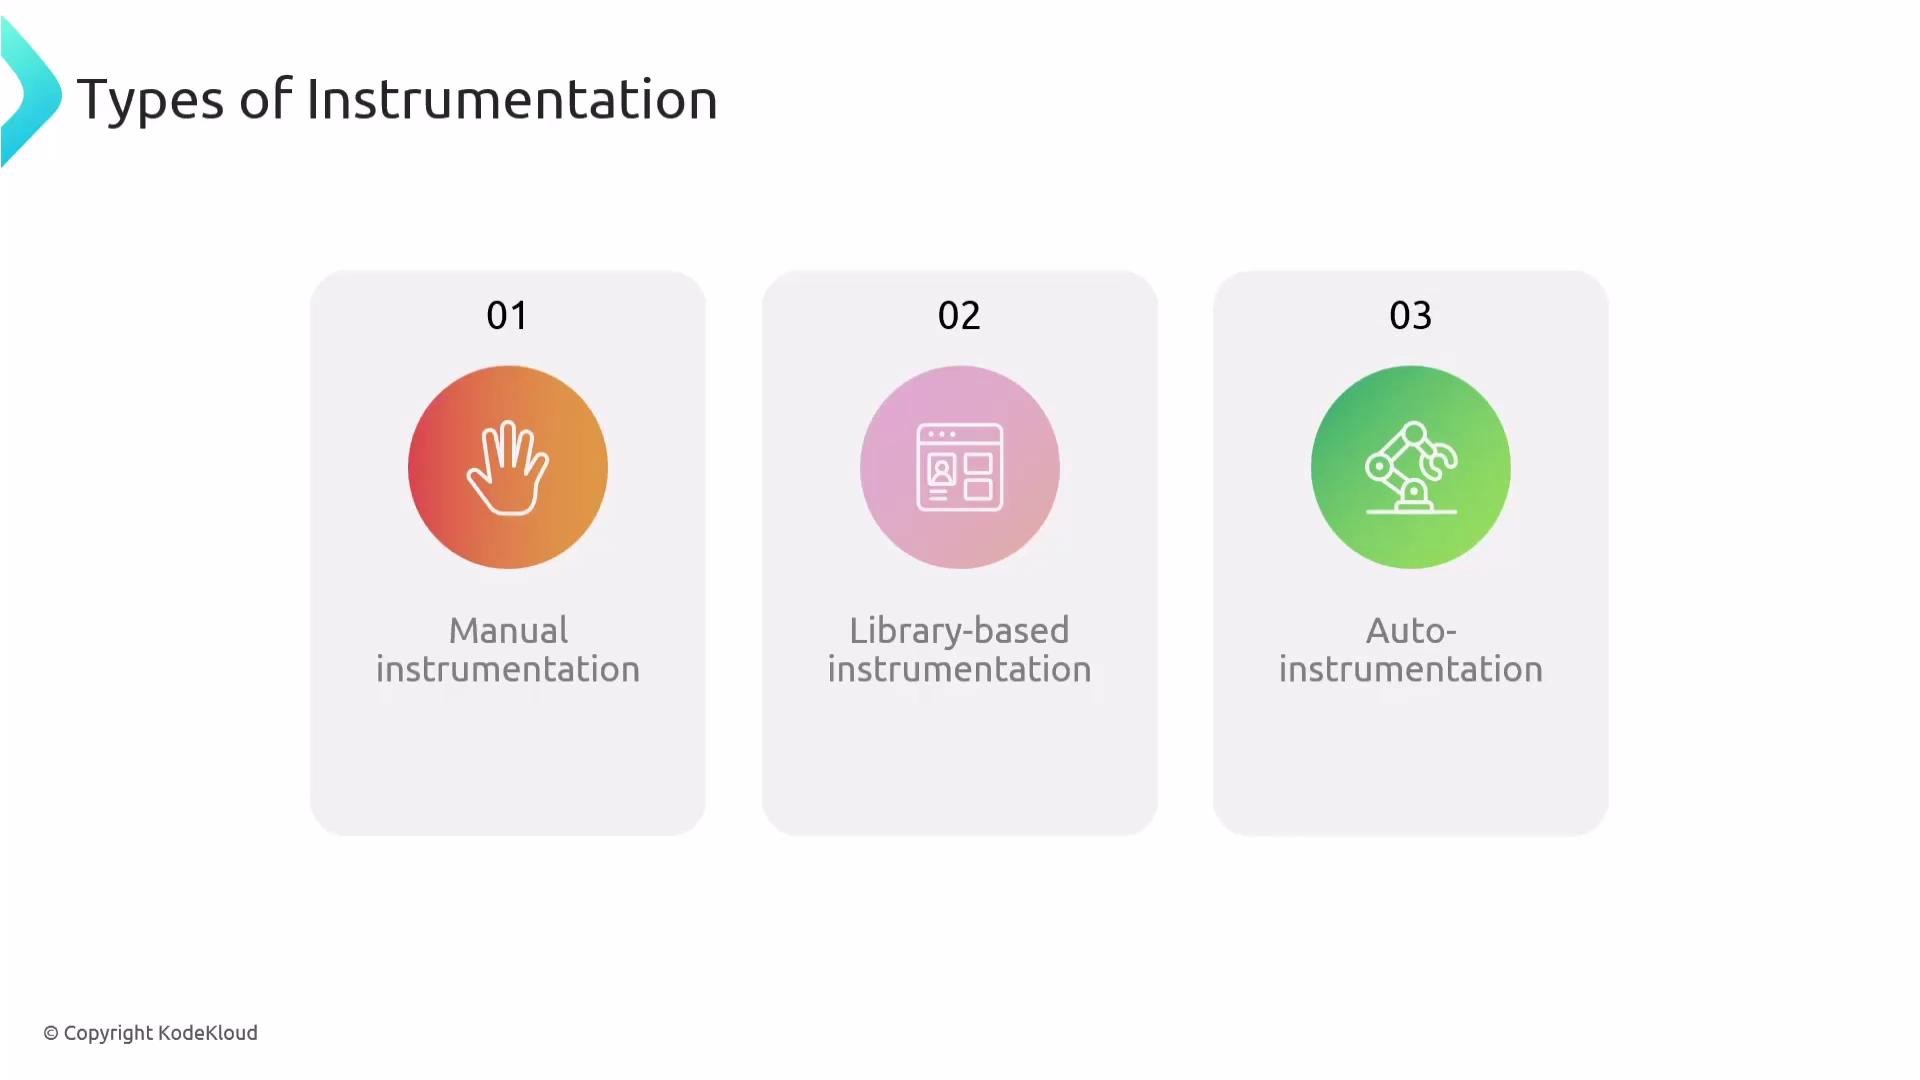
1. Manual (code-based) instrumentation
* Developers add explicit OpenTelemetry API calls in application code to create spans, attributes, events, and links.
* Offers the most control and flexibility for custom business logic and fine-grained traces, but requires developer effort and ongoing maintenance.
2. Library-based instrumentation
* Uses framework- or library-specific packages (instrumentation libraries) that hook into common operations (HTTP servers/clients, database drivers, messaging libraries) to produce spans automatically.
* Requires access to the codebase to add libraries but reduces the need to implement per-operation spans manually.
3. Auto-instrumentation (zero-code changes)
* Uses agents, sidecars, or runtime wrappers to instrument applications at runtime without modifying source code.
* No source changes required; typically involves adding a JVM agent, language runtime wrapper, or a container sidecar/startup flag.
## Three main instrumentation approaches
1. Manual (code-based) instrumentation
* Developers add explicit OpenTelemetry API calls in application code to create spans, attributes, events, and links.
* Offers the most control and flexibility for custom business logic and fine-grained traces, but requires developer effort and ongoing maintenance.
2. Library-based instrumentation
* Uses framework- or library-specific packages (instrumentation libraries) that hook into common operations (HTTP servers/clients, database drivers, messaging libraries) to produce spans automatically.
* Requires access to the codebase to add libraries but reduces the need to implement per-operation spans manually.
3. Auto-instrumentation (zero-code changes)
* Uses agents, sidecars, or runtime wrappers to instrument applications at runtime without modifying source code.
* No source changes required; typically involves adding a JVM agent, language runtime wrapper, or a container sidecar/startup flag.
 ### When to use each approach
* Manual instrumentation
* Use when you need full control or must capture business-specific operations and context that automatic tools cannot infer.
* Library-based instrumentation
* Use when your framework is supported by instrumentation libraries and you want broad coverage with moderate implementation effort.
* Auto-instrumentation
* Use when you cannot modify source code (e.g., legacy apps) or when you need rapid coverage across many services with minimal developer time.
Auto-instrumentation still requires deployment or runtime changes (for example adding a JVM agent or language-specific runtime hook). It does not require source code edits, but it does require configuring the runtime or deploying an agent/sidecar.
## Example: creating custom spans (manual instrumentation)
Below is a concise Python example demonstrating manual instrumentation with the OpenTelemetry API. It shows how to configure a tracer provider, add a console exporter, and create nested spans (parent and child). This pattern maps to other languages: initialize a tracer provider/exporter, then use the tracer API to start spans and add attributes, events, or links.
```python theme={null}
from opentelemetry import trace
from opentelemetry.sdk.trace import TracerProvider
from opentelemetry.sdk.trace.export import SimpleSpanProcessor, ConsoleSpanExporter
# Configure tracer provider and a simple console exporter
trace.set_tracer_provider(TracerProvider())
trace.get_tracer_provider().add_span_processor(
SimpleSpanProcessor(ConsoleSpanExporter())
)
tracer = trace.get_tracer(__name__)
# Create a parent span and a nested child span
with tracer.start_as_current_span("parent-span"):
with tracer.start_as_current_span("child-span"):
print("Performing work inside child span")
```
Key steps in manual instrumentation:
* Set up a TracerProvider and exporters/processors.
* Acquire a tracer with `get_tracer(...)`.
* Use `start_as_current_span` (or equivalent) to create spans.
* Add attributes, events, and links to spans as needed for context.
## Trade-offs at a glance
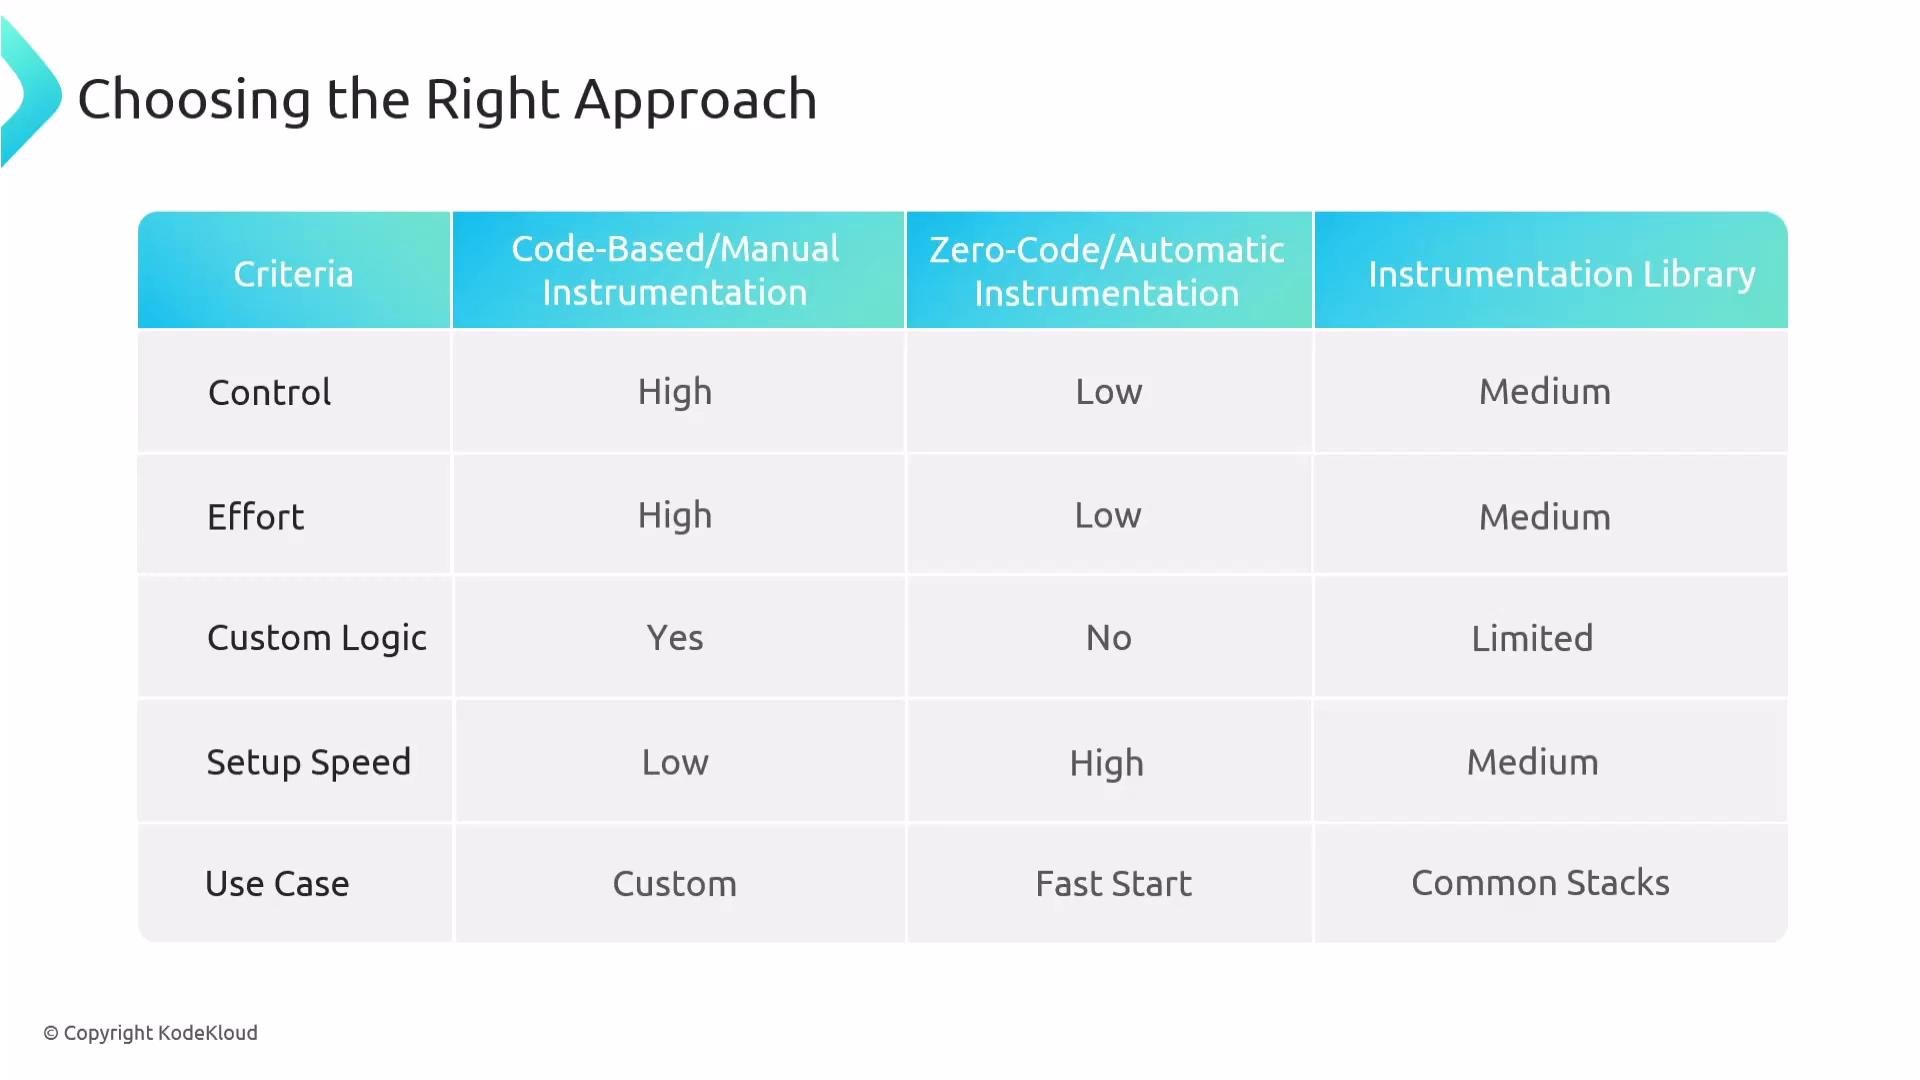
| Approach | Control | Effort | Common Use Cases |
| -------------------- | ----------------------- | --------------------- | ------------------------------------------------------------------------- |
| Manual (code-based) | High | High | Business-level spans, custom logic, precise tracing |
| Library-based | Medium | Medium | Framework-level coverage for web frameworks, DBs, messaging |
| Auto-instrumentation | Lower (agent-dependent) | Low (no source edits) | Legacy apps, rapid coverage, environments where editing code is difficult |
### When to use each approach
* Manual instrumentation
* Use when you need full control or must capture business-specific operations and context that automatic tools cannot infer.
* Library-based instrumentation
* Use when your framework is supported by instrumentation libraries and you want broad coverage with moderate implementation effort.
* Auto-instrumentation
* Use when you cannot modify source code (e.g., legacy apps) or when you need rapid coverage across many services with minimal developer time.
Auto-instrumentation still requires deployment or runtime changes (for example adding a JVM agent or language-specific runtime hook). It does not require source code edits, but it does require configuring the runtime or deploying an agent/sidecar.
## Example: creating custom spans (manual instrumentation)
Below is a concise Python example demonstrating manual instrumentation with the OpenTelemetry API. It shows how to configure a tracer provider, add a console exporter, and create nested spans (parent and child). This pattern maps to other languages: initialize a tracer provider/exporter, then use the tracer API to start spans and add attributes, events, or links.
```python theme={null}
from opentelemetry import trace
from opentelemetry.sdk.trace import TracerProvider
from opentelemetry.sdk.trace.export import SimpleSpanProcessor, ConsoleSpanExporter
# Configure tracer provider and a simple console exporter
trace.set_tracer_provider(TracerProvider())
trace.get_tracer_provider().add_span_processor(
SimpleSpanProcessor(ConsoleSpanExporter())
)
tracer = trace.get_tracer(__name__)
# Create a parent span and a nested child span
with tracer.start_as_current_span("parent-span"):
with tracer.start_as_current_span("child-span"):
print("Performing work inside child span")
```
Key steps in manual instrumentation:
* Set up a TracerProvider and exporters/processors.
* Acquire a tracer with `get_tracer(...)`.
* Use `start_as_current_span` (or equivalent) to create spans.
* Add attributes, events, and links to spans as needed for context.
## Trade-offs at a glance
| Approach | Control | Effort | Common Use Cases |
| -------------------- | ----------------------- | --------------------- | ------------------------------------------------------------------------- |
| Manual (code-based) | High | High | Business-level spans, custom logic, precise tracing |
| Library-based | Medium | Medium | Framework-level coverage for web frameworks, DBs, messaging |
| Auto-instrumentation | Lower (agent-dependent) | Low (no source edits) | Legacy apps, rapid coverage, environments where editing code is difficult |
 ## Practical recommendations
* Start with library-based instrumentation for supported frameworks to get broad coverage quickly.
* Add manual spans for business-critical workflows where you need precise telemetry and contextual attributes.
* Use auto-instrumentation to bootstrap visibility in environments where changing source code is infeasible; follow up with library/manual enhancements for gaps.
* Always validate instrumentation: use console/log exporters, local tracing UIs, or sandboxed environments to confirm spans and attributes appear as expected.
Auto-instrumentation agents may not capture all framework-specific behaviors or custom logic, and they can require permissions or configuration in production environments. Always validate agent compatibility and test in staging before rolling out to production.
## Next steps and further reading
This article is an overview. For deeper dives, review framework-specific instrumentation libraries and runtime agent docs. Practice by:
* Adding library-based instrumentation to a small service.
* Creating manual spans for a business-critical transaction.
* Testing auto-instrumentation with a sample app to understand agent configuration.
Links and references:
* [OpenTelemetry home](https://opentelemetry.io/)
* [OpenTelemetry specification](https://opentelemetry.io/docs/reference/specification/)
* [OpenTelemetry Python instrumentation](https://opentelemetry.io/docs/instrumentation/python/)
* [Auto-instrumentation guides and agents (language-specific)](https://opentelemetry.io/docs/instrumentation/)
Use these resources to explore language- and framework-specific guidance and to follow best practices for sampling, context propagation, and exporter configuration.
## Practical recommendations
* Start with library-based instrumentation for supported frameworks to get broad coverage quickly.
* Add manual spans for business-critical workflows where you need precise telemetry and contextual attributes.
* Use auto-instrumentation to bootstrap visibility in environments where changing source code is infeasible; follow up with library/manual enhancements for gaps.
* Always validate instrumentation: use console/log exporters, local tracing UIs, or sandboxed environments to confirm spans and attributes appear as expected.
Auto-instrumentation agents may not capture all framework-specific behaviors or custom logic, and they can require permissions or configuration in production environments. Always validate agent compatibility and test in staging before rolling out to production.
## Next steps and further reading
This article is an overview. For deeper dives, review framework-specific instrumentation libraries and runtime agent docs. Practice by:
* Adding library-based instrumentation to a small service.
* Creating manual spans for a business-critical transaction.
* Testing auto-instrumentation with a sample app to understand agent configuration.
Links and references:
* [OpenTelemetry home](https://opentelemetry.io/)
* [OpenTelemetry specification](https://opentelemetry.io/docs/reference/specification/)
* [OpenTelemetry Python instrumentation](https://opentelemetry.io/docs/instrumentation/python/)
* [Auto-instrumentation guides and agents (language-specific)](https://opentelemetry.io/docs/instrumentation/)
Use these resources to explore language- and framework-specific guidance and to follow best practices for sampling, context propagation, and exporter configuration.