> ## Documentation Index
> Fetch the complete documentation index at: https://notes.kodekloud.com/llms.txt
> Use this file to discover all available pages before exploring further.
# Zero Code Instrumentation in Java
> Describes zero code Java instrumentation with the OpenTelemetry Java agent, configuration options, extensions, and use of manual spans.
In this lesson we'll examine zero-code instrumentation for Java applications: how it works, how to configure it, when to use manual spans, and how to extend the agent without changing application source.
Bytecode instrumentation is the core technique behind zero-code approaches. Instead of editing source code, an agent modifies compiled Java bytecode at class load or runtime. This injection of behavior lets you capture telemetry automatically — for example, timing HTTP requests or recording database calls — without cluttering business logic.
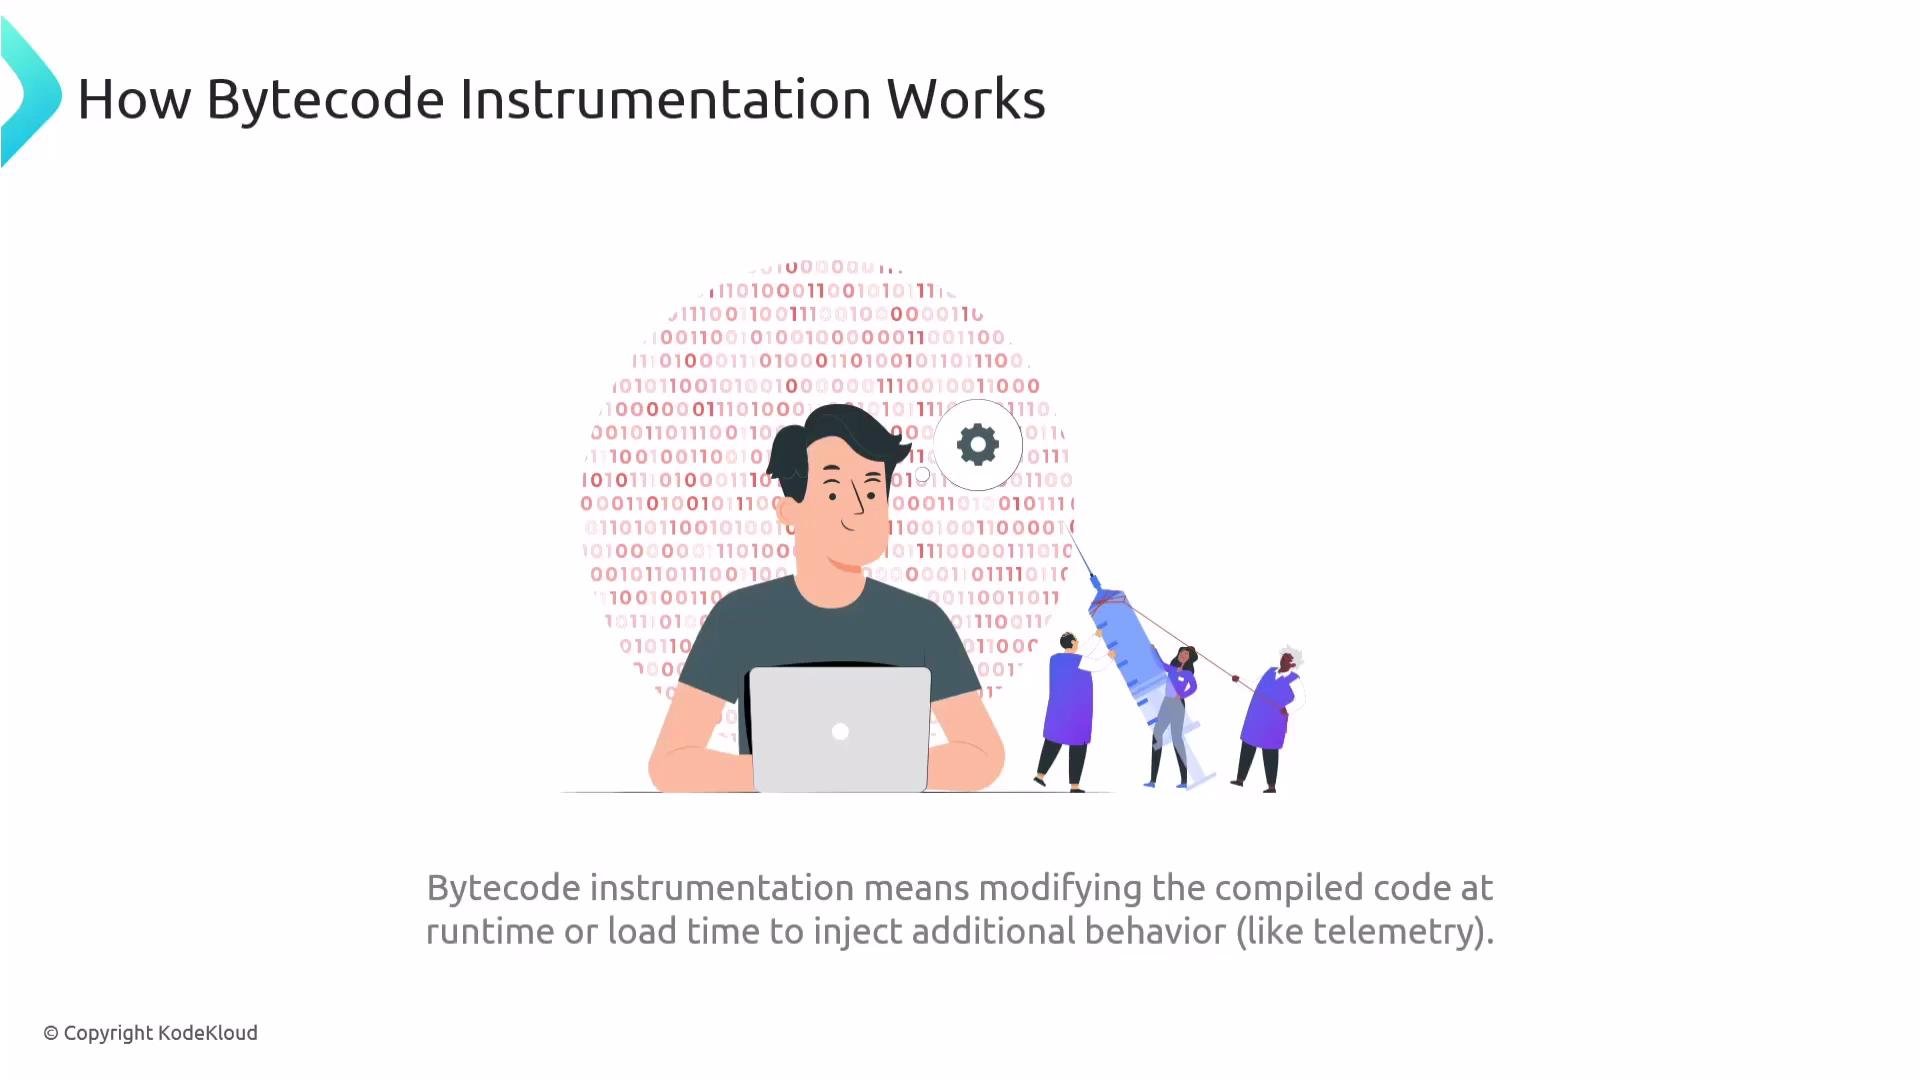 Think of bytecode instrumentation as a behind-the-scenes upgrade that adds observability to your app without touching the source. For Java, the primary implementation is the OpenTelemetry Java agent.
What the OpenTelemetry Java agent provides
* Automatic instrumentation for many common libraries and frameworks
* Out-of-the-box traces and metrics for typical app building blocks
* Minimal or no code changes required to obtain telemetry
Typical capabilities include:
* Tracing incoming and outgoing HTTP requests
* Capturing database queries and connection metadata
* Tracking messaging events (Kafka, JMS, RabbitMQ, etc.)
Think of bytecode instrumentation as a behind-the-scenes upgrade that adds observability to your app without touching the source. For Java, the primary implementation is the OpenTelemetry Java agent.
What the OpenTelemetry Java agent provides
* Automatic instrumentation for many common libraries and frameworks
* Out-of-the-box traces and metrics for typical app building blocks
* Minimal or no code changes required to obtain telemetry
Typical capabilities include:
* Tracing incoming and outgoing HTTP requests
* Capturing database queries and connection metadata
* Tracking messaging events (Kafka, JMS, RabbitMQ, etc.)
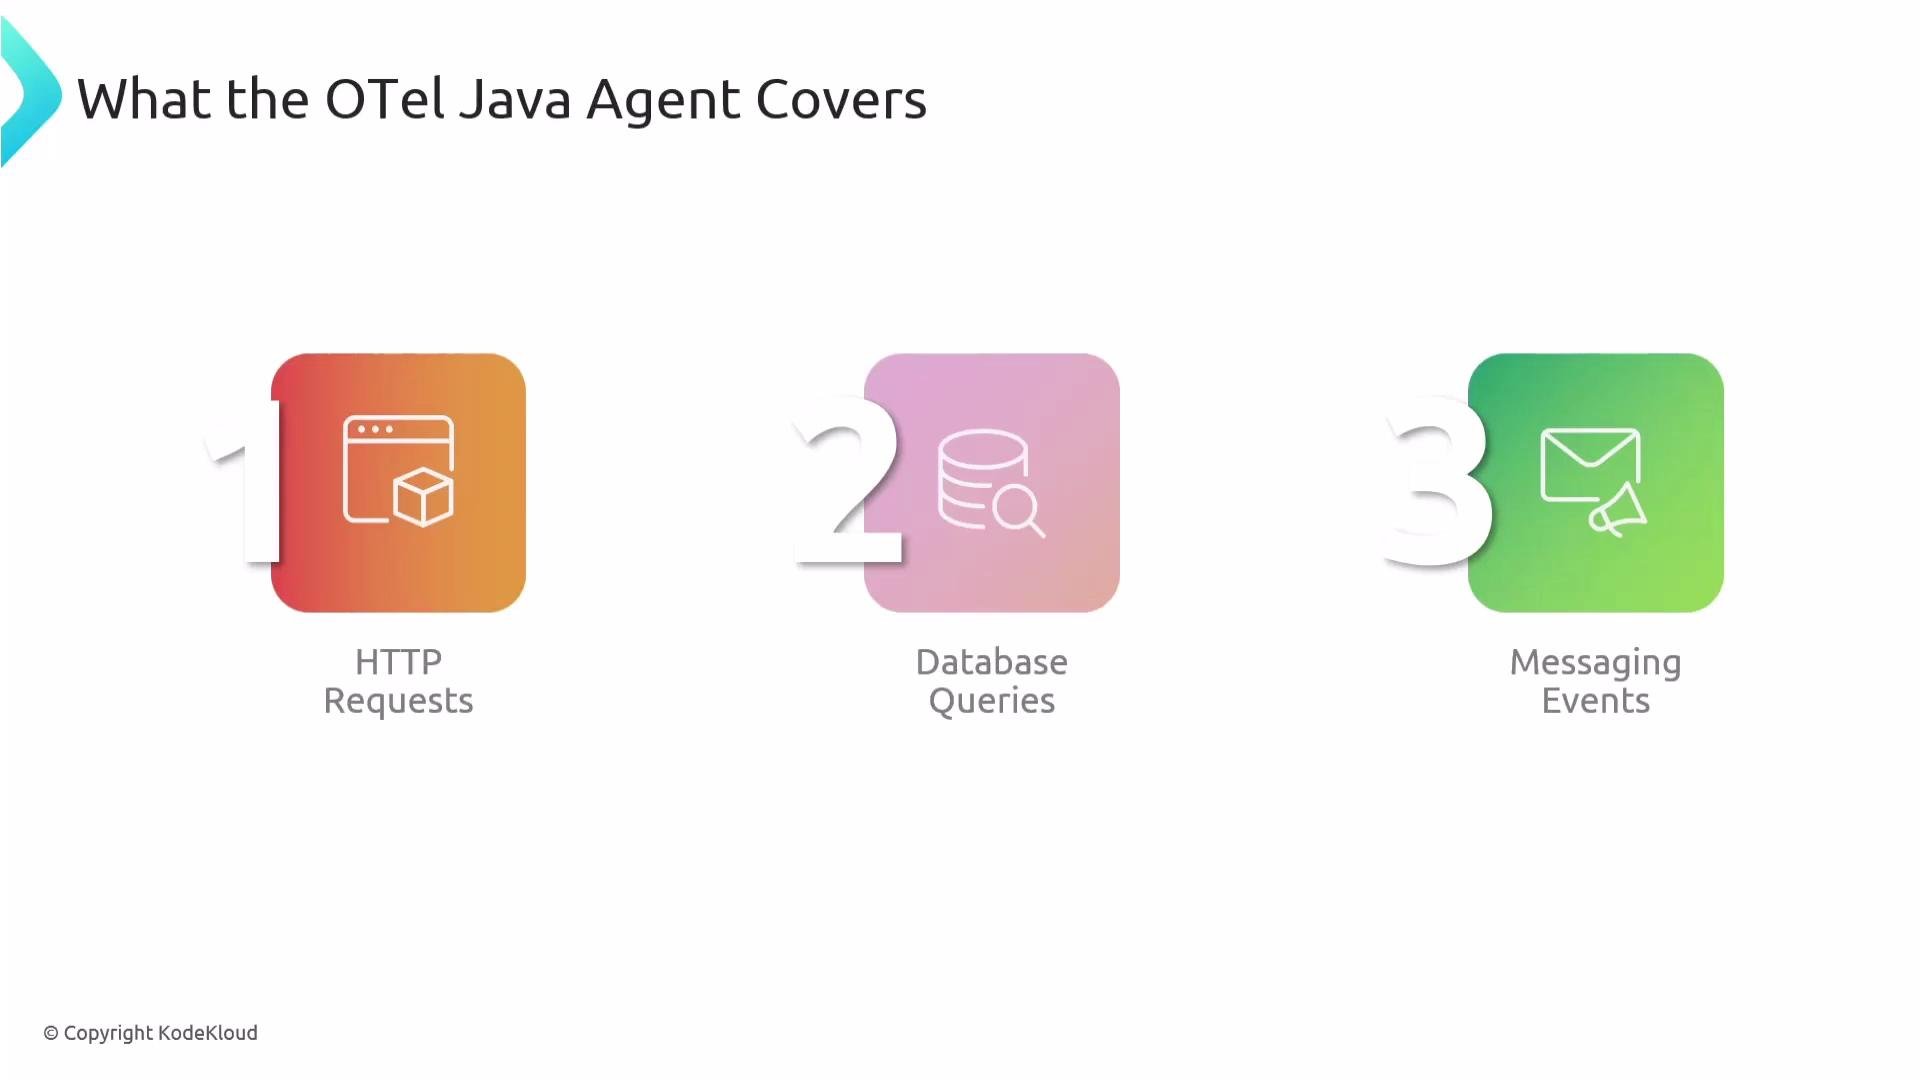 With the agent you immediately cover the major building blocks of most enterprise applications: web requests, persistence, and messaging.
Where to get the Java agent
* Repository: [open-telemetry/opentelemetry-java-instrumentation](https://github.com/open-telemetry/opentelemetry-java-instrumentation)
* Releases page (download the `opentelemetry-javaagent.jar`): [https://github.com/open-telemetry/opentelemetry-java-instrumentation/releases](https://github.com/open-telemetry/opentelemetry-java-instrumentation/releases)
Basic JVM startup with the agent
A minimal JVM startup using the Java agent looks like:
```bash theme={null}
java -javaagent:opentelemetry-javaagent.jar -jar myapp.jar
```
This attaches the agent and enables automatic instrumentation. In practice you should also configure resource metadata (for example, service name) and the exporter so telemetry is sent to the backend you use.
Configure the agent with JVM properties or environment variables
Two common and recommended ways to configure the agent:
1. JVM system properties (`-D` flags) — useful for direct JVM launches and fine-grained control.
2. Environment variables (`OTEL_*`) — recommended in containerized environments (Docker, Kubernetes).
JVM system properties example (set service name and use Zipkin exporter):
```bash theme={null}
java -javaagent:path/to/opentelemetry-javaagent.jar \
-Dotel.resource.attributes=service.name=my-app \
-Dotel.traces.exporter=zipkin \
-jar myapp.jar
```
Environment variables example (recommended for containers):
```bash theme={null}
OTEL_SERVICE_NAME=your-service-name \
OTEL_TRACES_EXPORTER=zipkin \
java -javaagent:path/to/opentelemetry-javaagent.jar \
-jar myapp.jar
```
For container deployments, environment variables (`OTEL_*`) are generally preferable to JVM `-D` properties because they integrate cleanly with container orchestration, secrets, and configuration management.
Two primary configuration channels:
* System properties using `-Dotel.*` JVM flags
* Environment variables using `OTEL_*` names
With the agent you immediately cover the major building blocks of most enterprise applications: web requests, persistence, and messaging.
Where to get the Java agent
* Repository: [open-telemetry/opentelemetry-java-instrumentation](https://github.com/open-telemetry/opentelemetry-java-instrumentation)
* Releases page (download the `opentelemetry-javaagent.jar`): [https://github.com/open-telemetry/opentelemetry-java-instrumentation/releases](https://github.com/open-telemetry/opentelemetry-java-instrumentation/releases)
Basic JVM startup with the agent
A minimal JVM startup using the Java agent looks like:
```bash theme={null}
java -javaagent:opentelemetry-javaagent.jar -jar myapp.jar
```
This attaches the agent and enables automatic instrumentation. In practice you should also configure resource metadata (for example, service name) and the exporter so telemetry is sent to the backend you use.
Configure the agent with JVM properties or environment variables
Two common and recommended ways to configure the agent:
1. JVM system properties (`-D` flags) — useful for direct JVM launches and fine-grained control.
2. Environment variables (`OTEL_*`) — recommended in containerized environments (Docker, Kubernetes).
JVM system properties example (set service name and use Zipkin exporter):
```bash theme={null}
java -javaagent:path/to/opentelemetry-javaagent.jar \
-Dotel.resource.attributes=service.name=my-app \
-Dotel.traces.exporter=zipkin \
-jar myapp.jar
```
Environment variables example (recommended for containers):
```bash theme={null}
OTEL_SERVICE_NAME=your-service-name \
OTEL_TRACES_EXPORTER=zipkin \
java -javaagent:path/to/opentelemetry-javaagent.jar \
-jar myapp.jar
```
For container deployments, environment variables (`OTEL_*`) are generally preferable to JVM `-D` properties because they integrate cleanly with container orchestration, secrets, and configuration management.
Two primary configuration channels:
* System properties using `-Dotel.*` JVM flags
* Environment variables using `OTEL_*` names
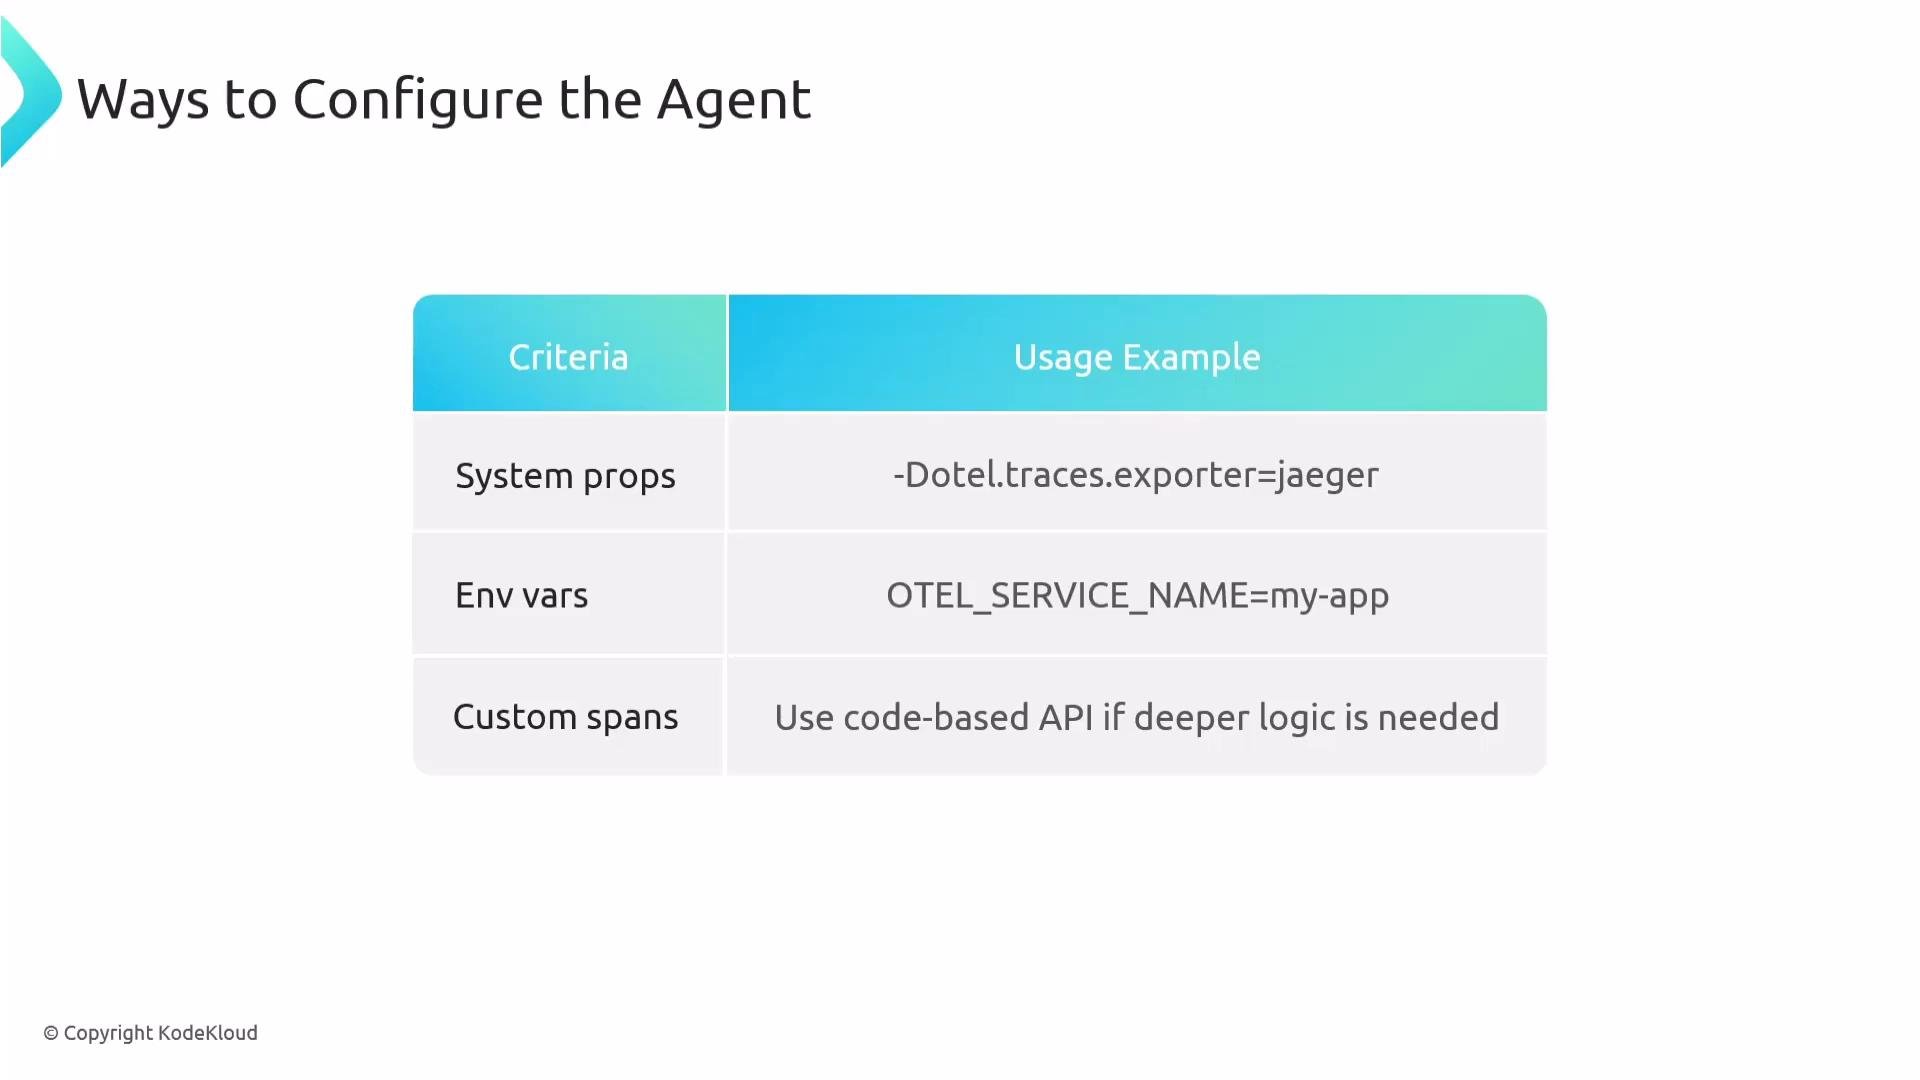 Manual / custom spans
Automatic instrumentation covers many common interactions, but you’ll still need manual (code-based) instrumentation for business logic sections that are not automatically instrumented. Manual spans require using the OpenTelemetry API in your application to create spans and set attributes at the points you choose.
Common configuration options (quick reference)
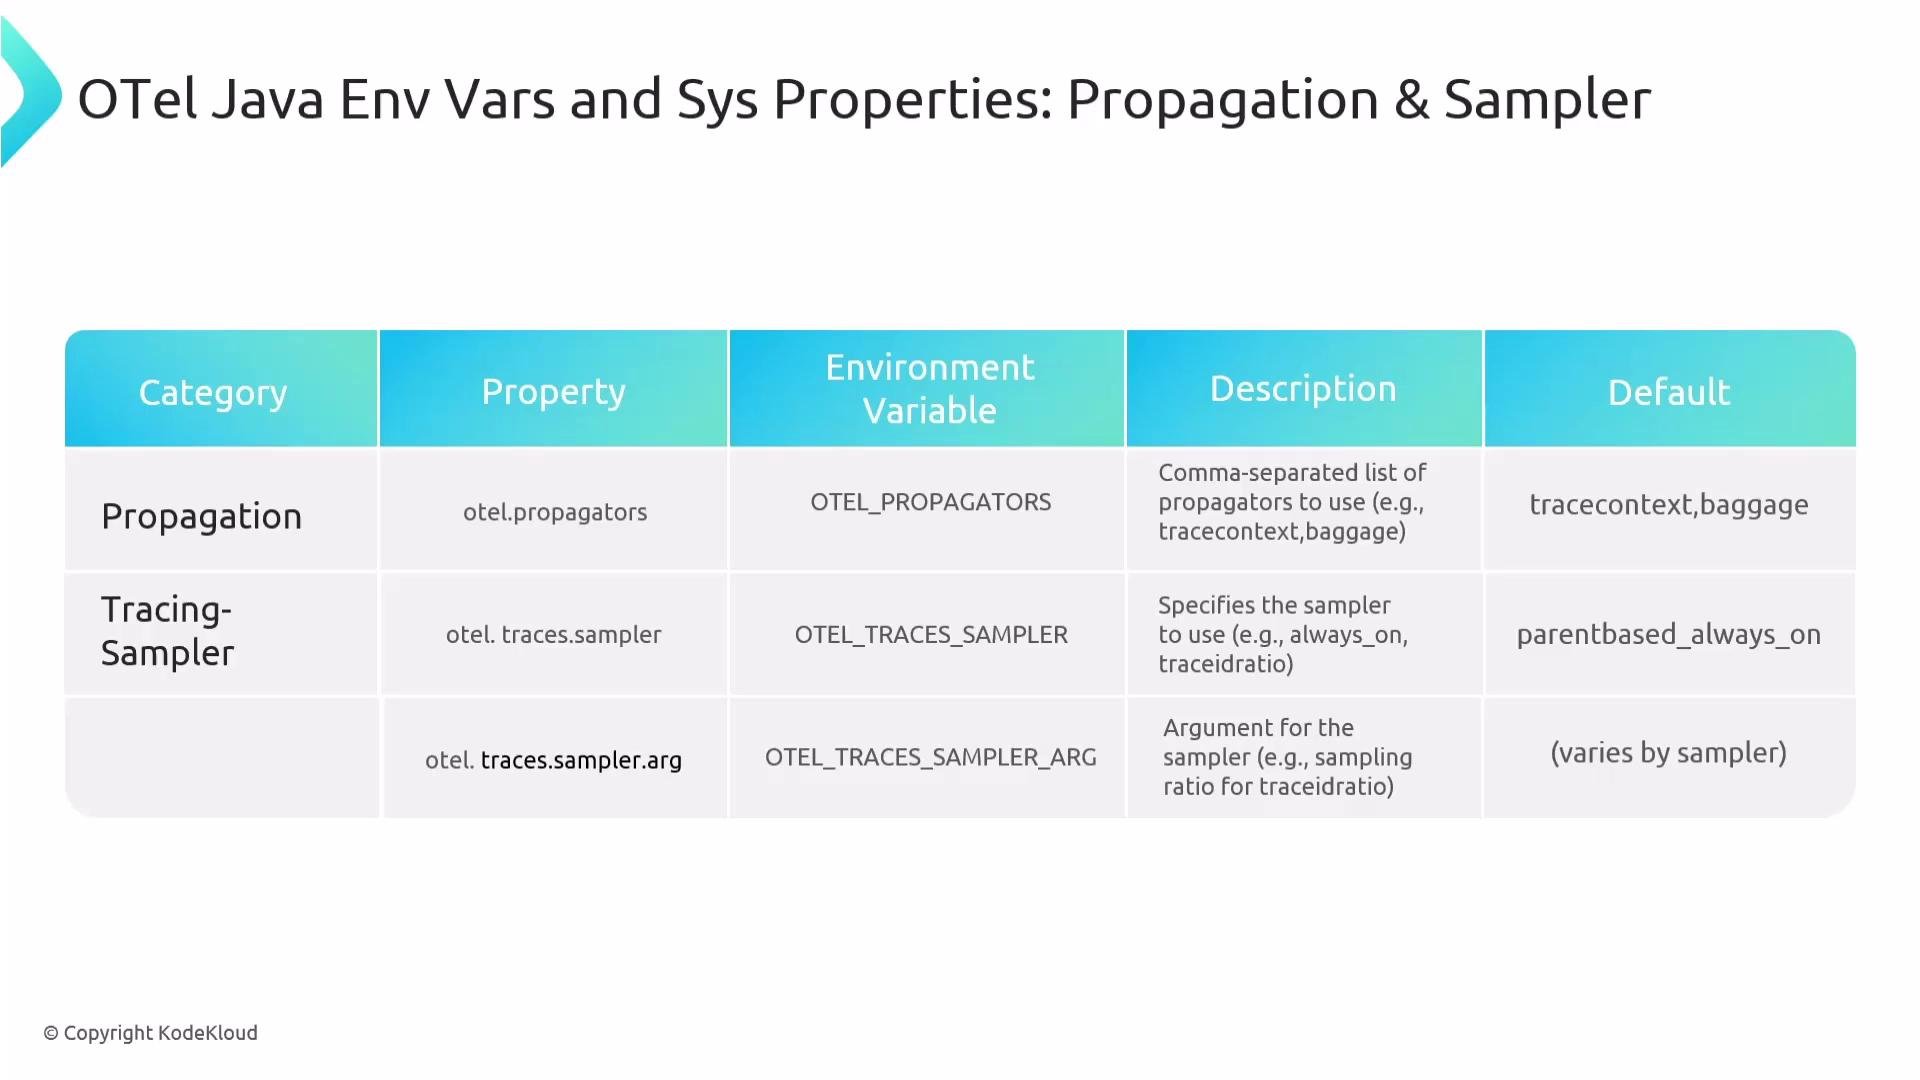
Below are commonly used environment variables and JVM properties to tune the Java agent. These are not exhaustive but cover the most important settings you’ll encounter.
| Setting | Purpose | Example |
| ------------------------------------------------------- | ------------------------------------------------------------ | ----------------------------------------------------------- |
| `OTEL_SERVICE_NAME` | Service name shown in backends | `OTEL_SERVICE_NAME=my-service` |
| `otel.resource.attributes` / `OTEL_RESOURCE_ATTRIBUTES` | Additional resource key=value attributes | `-Dotel.resource.attributes=environment=prod,team=payments` |
| `OTEL_TRACES_EXPORTER` | Choose traces exporter (e.g., `otlp`, `zipkin`, `jaeger`) | `OTEL_TRACES_EXPORTER=otlp` |
| `OTEL_PROPAGATORS` | Configure context propagation (e.g., `tracecontext,baggage`) | `OTEL_PROPAGATORS=tracecontext,baggage` |
| `OTEL_TRACES_SAMPLER` | Sampling strategy (`always_on`, `traceidratio`, etc.) | `OTEL_TRACES_SAMPLER=traceidratio` |
| `OTEL_TRACES_SAMPLER_ARG` | Sampler argument (e.g., ratio) | `OTEL_TRACES_SAMPLER_ARG=0.1` |
| `OTEL_SDK_DISABLED` | Disable the SDK entirely (useful for tests) | `OTEL_SDK_DISABLED=true` |
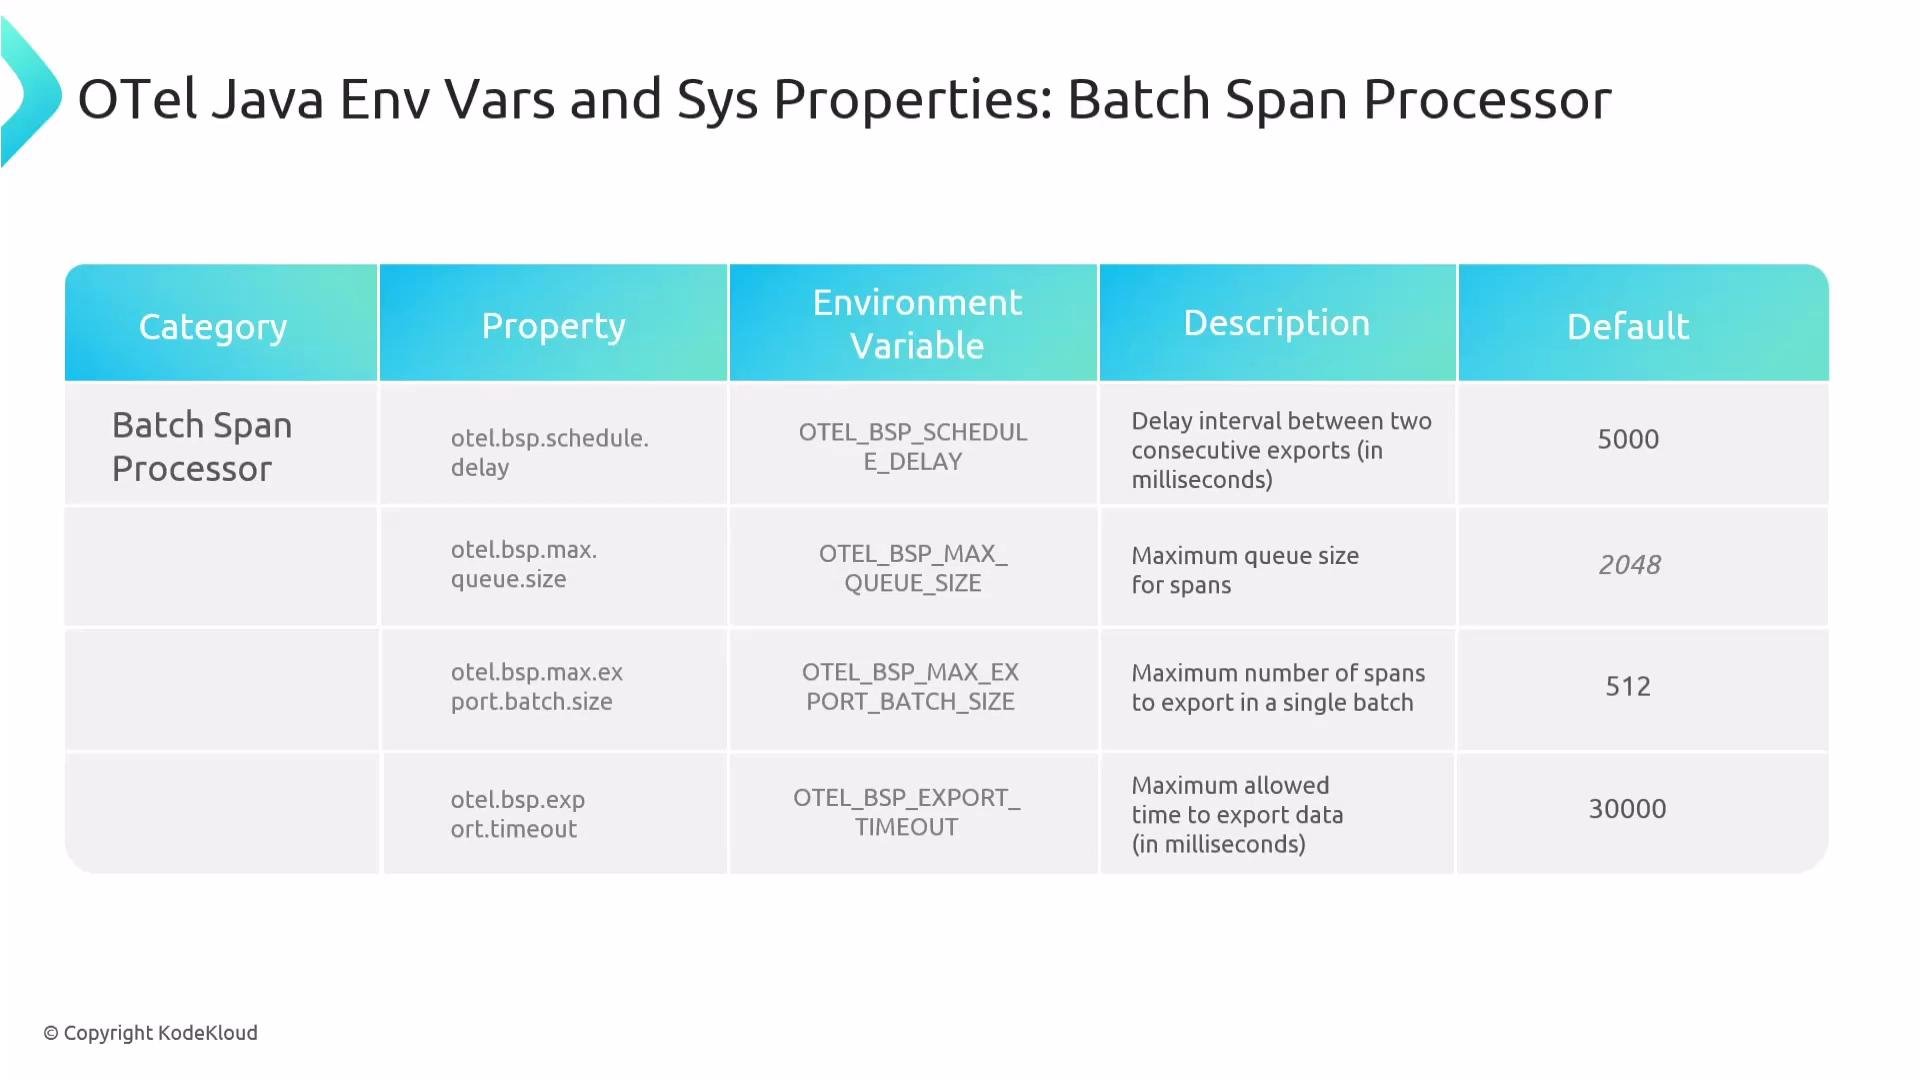
Batch span processor and cardinality limits are also configurable (queue sizes, schedule delays, max attributes/events/links). Fine-tune these when optimizing performance and storage.
Manual / custom spans
Automatic instrumentation covers many common interactions, but you’ll still need manual (code-based) instrumentation for business logic sections that are not automatically instrumented. Manual spans require using the OpenTelemetry API in your application to create spans and set attributes at the points you choose.
Common configuration options (quick reference)
Below are commonly used environment variables and JVM properties to tune the Java agent. These are not exhaustive but cover the most important settings you’ll encounter.
| Setting | Purpose | Example |
| ------------------------------------------------------- | ------------------------------------------------------------ | ----------------------------------------------------------- |
| `OTEL_SERVICE_NAME` | Service name shown in backends | `OTEL_SERVICE_NAME=my-service` |
| `otel.resource.attributes` / `OTEL_RESOURCE_ATTRIBUTES` | Additional resource key=value attributes | `-Dotel.resource.attributes=environment=prod,team=payments` |
| `OTEL_TRACES_EXPORTER` | Choose traces exporter (e.g., `otlp`, `zipkin`, `jaeger`) | `OTEL_TRACES_EXPORTER=otlp` |
| `OTEL_PROPAGATORS` | Configure context propagation (e.g., `tracecontext,baggage`) | `OTEL_PROPAGATORS=tracecontext,baggage` |
| `OTEL_TRACES_SAMPLER` | Sampling strategy (`always_on`, `traceidratio`, etc.) | `OTEL_TRACES_SAMPLER=traceidratio` |
| `OTEL_TRACES_SAMPLER_ARG` | Sampler argument (e.g., ratio) | `OTEL_TRACES_SAMPLER_ARG=0.1` |
| `OTEL_SDK_DISABLED` | Disable the SDK entirely (useful for tests) | `OTEL_SDK_DISABLED=true` |
Batch span processor and cardinality limits are also configurable (queue sizes, schedule delays, max attributes/events/links). Fine-tune these when optimizing performance and storage.
 Batch span processor controls and tuning
Performance-sensitive settings—such as batch processor queue size, schedule delay, and export timeout—help balance throughput and memory/latency trade-offs.
Batch span processor controls and tuning
Performance-sensitive settings—such as batch processor queue size, schedule delay, and export timeout—help balance throughput and memory/latency trade-offs.
 From an exam or conceptual perspective, remember the major ones: service name, resource attributes, propagators, sampler, and exporter.
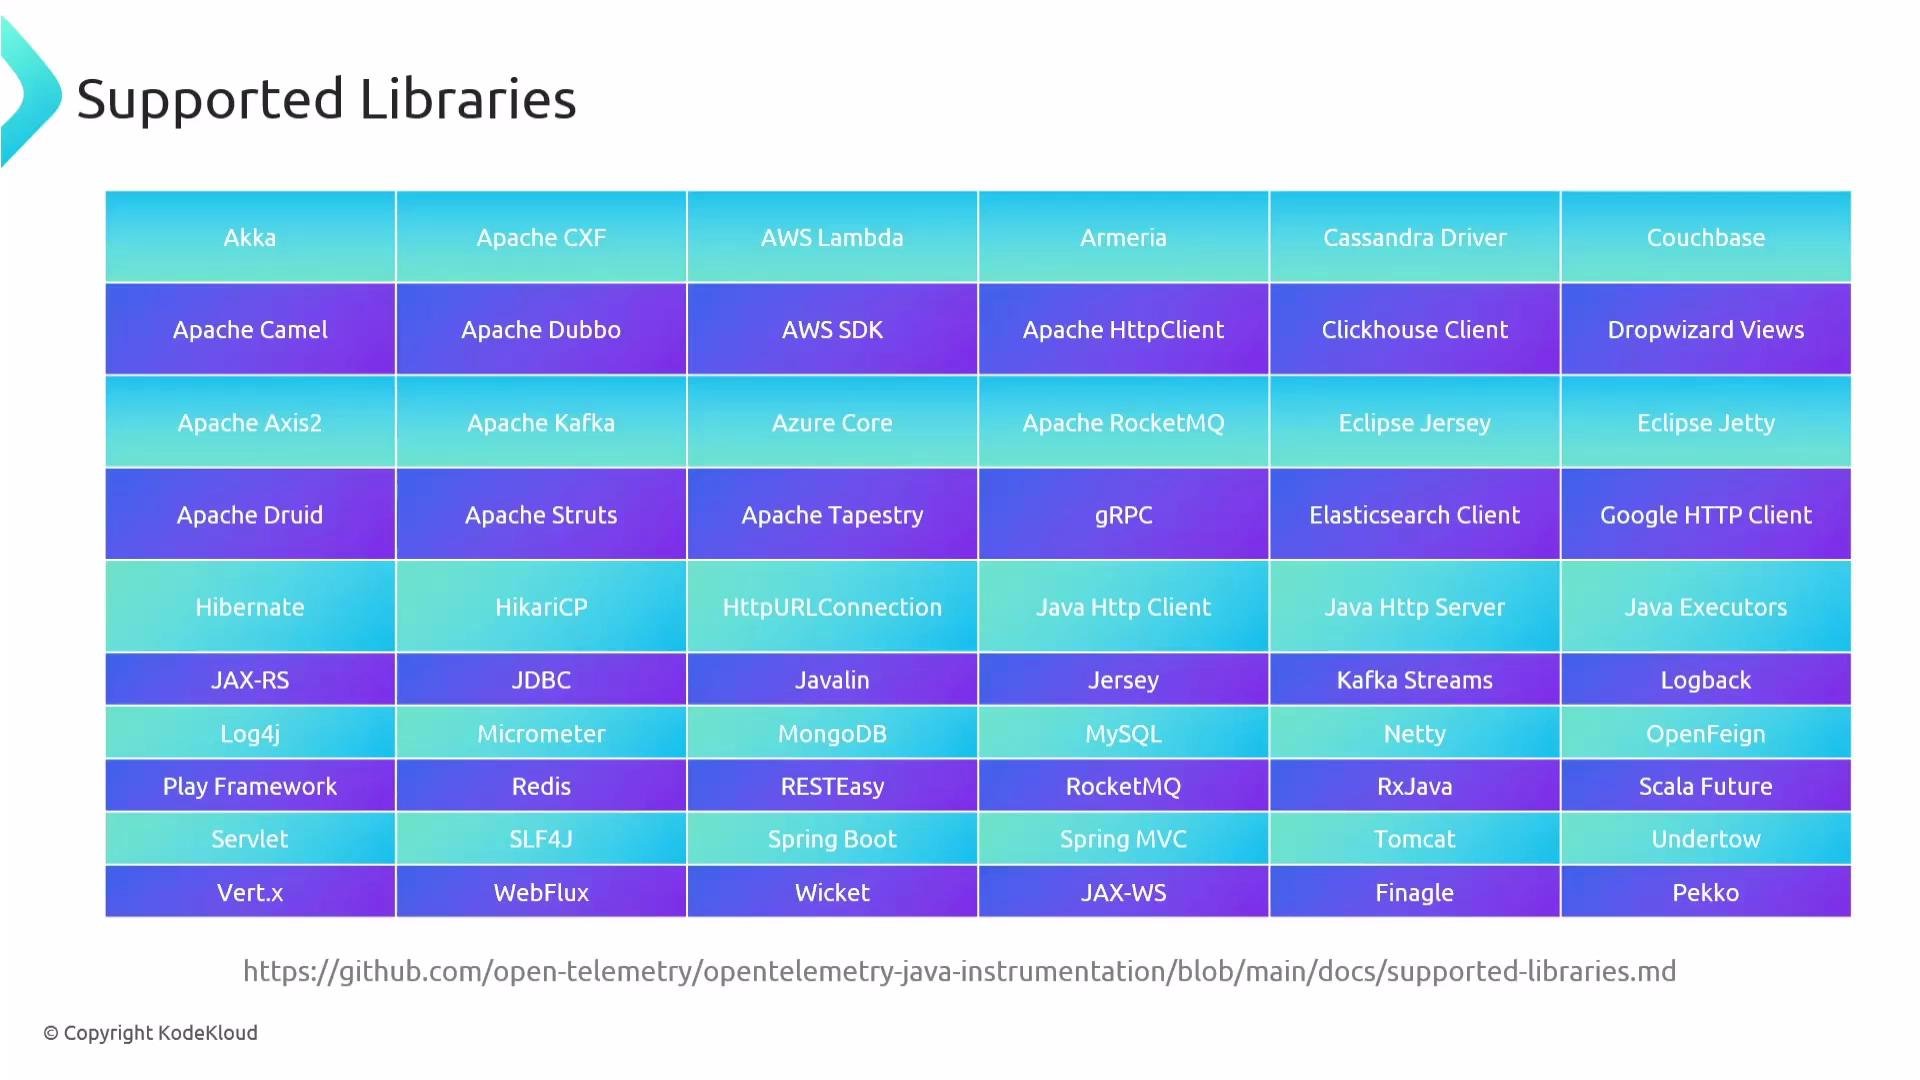
Supported libraries and frameworks
The Java agent supports a large number of libraries and frameworks. Check the instrumentation repository for the exhaustive list and to confirm coverage for your application’s dependencies.
From an exam or conceptual perspective, remember the major ones: service name, resource attributes, propagators, sampler, and exporter.
Supported libraries and frameworks
The Java agent supports a large number of libraries and frameworks. Check the instrumentation repository for the exhaustive list and to confirm coverage for your application’s dependencies.
 Java agent extensions: customize without changing app code
Agent extensions let you enhance or change agent behavior without modifying the main agent distribution or your application code. Extensions are useful to keep the zero-code promise while adding custom logic.
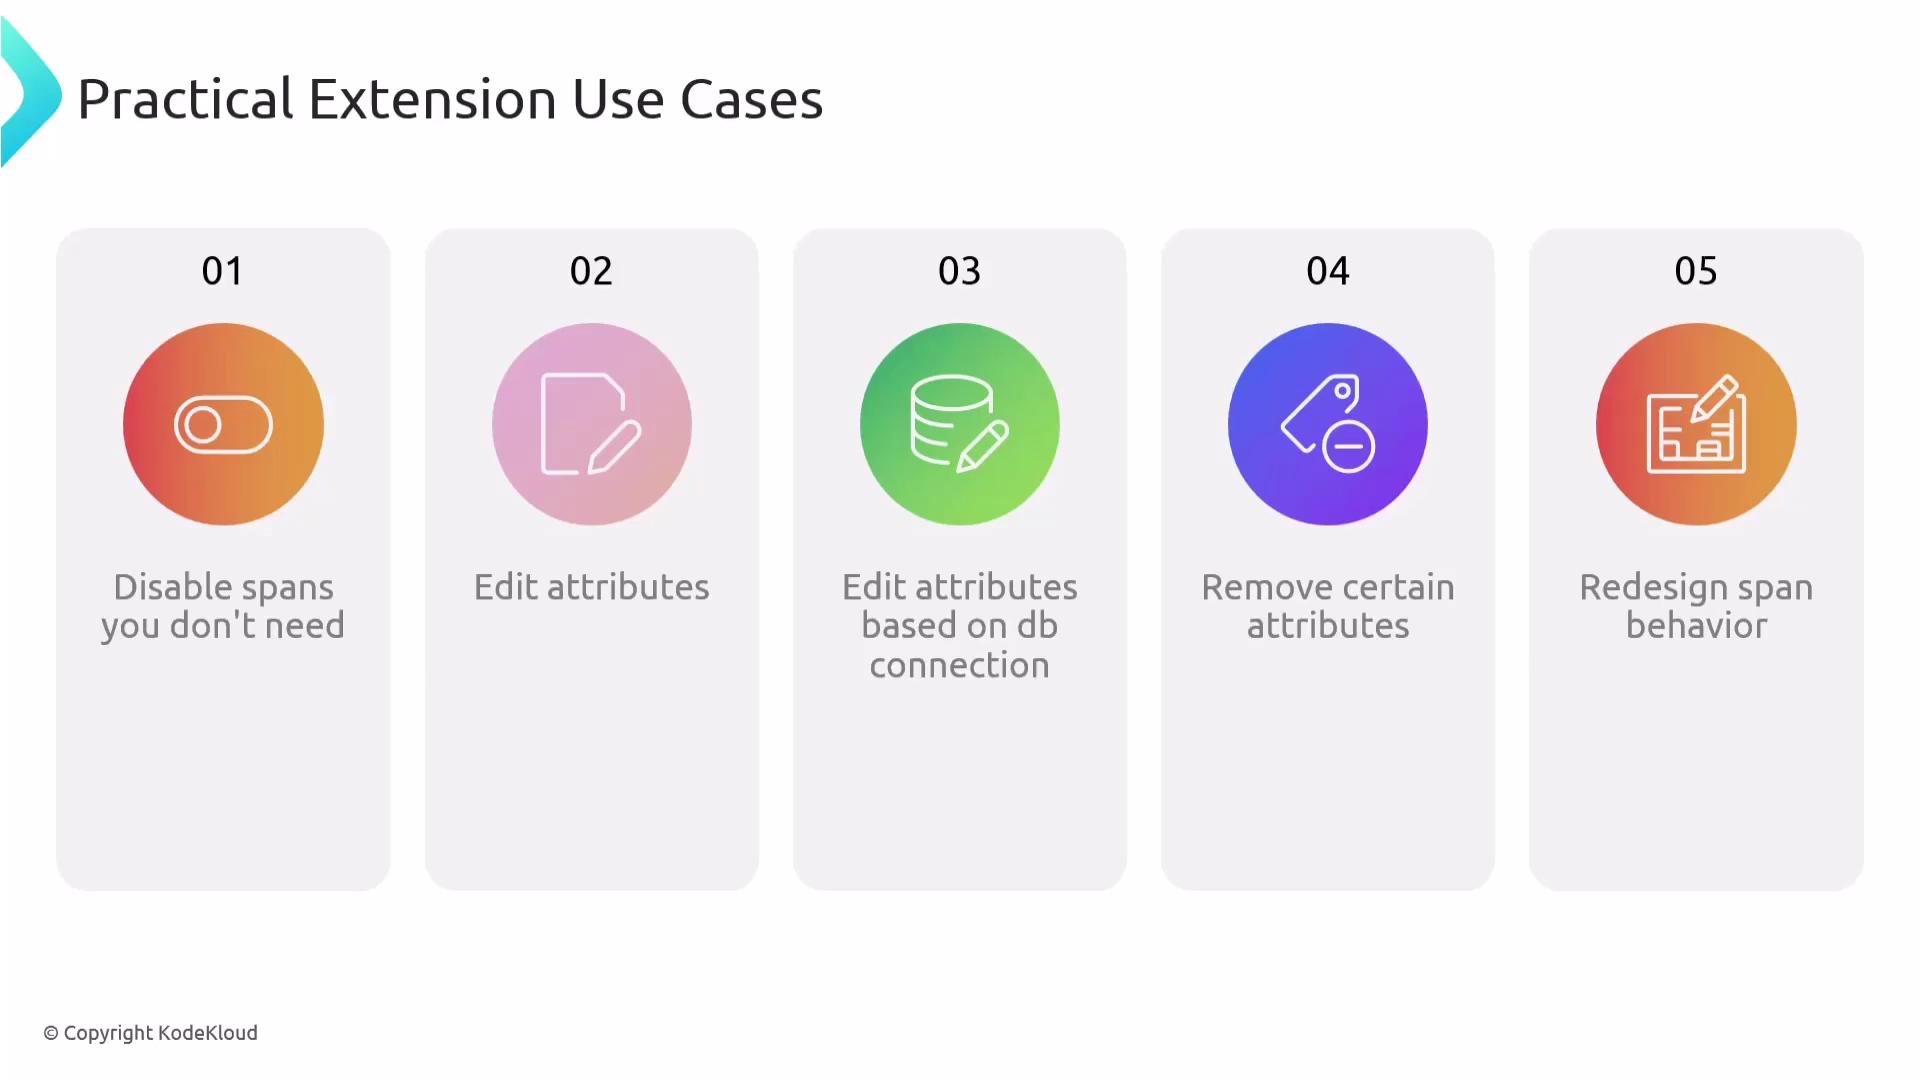
Capabilities of extensions
* Add or configure span processors, exporters, samplers, or propagators
* Inject new instrumentation modules for libraries not yet supported
* Modify or filter span attributes (for example, mask sensitive data)
* Disable or override existing instrumentation behavior
Building and loading extensions
Package your extension as a JAR (for example, with Gradle):
```bash theme={null}
./gradlew build
# resulting JAR: build/libs/your-extension.jar
```
Load it when starting the JVM using the `otel.javaagent.extensions` system property:
```bash theme={null}
java -javaagent:path/to/opentelemetry-javaagent.jar \
-Dotel.javaagent.extensions=path/to/extension.jar \
-jar myapp.jar
```
This causes the agent to load and apply your extension alongside default instrumentation.
Real-world extension examples
* Disable spans to reduce noise and storage usage
* Normalize attribute names across services
* Mask or remove PII before exporting spans
* Add support for an in-house library that the agent does not yet instrument
Java agent extensions: customize without changing app code
Agent extensions let you enhance or change agent behavior without modifying the main agent distribution or your application code. Extensions are useful to keep the zero-code promise while adding custom logic.
Capabilities of extensions
* Add or configure span processors, exporters, samplers, or propagators
* Inject new instrumentation modules for libraries not yet supported
* Modify or filter span attributes (for example, mask sensitive data)
* Disable or override existing instrumentation behavior
Building and loading extensions
Package your extension as a JAR (for example, with Gradle):
```bash theme={null}
./gradlew build
# resulting JAR: build/libs/your-extension.jar
```
Load it when starting the JVM using the `otel.javaagent.extensions` system property:
```bash theme={null}
java -javaagent:path/to/opentelemetry-javaagent.jar \
-Dotel.javaagent.extensions=path/to/extension.jar \
-jar myapp.jar
```
This causes the agent to load and apply your extension alongside default instrumentation.
Real-world extension examples
* Disable spans to reduce noise and storage usage
* Normalize attribute names across services
* Mask or remove PII before exporting spans
* Add support for an in-house library that the agent does not yet instrument
 Do not confuse Java agent extensions with OpenTelemetry Collector extensions — they are different concepts in different components. Collector extensions apply to the Collector pipeline, while Java agent extensions modify agent behavior inside the JVM.
Terminology and best practices
* Automatic instrumentation is ideal for broad coverage with minimal effort.
* Use manual instrumentation (OpenTelemetry API) for business-specific spans and fine-grained telemetry.
* Prefer environment variables in containerized environments for easier integration with orchestration and secrets.
* Keep an eye on sampling and cardinality limits to control backend costs and performance.
Wrapping up
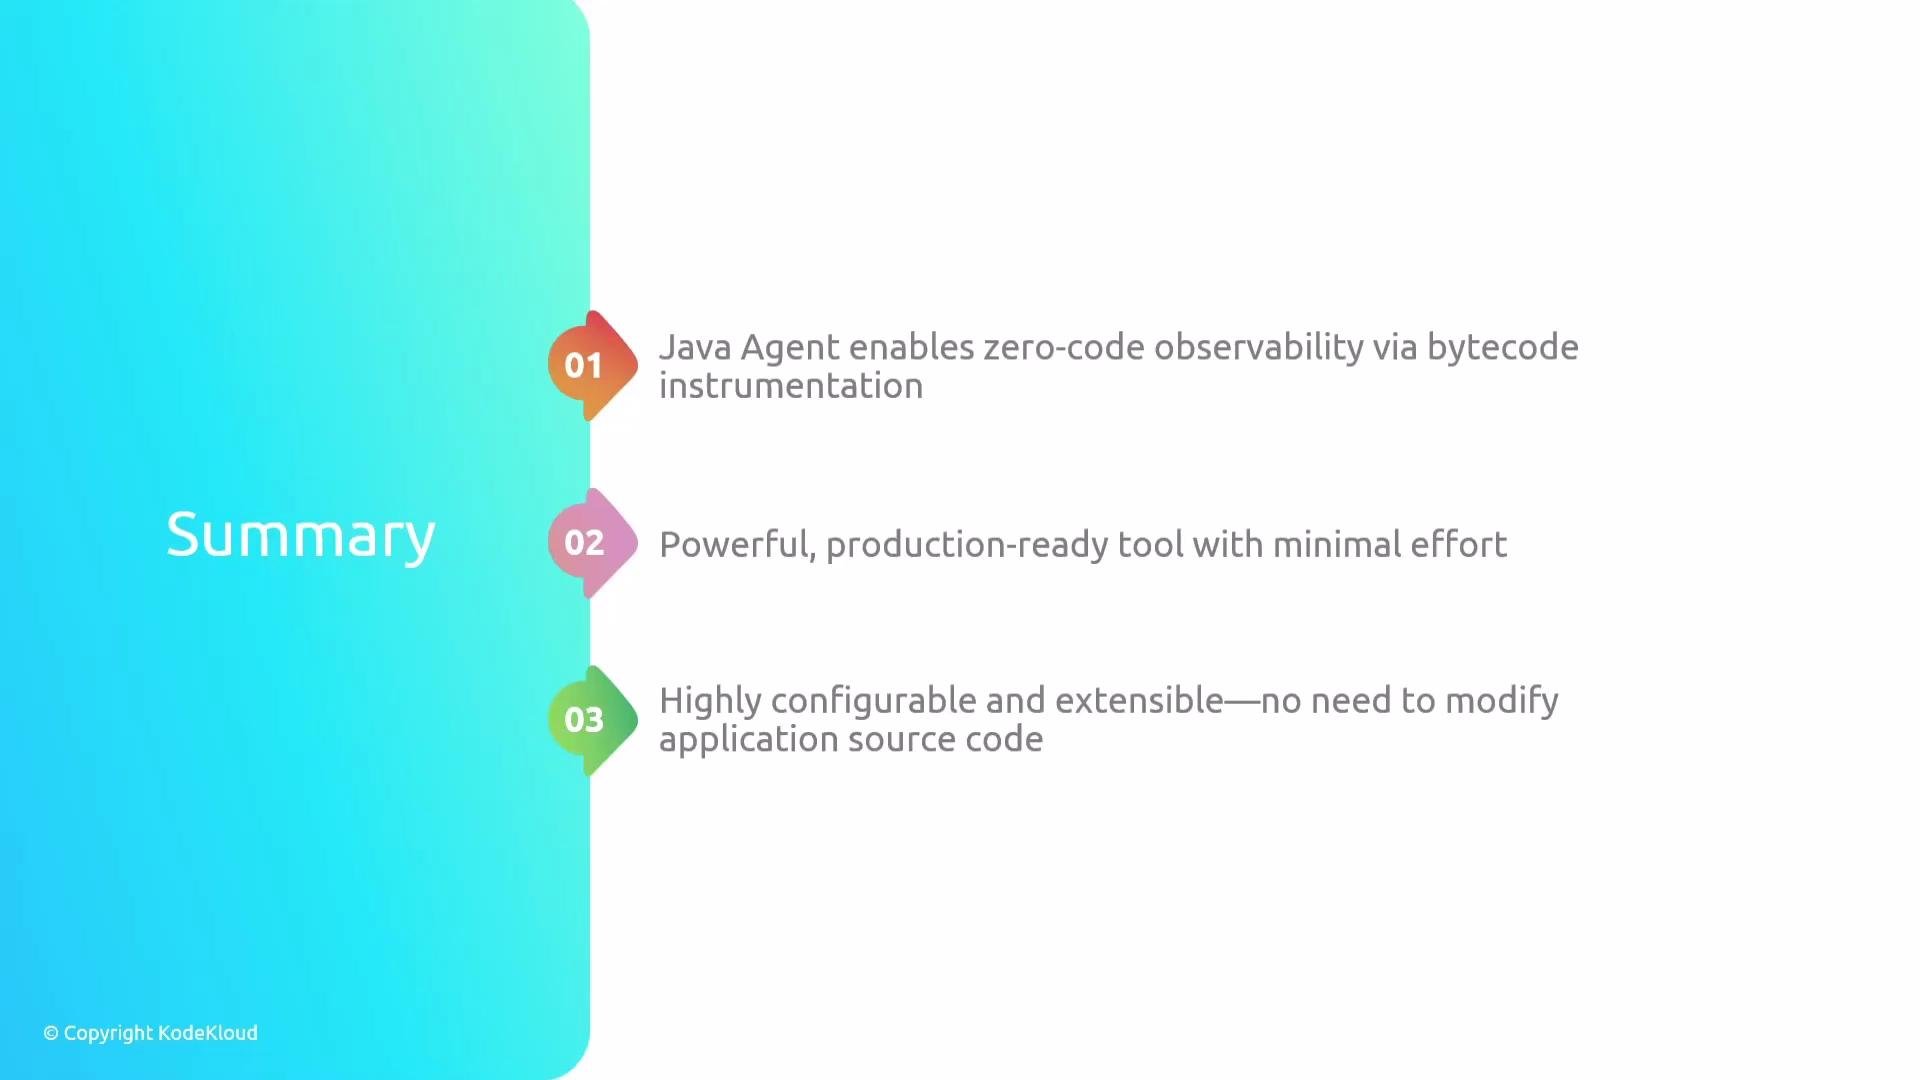
The OpenTelemetry Java agent enables production-ready, zero-code observability through bytecode instrumentation. It provides immediate visibility into common frameworks and libraries, is highly configurable via environment variables or JVM properties, and can be extended with custom agent extensions when necessary. For functionality not covered automatically, use manual instrumentation with the OpenTelemetry API.
Do not confuse Java agent extensions with OpenTelemetry Collector extensions — they are different concepts in different components. Collector extensions apply to the Collector pipeline, while Java agent extensions modify agent behavior inside the JVM.
Terminology and best practices
* Automatic instrumentation is ideal for broad coverage with minimal effort.
* Use manual instrumentation (OpenTelemetry API) for business-specific spans and fine-grained telemetry.
* Prefer environment variables in containerized environments for easier integration with orchestration and secrets.
* Keep an eye on sampling and cardinality limits to control backend costs and performance.
Wrapping up
The OpenTelemetry Java agent enables production-ready, zero-code observability through bytecode instrumentation. It provides immediate visibility into common frameworks and libraries, is highly configurable via environment variables or JVM properties, and can be extended with custom agent extensions when necessary. For functionality not covered automatically, use manual instrumentation with the OpenTelemetry API.
 Links and references
* OpenTelemetry Java instrumentation repository: [https://github.com/open-telemetry/opentelemetry-java-instrumentation](https://github.com/open-telemetry/opentelemetry-java-instrumentation)
* OpenTelemetry Java instrumentation releases: [https://github.com/open-telemetry/opentelemetry-java-instrumentation/releases](https://github.com/open-telemetry/opentelemetry-java-instrumentation/releases)
* Agent documentation and configuration: [https://opentelemetry.io/docs/instrumentation/java/](https://opentelemetry.io/docs/instrumentation/java/)
Links and references
* OpenTelemetry Java instrumentation repository: [https://github.com/open-telemetry/opentelemetry-java-instrumentation](https://github.com/open-telemetry/opentelemetry-java-instrumentation)
* OpenTelemetry Java instrumentation releases: [https://github.com/open-telemetry/opentelemetry-java-instrumentation/releases](https://github.com/open-telemetry/opentelemetry-java-instrumentation/releases)
* Agent documentation and configuration: [https://opentelemetry.io/docs/instrumentation/java/](https://opentelemetry.io/docs/instrumentation/java/)