> ## Documentation Index
> Fetch the complete documentation index at: https://notes.kodekloud.com/llms.txt
> Use this file to discover all available pages before exploring further.
# Zero Code Instrumentation in Python
> Explains OpenTelemetry Python zero-code auto-instrumentation using monkey patching to capture traces and metrics for common libraries, plus installation, configuration, and debugging steps.
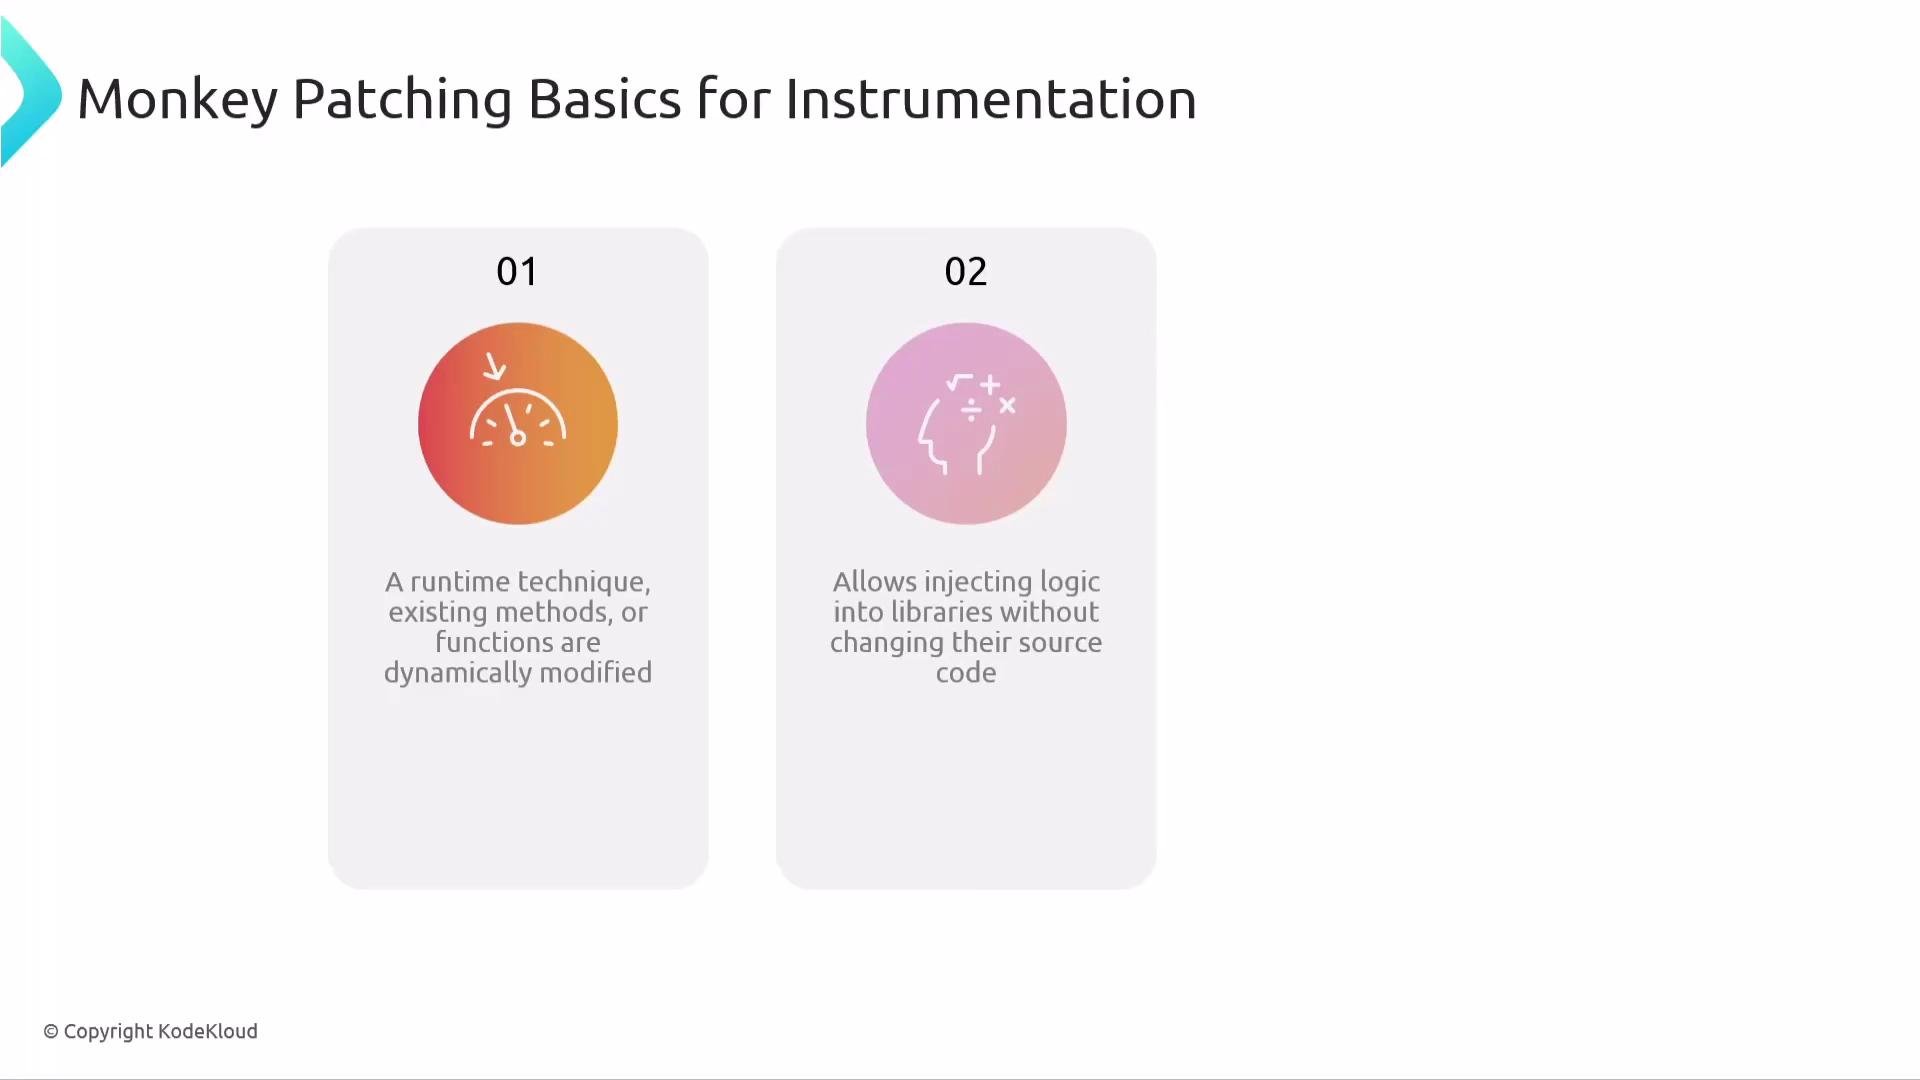
Zero-code (or auto-) instrumentation lets you add observability to Python applications without modifying source code. In Python this is achieved primarily via monkey patching: at runtime, the agent replaces or wraps existing functions and methods in popular libraries so that traces and metrics are collected automatically. While other languages (like Java) commonly use bytecode manipulation, Python’s runtime patching delivers the same outcome by altering call behavior as the program runs.
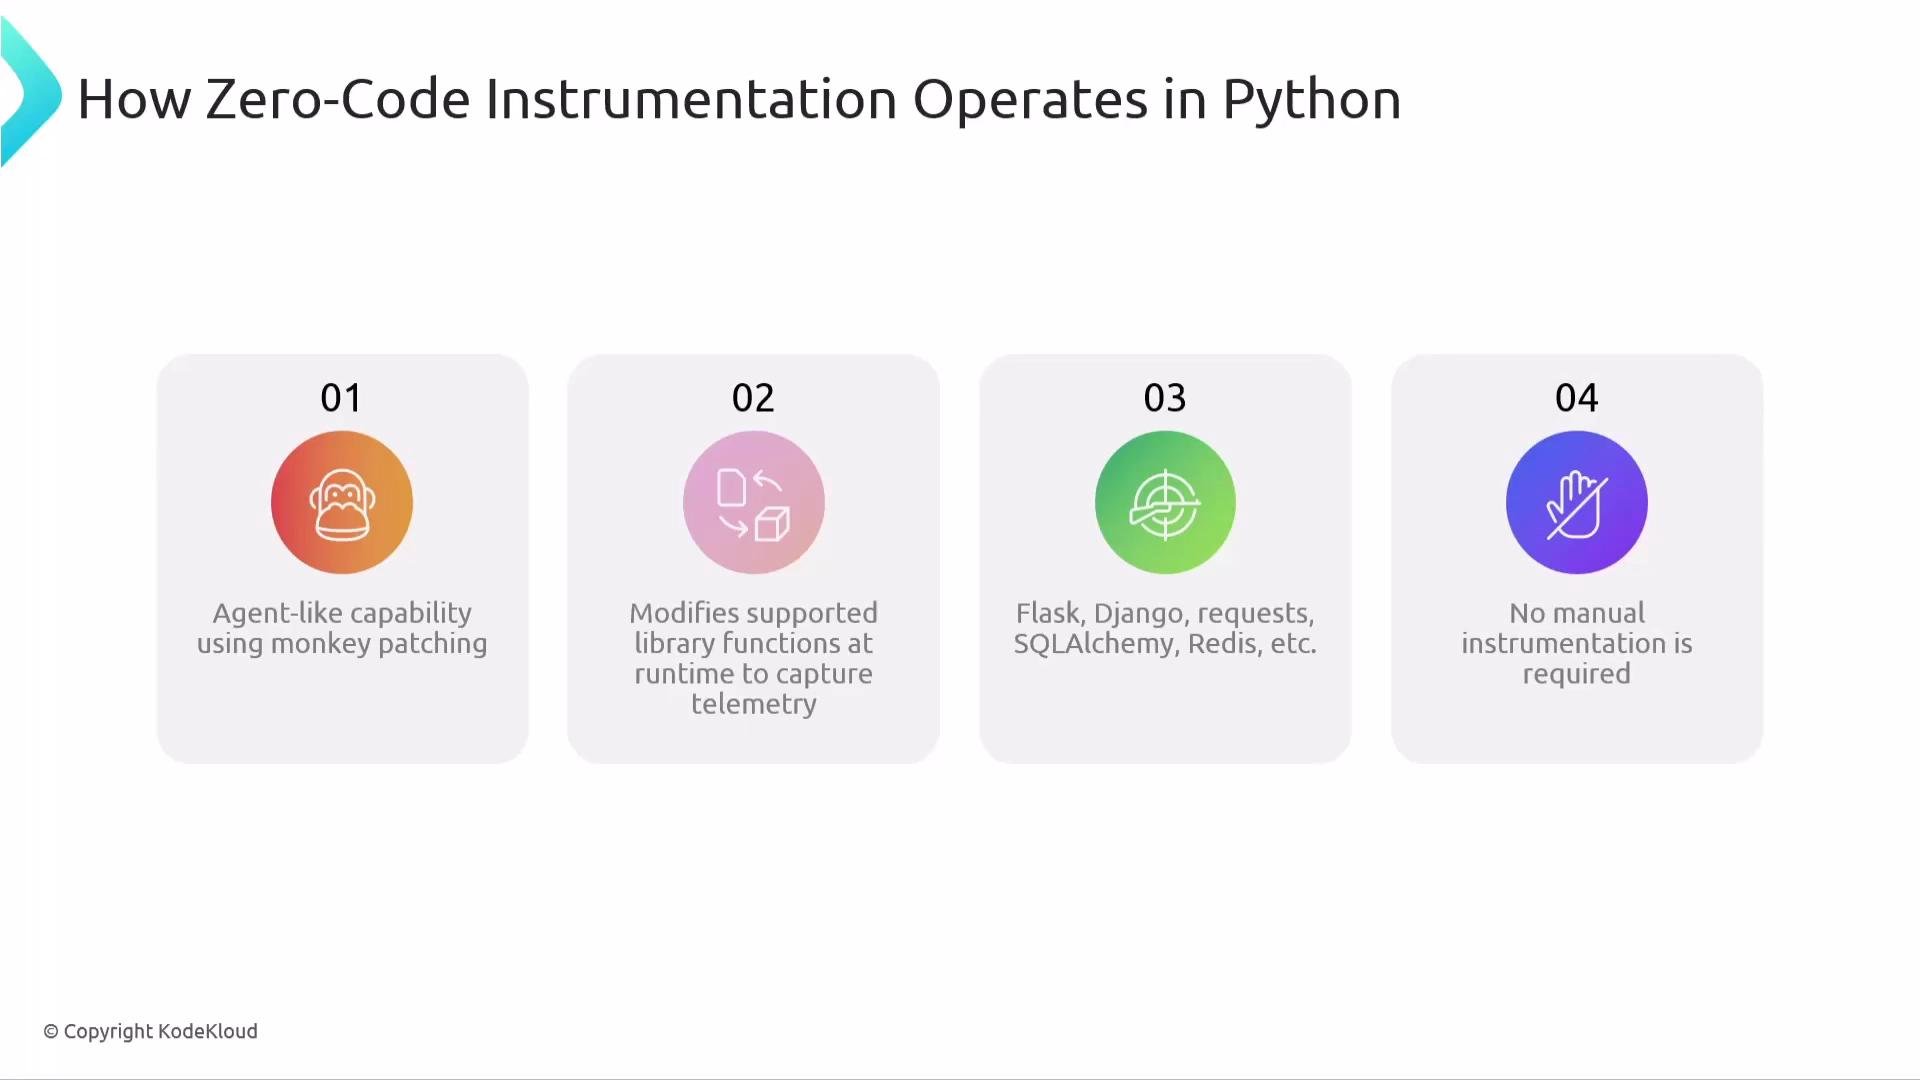
 OpenTelemetry for Python provides auto-instrumentation for many widely used libraries and frameworks (Flask, Django, Requests, SQLAlchemy, Redis, etc.), making it simple to gain observability with zero code changes. See the official docs: [OpenTelemetry for Python](https://opentelemetry.io/docs/instrumentation/python/).
How zero-code instrumentation works (high level)
1. The OpenTelemetry agent applies monkey patches to supported libraries at runtime.
2. Patches wrap or modify library functions so requests, DB queries, and messaging calls generate spans and metrics automatically.
3. If your app uses supported libraries, traces and metrics appear with no manual SDK calls.
OpenTelemetry for Python provides auto-instrumentation for many widely used libraries and frameworks (Flask, Django, Requests, SQLAlchemy, Redis, etc.), making it simple to gain observability with zero code changes. See the official docs: [OpenTelemetry for Python](https://opentelemetry.io/docs/instrumentation/python/).
How zero-code instrumentation works (high level)
1. The OpenTelemetry agent applies monkey patches to supported libraries at runtime.
2. Patches wrap or modify library functions so requests, DB queries, and messaging calls generate spans and metrics automatically.
3. If your app uses supported libraries, traces and metrics appear with no manual SDK calls.
 ## Installation
Install the OpenTelemetry distro and supporting packages, then let the bootstrap tool detect and install instrumentations for the dependencies in your environment.
```bash theme={null}
pip install opentelemetry-distro opentelemetry-exporter-otlp opentelemetry-instrumentation opentelemetry-bootstrap
opentelemetry-bootstrap -a install
```
The bootstrap step scans installed packages and adds relevant instrumentation libraries. After this, you can run the OpenTelemetry Python agent.
## Running the agent
Start your app with the `opentelemetry-instrument` wrapper to enable auto-instrumentation. Example that exports traces and metrics to the console (for development) and to an OTLP endpoint (typical for sending to an OTel Collector):
```bash theme={null}
opentelemetry-instrument \
--traces_exporter console,otlp \
--metrics_exporter console \
--service_name your-service-name \
--exporter_otlp_endpoint 0.0.0.0:4317 \
python myapp.py
```
For production, send telemetry to an OTLP Collector or backend instead of the console. Use the console exporter only for quick testing or troubleshooting.
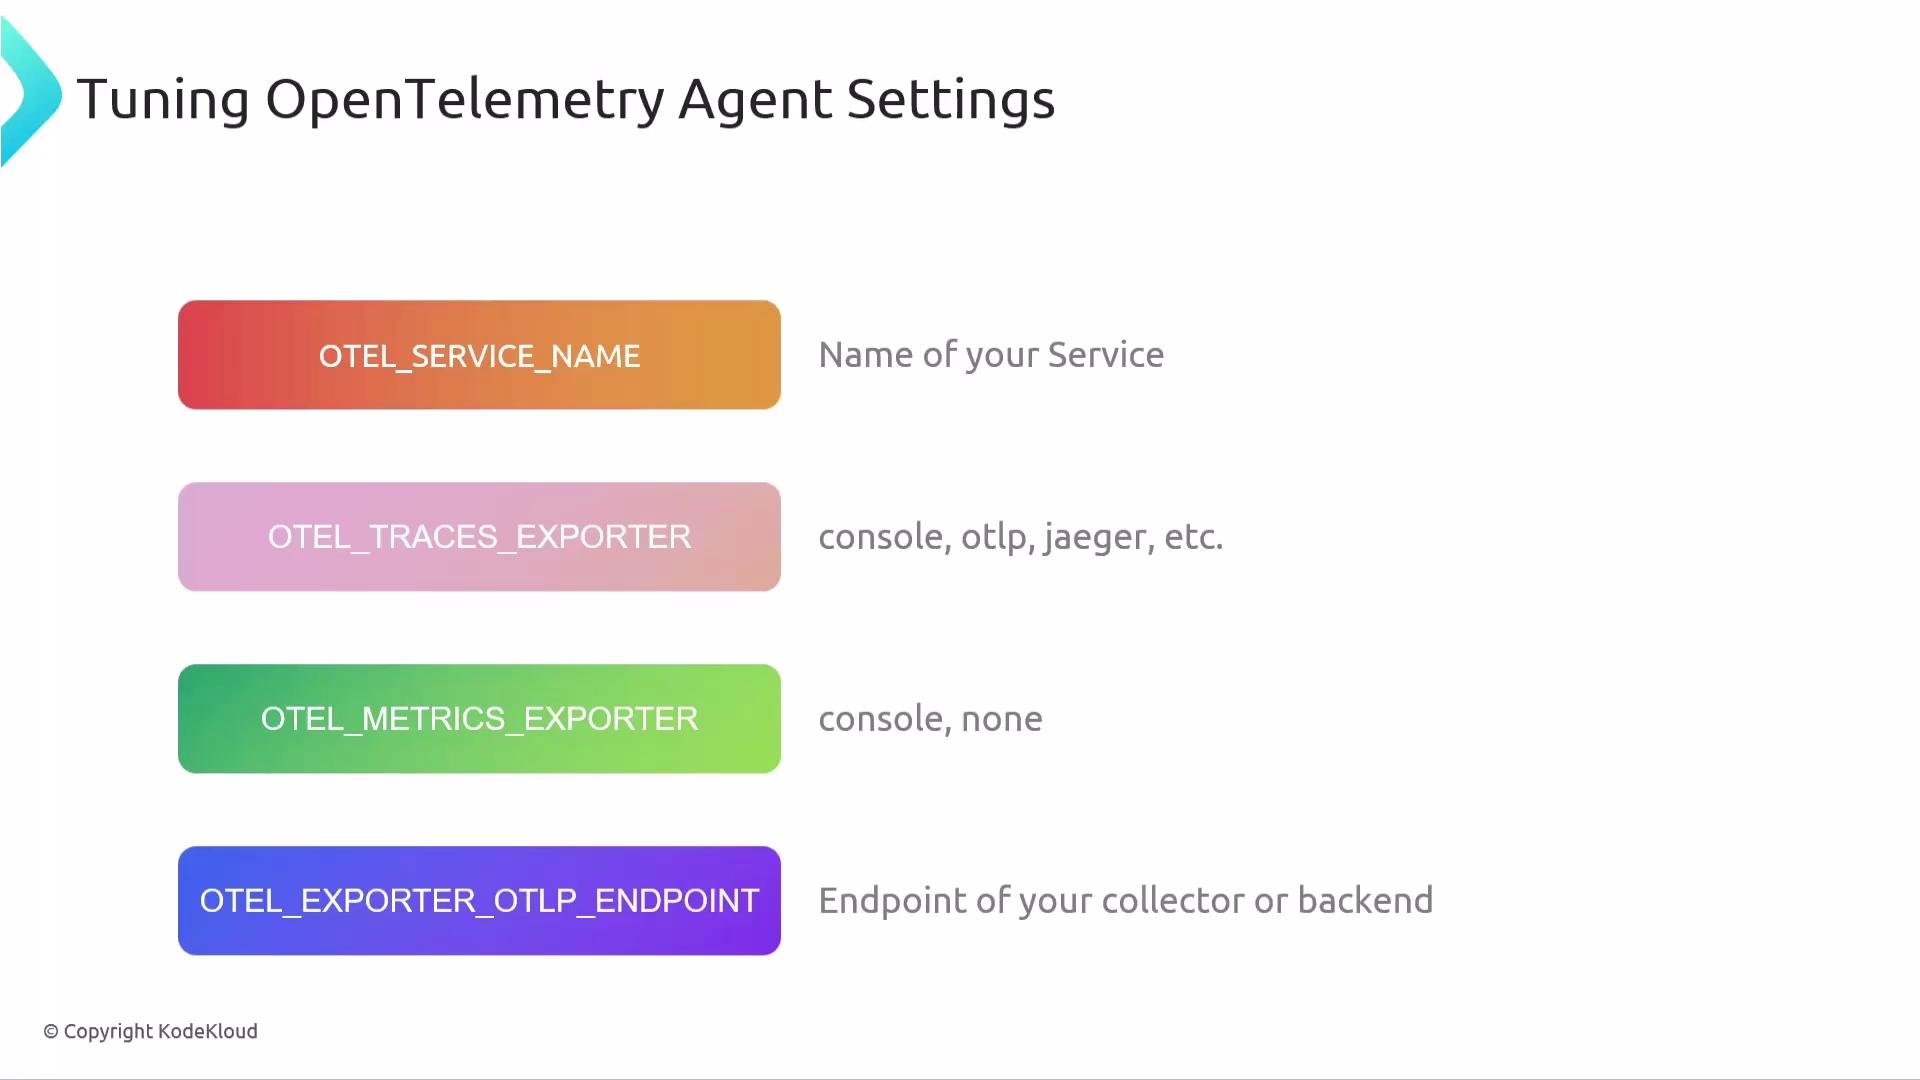
## Configuration via environment variables
Environment variables are commonly used in containers and CI/CD pipelines. They provide the same control as CLI flags and are typically easier to manage in deployments.
Example environment variables:
```bash theme={null}
export OTEL_SERVICE_NAME=your-service-name
export OTEL_TRACES_EXPORTER=console,otlp
export OTEL_METRICS_EXPORTER=console
export OTEL_EXPORTER_OTLP_ENDPOINT=0.0.0.0:4317
```
Then start the instrumented process:
```bash theme={null}
opentelemetry-instrument python myapp.py
```
Python-specific configuration examples
```bash theme={null}
# Exclude health/metrics endpoints from tracing
export OTEL_PYTHON_EXCLUDED_URLS="/health,/metrics"
# Trace specific Django request attributes
export OTEL_PYTHON_DJANGO_TRACED_REQUEST_ATTRS="path_info,content_type"
# Enable log correlation and format logs to include trace/span ids
export OTEL_PYTHON_LOG_CORRELATION=true
export OTEL_PYTHON_LOG_FORMAT="%(msg)s [trace_id=%(trace_id)s span_id=%(span_id)s]"
export OTEL_PYTHON_LOG_LEVEL=debug
# Disable specific auto-instrumentations when needed
export OTEL_PYTHON_DISABLED_INSTRUMENTATIONS=redis,grpc,kafka
```
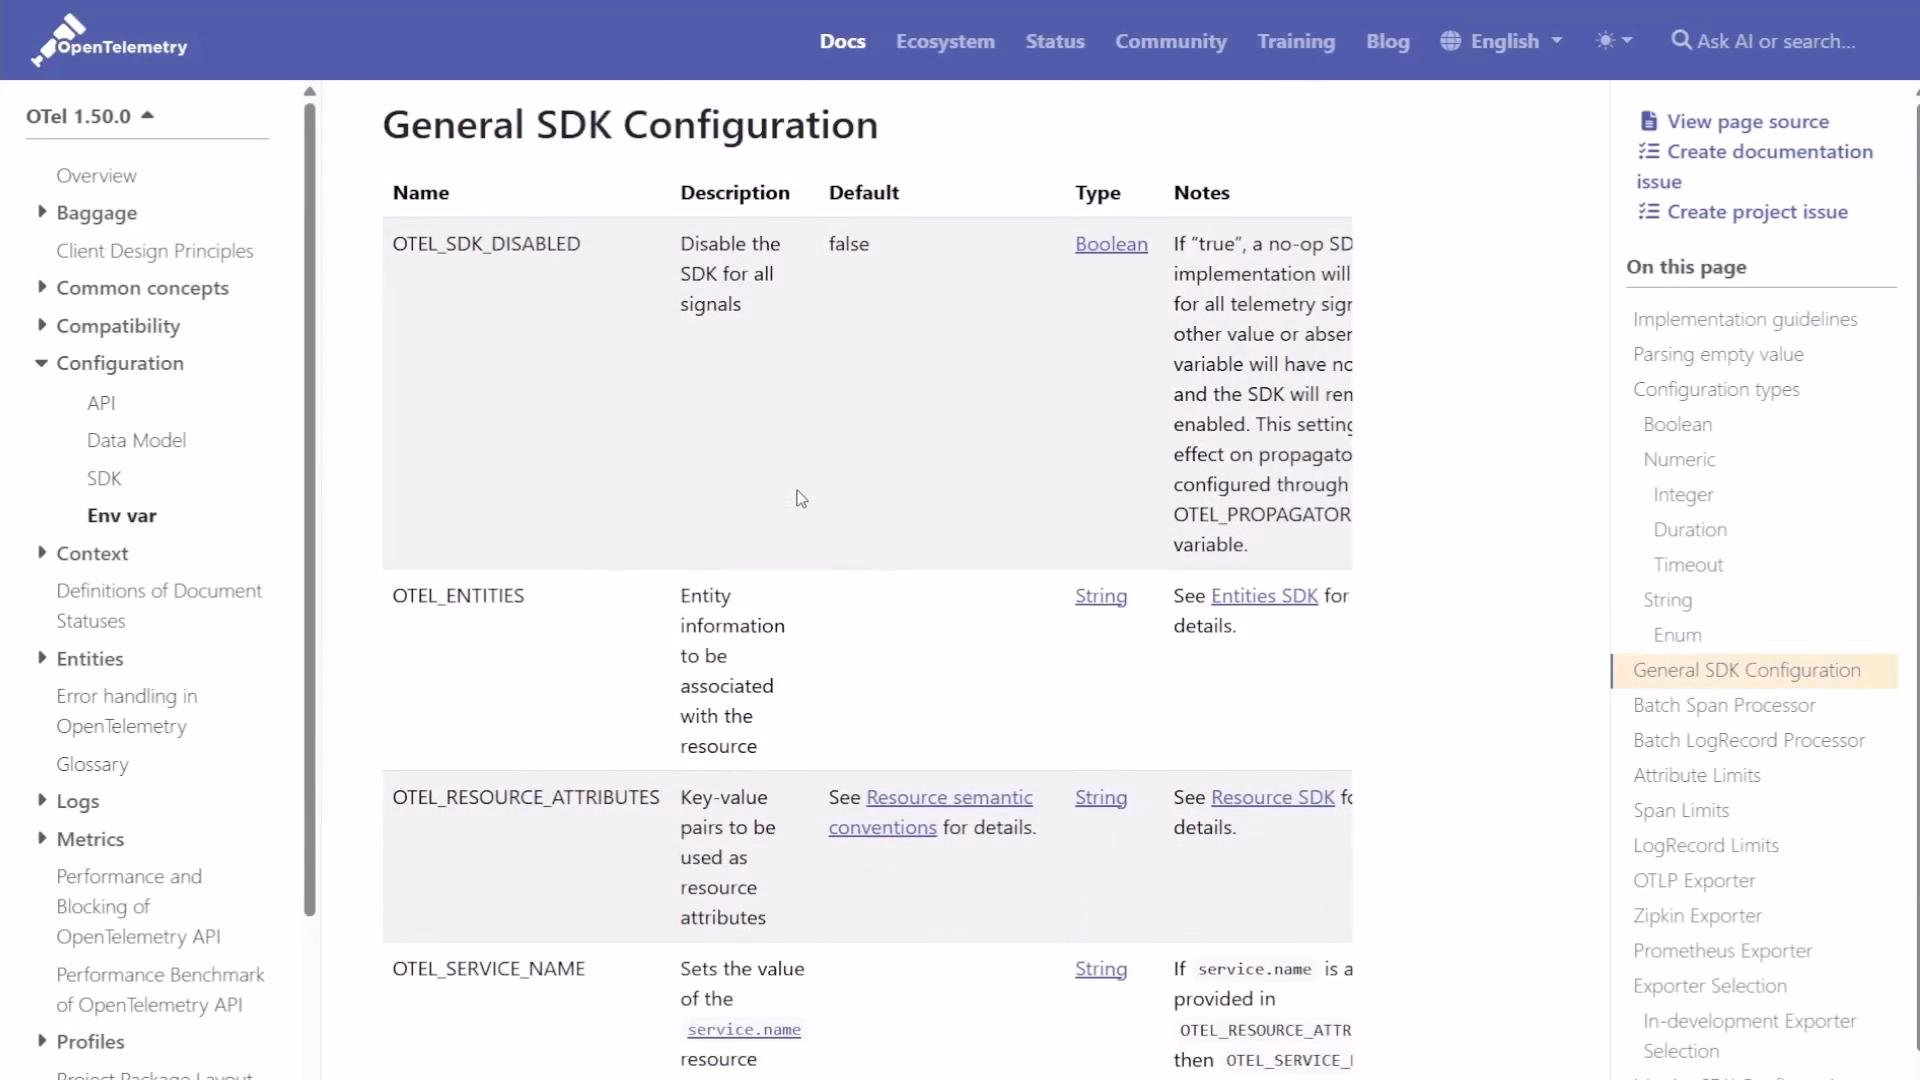
You can control sampling, exporters, and many other settings via environment variables—most are consistent across languages, with some Python-only options shown above.
## Installation
Install the OpenTelemetry distro and supporting packages, then let the bootstrap tool detect and install instrumentations for the dependencies in your environment.
```bash theme={null}
pip install opentelemetry-distro opentelemetry-exporter-otlp opentelemetry-instrumentation opentelemetry-bootstrap
opentelemetry-bootstrap -a install
```
The bootstrap step scans installed packages and adds relevant instrumentation libraries. After this, you can run the OpenTelemetry Python agent.
## Running the agent
Start your app with the `opentelemetry-instrument` wrapper to enable auto-instrumentation. Example that exports traces and metrics to the console (for development) and to an OTLP endpoint (typical for sending to an OTel Collector):
```bash theme={null}
opentelemetry-instrument \
--traces_exporter console,otlp \
--metrics_exporter console \
--service_name your-service-name \
--exporter_otlp_endpoint 0.0.0.0:4317 \
python myapp.py
```
For production, send telemetry to an OTLP Collector or backend instead of the console. Use the console exporter only for quick testing or troubleshooting.
## Configuration via environment variables
Environment variables are commonly used in containers and CI/CD pipelines. They provide the same control as CLI flags and are typically easier to manage in deployments.
Example environment variables:
```bash theme={null}
export OTEL_SERVICE_NAME=your-service-name
export OTEL_TRACES_EXPORTER=console,otlp
export OTEL_METRICS_EXPORTER=console
export OTEL_EXPORTER_OTLP_ENDPOINT=0.0.0.0:4317
```
Then start the instrumented process:
```bash theme={null}
opentelemetry-instrument python myapp.py
```
Python-specific configuration examples
```bash theme={null}
# Exclude health/metrics endpoints from tracing
export OTEL_PYTHON_EXCLUDED_URLS="/health,/metrics"
# Trace specific Django request attributes
export OTEL_PYTHON_DJANGO_TRACED_REQUEST_ATTRS="path_info,content_type"
# Enable log correlation and format logs to include trace/span ids
export OTEL_PYTHON_LOG_CORRELATION=true
export OTEL_PYTHON_LOG_FORMAT="%(msg)s [trace_id=%(trace_id)s span_id=%(span_id)s]"
export OTEL_PYTHON_LOG_LEVEL=debug
# Disable specific auto-instrumentations when needed
export OTEL_PYTHON_DISABLED_INSTRUMENTATIONS=redis,grpc,kafka
```
You can control sampling, exporters, and many other settings via environment variables—most are consistent across languages, with some Python-only options shown above.
 ## Supported libraries (auto-instrumentation)
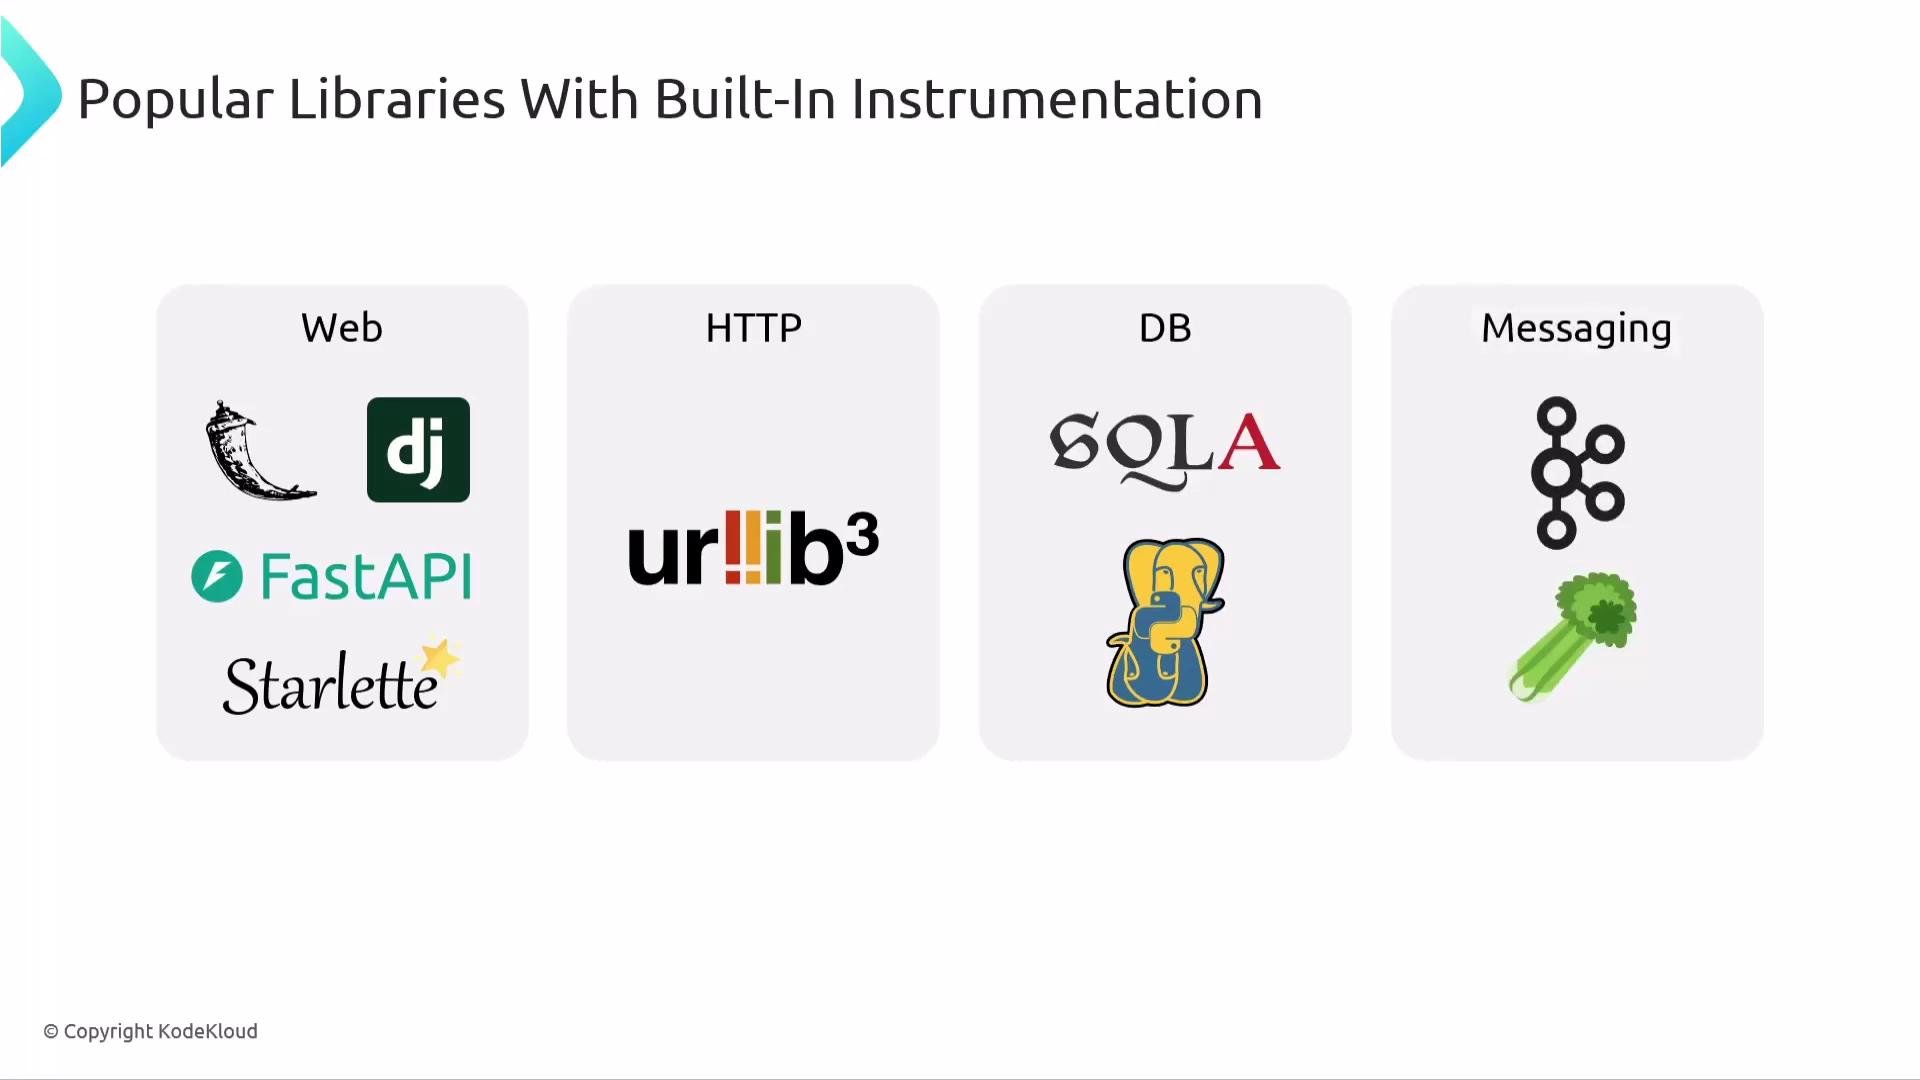
OpenTelemetry Python provides many built-in instrumentations and community-contributed packages. Typical coverage includes web frameworks, HTTP clients, database libraries, and messaging systems.
| Category | Examples |
| ---------------------: | -------------------------------------------- |
| Web frameworks | Flask, Django, FastAPI, Starlette |
| HTTP clients | `requests`, `urllib3` |
| Databases | SQLAlchemy and DB drivers (e.g., `psycopg2`) |
| Messaging & Background | Kafka, Celery |
This coverage gives immediate visibility across web requests, outbound HTTP calls, DB queries, and messaging layers.
## Supported libraries (auto-instrumentation)
OpenTelemetry Python provides many built-in instrumentations and community-contributed packages. Typical coverage includes web frameworks, HTTP clients, database libraries, and messaging systems.
| Category | Examples |
| ---------------------: | -------------------------------------------- |
| Web frameworks | Flask, Django, FastAPI, Starlette |
| HTTP clients | `requests`, `urllib3` |
| Databases | SQLAlchemy and DB drivers (e.g., `psycopg2`) |
| Messaging & Background | Kafka, Celery |
This coverage gives immediate visibility across web requests, outbound HTTP calls, DB queries, and messaging layers.
 ## Debugging automatic instrumentation
If a library isn’t being instrumented or spans/attributes are missing, enable debug logging to see detailed messages about what instrumentations are applied and any errors:
```bash theme={null}
export OTEL_LOG_LEVEL=debug
export OTEL_PYTHON_LOG_LEVEL=debug
```
Run your app under the instrument wrapper and inspect logs to identify missing hooks, import order issues, or conflicts between instrumentations.
## Repository & documentation
Key resources:
* Instrumentation libraries and contrib repo: [https://github.com/open-telemetry/opentelemetry-python-contrib](https://github.com/open-telemetry/opentelemetry-python-contrib)
* Auto-instrumentation CLI docs: [https://opentelemetry.io/docs/instrumentation/python/auto-instrumentation/](https://opentelemetry.io/docs/instrumentation/python/auto-instrumentation/)
* PyPI instrumentation package: [https://pypi.org/project/opentelemetry-instrumentation/](https://pypi.org/project/opentelemetry-instrumentation/)
* SDK configuration docs: [https://opentelemetry.io/docs/reference/specification/sdk-configuration/](https://opentelemetry.io/docs/reference/specification/sdk-configuration/)
Useful commands referenced in docs:
```text theme={null}
opentelemetry-bootstrap [-a|--action=][install|requirements]
opentelemetry-instrument python program.py
```
Installation via pip examples:
```bash theme={null}
pip install opentelemetry-instrumentation
pip install opentelemetry-distro opentelemetry-exporter-otlp
```
## Debugging automatic instrumentation
If a library isn’t being instrumented or spans/attributes are missing, enable debug logging to see detailed messages about what instrumentations are applied and any errors:
```bash theme={null}
export OTEL_LOG_LEVEL=debug
export OTEL_PYTHON_LOG_LEVEL=debug
```
Run your app under the instrument wrapper and inspect logs to identify missing hooks, import order issues, or conflicts between instrumentations.
## Repository & documentation
Key resources:
* Instrumentation libraries and contrib repo: [https://github.com/open-telemetry/opentelemetry-python-contrib](https://github.com/open-telemetry/opentelemetry-python-contrib)
* Auto-instrumentation CLI docs: [https://opentelemetry.io/docs/instrumentation/python/auto-instrumentation/](https://opentelemetry.io/docs/instrumentation/python/auto-instrumentation/)
* PyPI instrumentation package: [https://pypi.org/project/opentelemetry-instrumentation/](https://pypi.org/project/opentelemetry-instrumentation/)
* SDK configuration docs: [https://opentelemetry.io/docs/reference/specification/sdk-configuration/](https://opentelemetry.io/docs/reference/specification/sdk-configuration/)
Useful commands referenced in docs:
```text theme={null}
opentelemetry-bootstrap [-a|--action=][install|requirements]
opentelemetry-instrument python program.py
```
Installation via pip examples:
```bash theme={null}
pip install opentelemetry-instrumentation
pip install opentelemetry-distro opentelemetry-exporter-otlp
```
 ## Python vs Java (brief comparison)
| Topic | Python (auto-instrumentation) | Java (javaagent) |
| ---------------------- | ----------------------------------------------------------------------------- | ----------------------------------------------------------------------- |
| Mechanism | Monkey patching — wrap/replace functions at runtime | Bytecode instrumentation — modify classes at JVM startup (`-javaagent`) |
| Tooling | `opentelemetry-instrument`, `opentelemetry-distro`, `opentelemetry-bootstrap` | `opentelemetry-javaagent.jar` |
| Configuration | CLI flags or environment variables (e.g., `OTEL_*`, `OTEL_PYTHON_*`) | JVM agent flags and environment variables |
| Manual instrumentation | Optional via SDK APIs for custom spans | Optional via SDK APIs for custom spans |
| Log correlation | `OTEL_PYTHON_LOG_CORRELATION=true` and log formatter support | Supported via JVM logging frameworks and agent config |
## Summary
OpenTelemetry Python zero-code instrumentation (auto-instrumentation) provides immediate observability for many common libraries without modifying application source code. Workflow summary:
1. Install distro + exporters + instrumentation packages.
2. Run `opentelemetry-bootstrap -a install` to add relevant instrumentations.
3. Start your app with `opentelemetry-instrument` or use equivalent environment variables.
4. Tune Python-specific options (exclusions, log correlation, disabled instrumentations) as needed.
These steps let you quickly capture telemetry (traces and metrics) across web, HTTP client, DB, and messaging layers with minimal operational overhead.
## Python vs Java (brief comparison)
| Topic | Python (auto-instrumentation) | Java (javaagent) |
| ---------------------- | ----------------------------------------------------------------------------- | ----------------------------------------------------------------------- |
| Mechanism | Monkey patching — wrap/replace functions at runtime | Bytecode instrumentation — modify classes at JVM startup (`-javaagent`) |
| Tooling | `opentelemetry-instrument`, `opentelemetry-distro`, `opentelemetry-bootstrap` | `opentelemetry-javaagent.jar` |
| Configuration | CLI flags or environment variables (e.g., `OTEL_*`, `OTEL_PYTHON_*`) | JVM agent flags and environment variables |
| Manual instrumentation | Optional via SDK APIs for custom spans | Optional via SDK APIs for custom spans |
| Log correlation | `OTEL_PYTHON_LOG_CORRELATION=true` and log formatter support | Supported via JVM logging frameworks and agent config |
## Summary
OpenTelemetry Python zero-code instrumentation (auto-instrumentation) provides immediate observability for many common libraries without modifying application source code. Workflow summary:
1. Install distro + exporters + instrumentation packages.
2. Run `opentelemetry-bootstrap -a install` to add relevant instrumentations.
3. Start your app with `opentelemetry-instrument` or use equivalent environment variables.
4. Tune Python-specific options (exclusions, log correlation, disabled instrumentations) as needed.
These steps let you quickly capture telemetry (traces and metrics) across web, HTTP client, DB, and messaging layers with minimal operational overhead.