> ## Documentation Index
> Fetch the complete documentation index at: https://notes.kodekloud.com/llms.txt
> Use this file to discover all available pages before exploring further.
# Zero CodeAutomatic Instrumentation
> Zero-code automatic instrumentation using agents to add OpenTelemetry traces metrics and logs at runtime without source changes via bytecode manipulation monkey patching or eBPF for rapid observability
Code-based and library-based instrumentation require changing application source code: you need access to the code and knowledge of where to add instrumentation. In many real-world situations you may not have source access or permission to modify the application. In those cases, automatic (zero-code) instrumentation is often the fastest and least intrusive way to add observability.
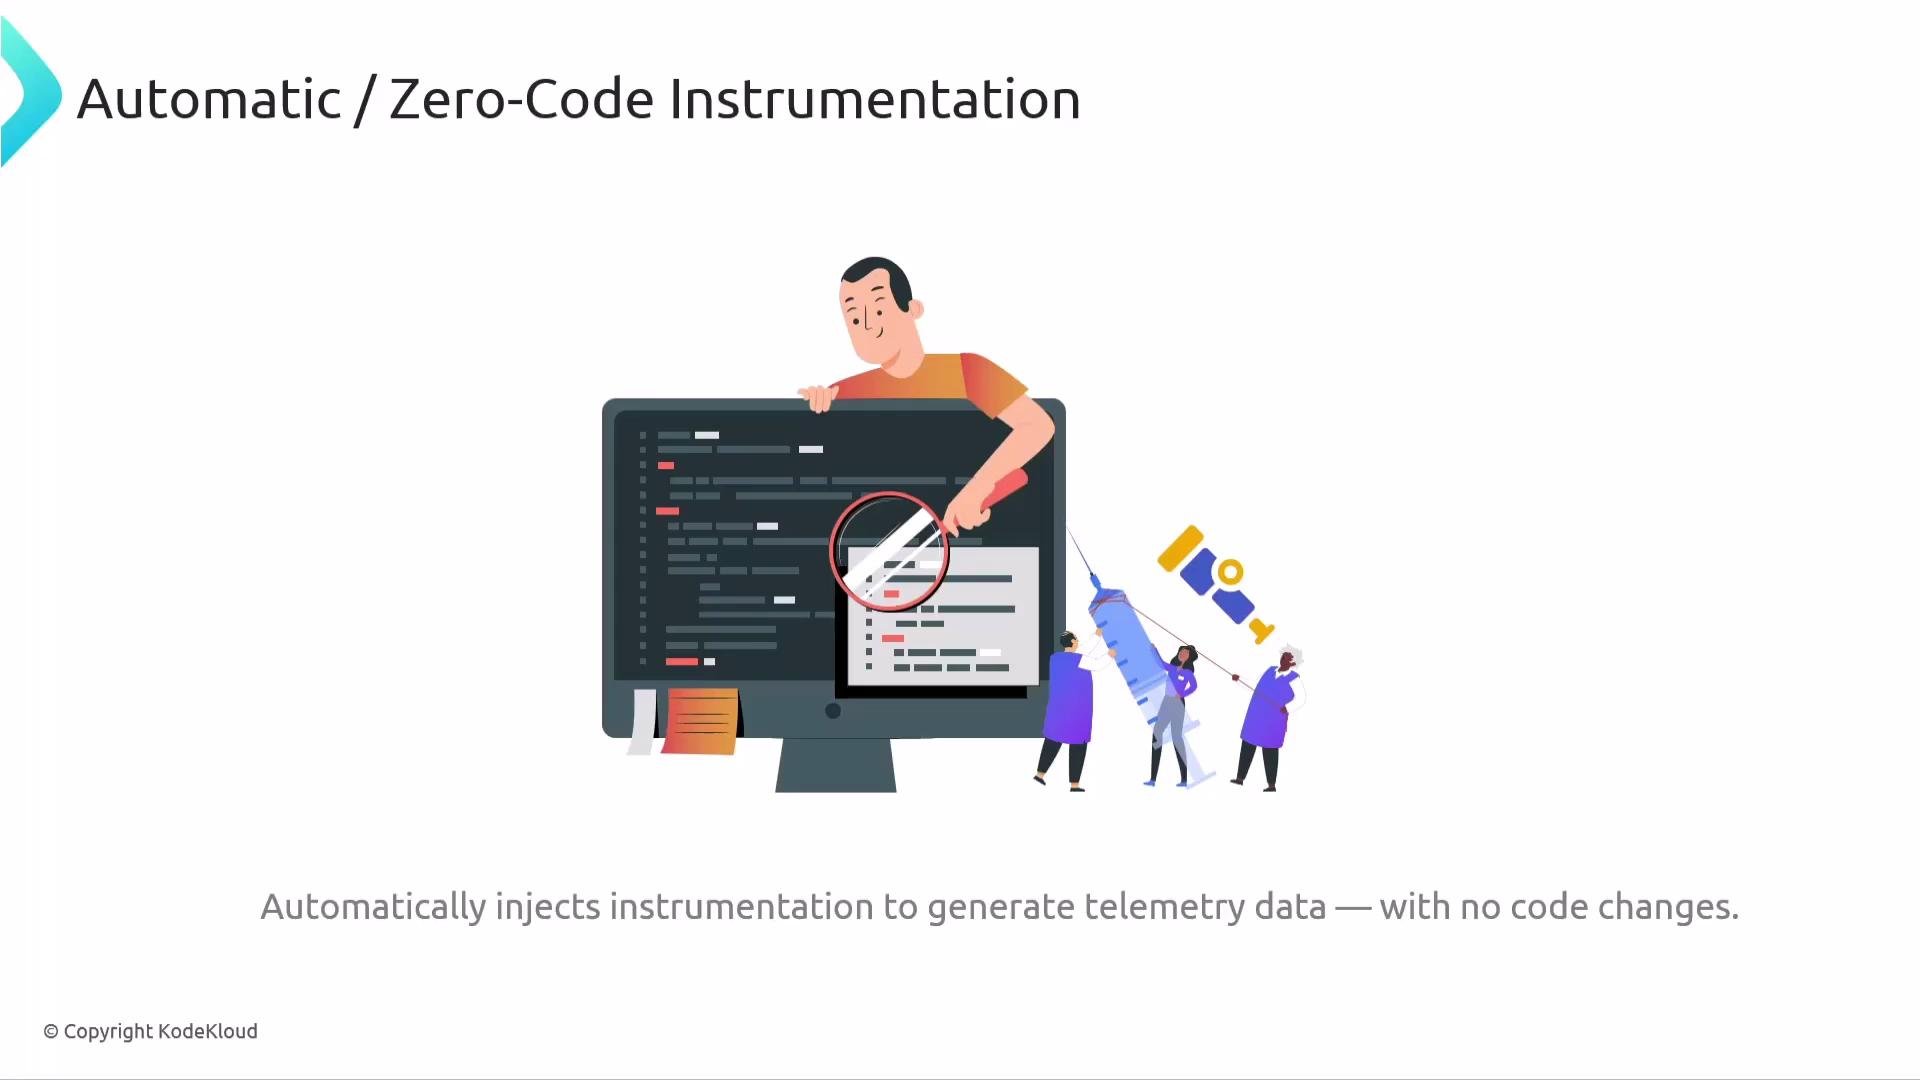
In zero-code instrumentation, an agent injects telemetry at runtime so an application begins producing traces, metrics, and logs without any source changes. You do not need to learn the OpenTelemetry API/SDKs or modify the application to get basic observability.
 What does zero-code instrumentation look like in practice? Here are two common, practical examples for JVM and Python applications.
* Java (JVM): attach the OpenTelemetry Java agent when starting the JVM:
```bash theme={null}
java -javaagent:/path/to/opentelemetry-javaagent.jar -jar myapp.jar
```
The Java agent instruments supported frameworks and libraries at class-load time by modifying bytecode. No source changes are required.
* Python: use the OpenTelemetry CLI wrapper to instrument supported libraries at runtime:
```bash theme={null}
opentelemetry-instrument python app.py
```
The CLI performs monkey-patching of common libraries (Flask, Django, Requests, etc.) so the running process emits telemetry without modifying `app.py`.
Both examples turn an existing application into a telemetry-producing source with no code edits. This makes automatic instrumentation a fast way to add observability—often in minutes.
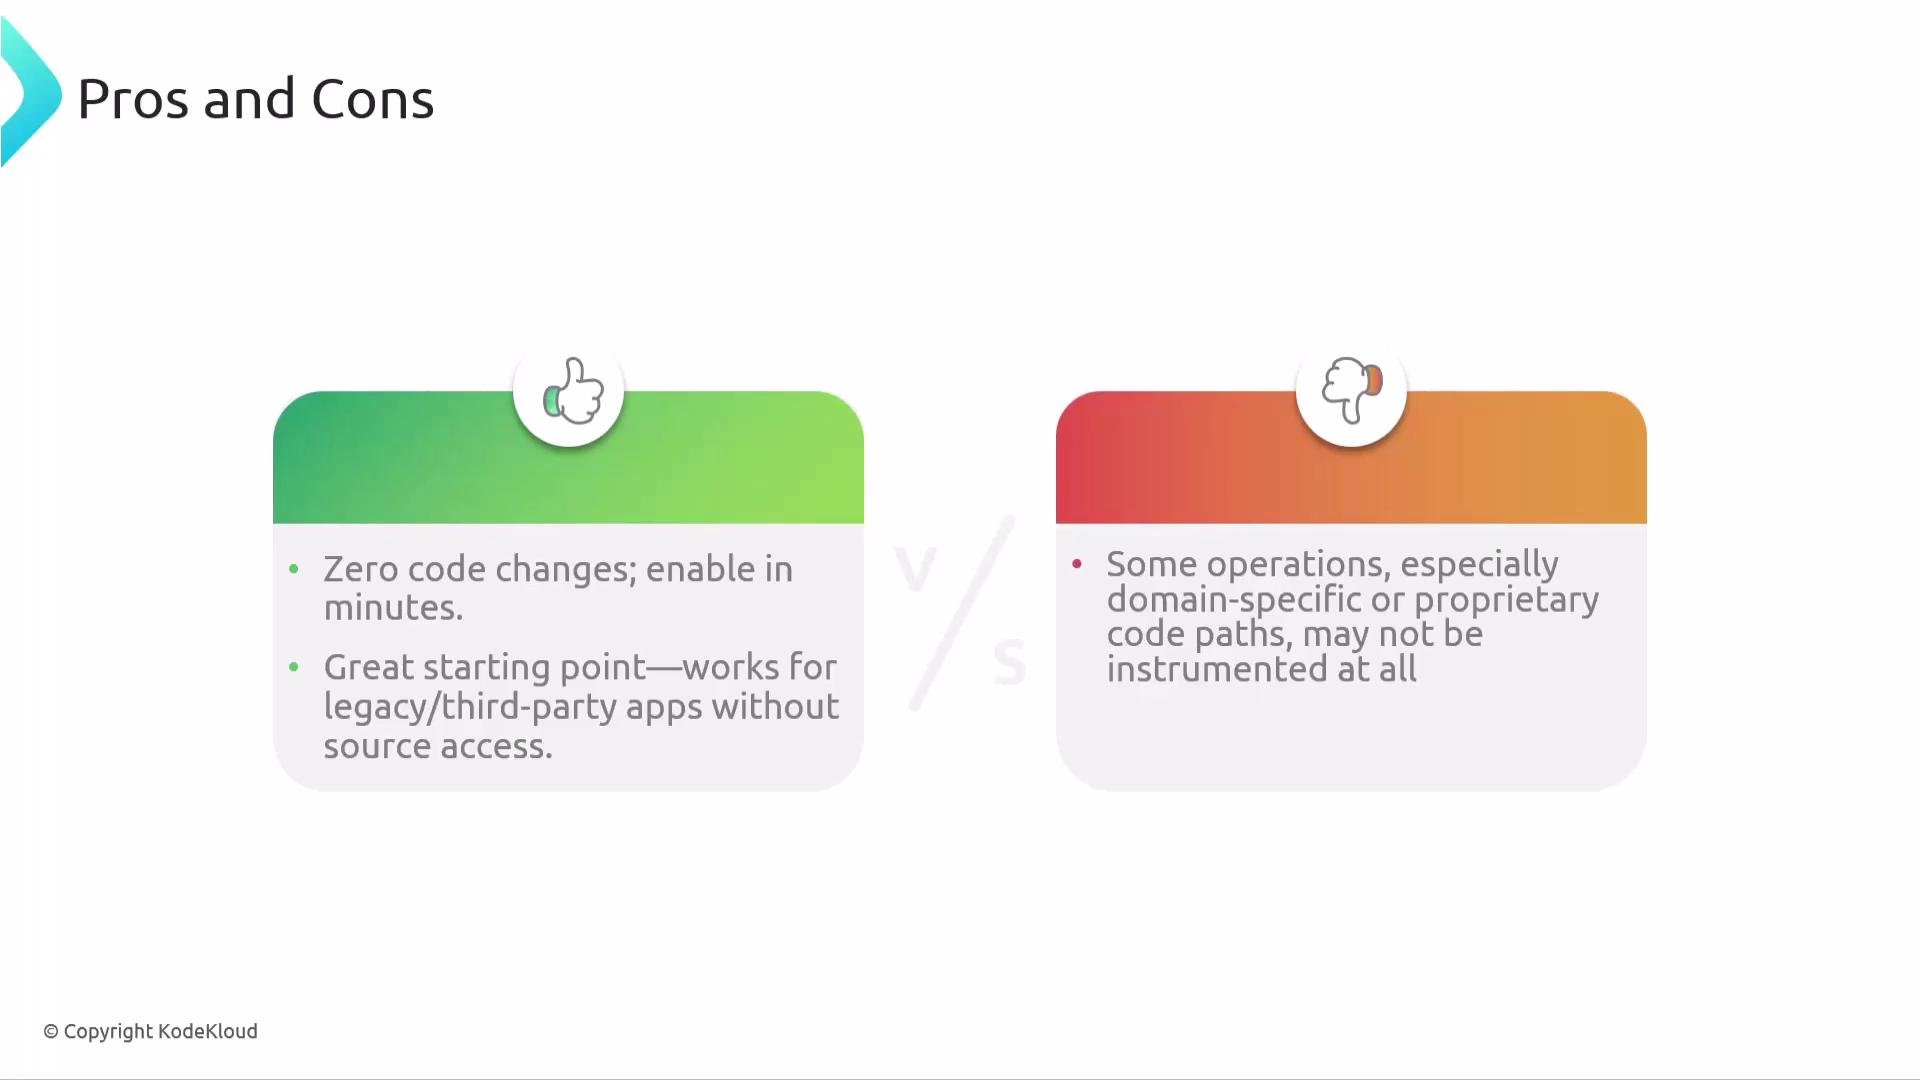
The main advantage is speed: enable it quickly without touching the code. It's ideal for legacy apps, third-party binaries, or environments where developers cannot modify source. The trade-off is that domain-specific or business-logic spans are generally not created automatically; automatic instrumentation covers widely used frameworks and libraries but cannot infer custom business operations.
What does zero-code instrumentation look like in practice? Here are two common, practical examples for JVM and Python applications.
* Java (JVM): attach the OpenTelemetry Java agent when starting the JVM:
```bash theme={null}
java -javaagent:/path/to/opentelemetry-javaagent.jar -jar myapp.jar
```
The Java agent instruments supported frameworks and libraries at class-load time by modifying bytecode. No source changes are required.
* Python: use the OpenTelemetry CLI wrapper to instrument supported libraries at runtime:
```bash theme={null}
opentelemetry-instrument python app.py
```
The CLI performs monkey-patching of common libraries (Flask, Django, Requests, etc.) so the running process emits telemetry without modifying `app.py`.
Both examples turn an existing application into a telemetry-producing source with no code edits. This makes automatic instrumentation a fast way to add observability—often in minutes.
The main advantage is speed: enable it quickly without touching the code. It's ideal for legacy apps, third-party binaries, or environments where developers cannot modify source. The trade-off is that domain-specific or business-logic spans are generally not created automatically; automatic instrumentation covers widely used frameworks and libraries but cannot infer custom business operations.
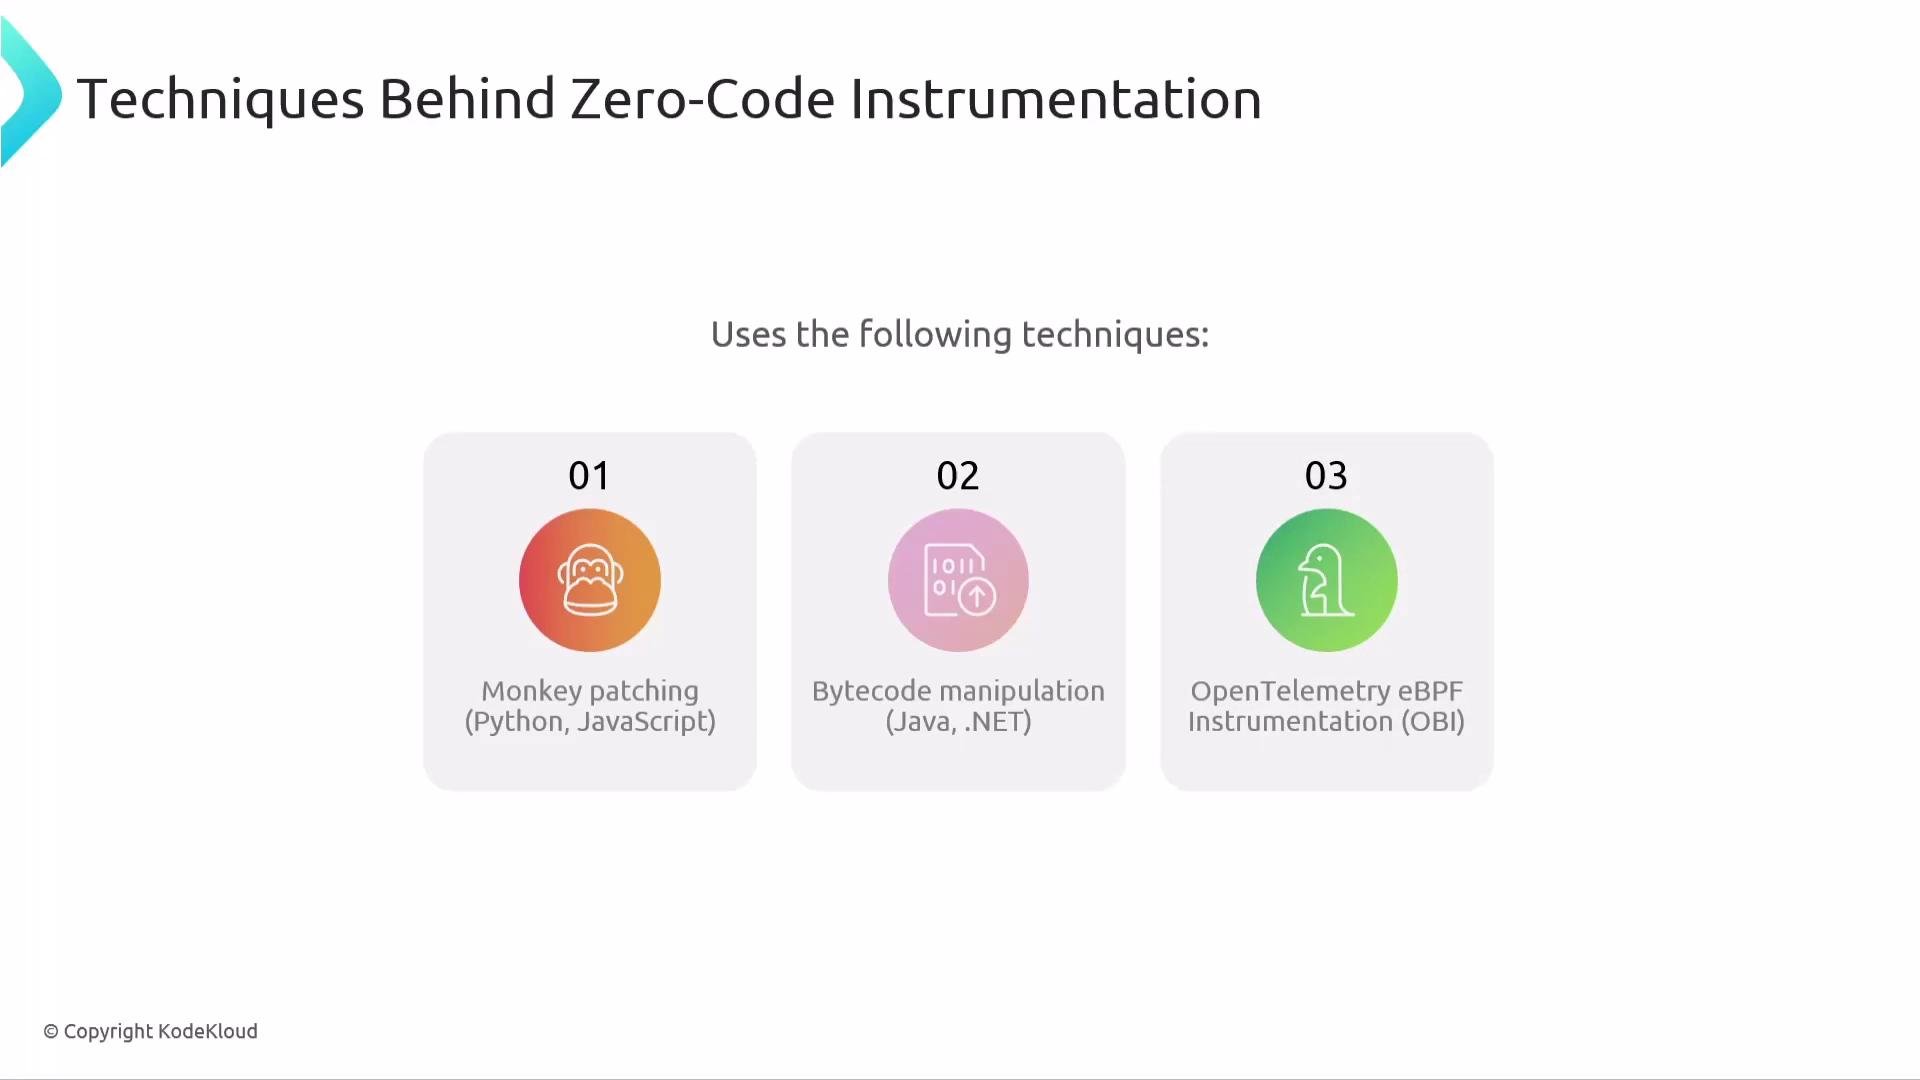
 How does the agent inject instrumentation without changing source code? Common techniques include:
* Monkey patching: used in dynamic languages such as Python and JavaScript. At runtime, the agent replaces or wraps library functions to call telemetry APIs.
* Bytecode manipulation: used in statically compiled runtimes such as Java and .NET. The agent modifies bytecode as classes/assemblies are loaded to insert telemetry before/after method execution.
* eBPF-based instrumentation: OpenTelemetry’s eBPF initiative observes system-level events (network, syscalls) from the kernel, providing language-agnostic and non-intrusive telemetry—useful in containerized or polyglot environments (see [https://github.com/open-telemetry/opentelemetry-ebpf](https://github.com/open-telemetry/opentelemetry-ebpf)).
Each technique has different trade-offs in terms of fidelity, overhead, and visibility into application internals.
How does the agent inject instrumentation without changing source code? Common techniques include:
* Monkey patching: used in dynamic languages such as Python and JavaScript. At runtime, the agent replaces or wraps library functions to call telemetry APIs.
* Bytecode manipulation: used in statically compiled runtimes such as Java and .NET. The agent modifies bytecode as classes/assemblies are loaded to insert telemetry before/after method execution.
* eBPF-based instrumentation: OpenTelemetry’s eBPF initiative observes system-level events (network, syscalls) from the kernel, providing language-agnostic and non-intrusive telemetry—useful in containerized or polyglot environments (see [https://github.com/open-telemetry/opentelemetry-ebpf](https://github.com/open-telemetry/opentelemetry-ebpf)).
Each technique has different trade-offs in terms of fidelity, overhead, and visibility into application internals.
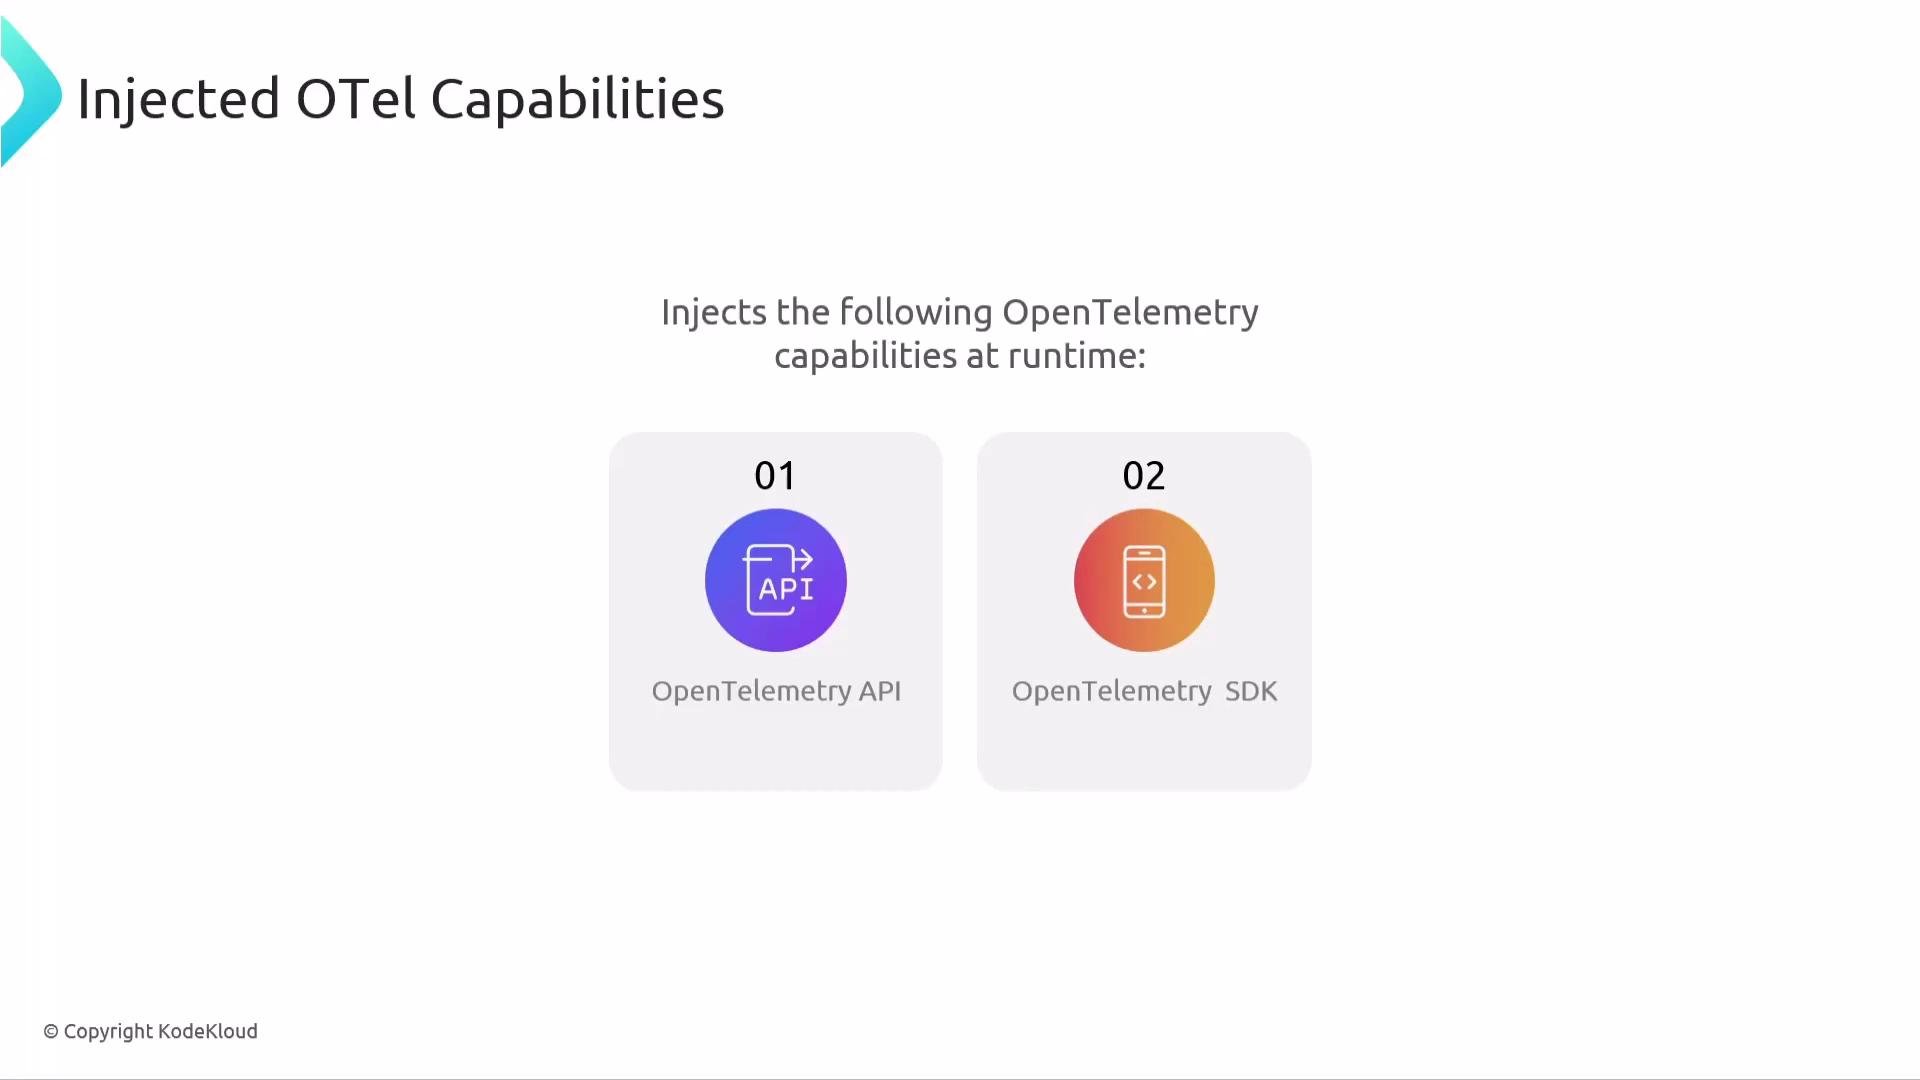
 When these techniques run, agents typically provide the OpenTelemetry API and SDK implementations at runtime (or hook into existing ones). That means exporters, processors, and resource configuration become available so spans, metrics, and logs can be produced and exported without touching application source code.
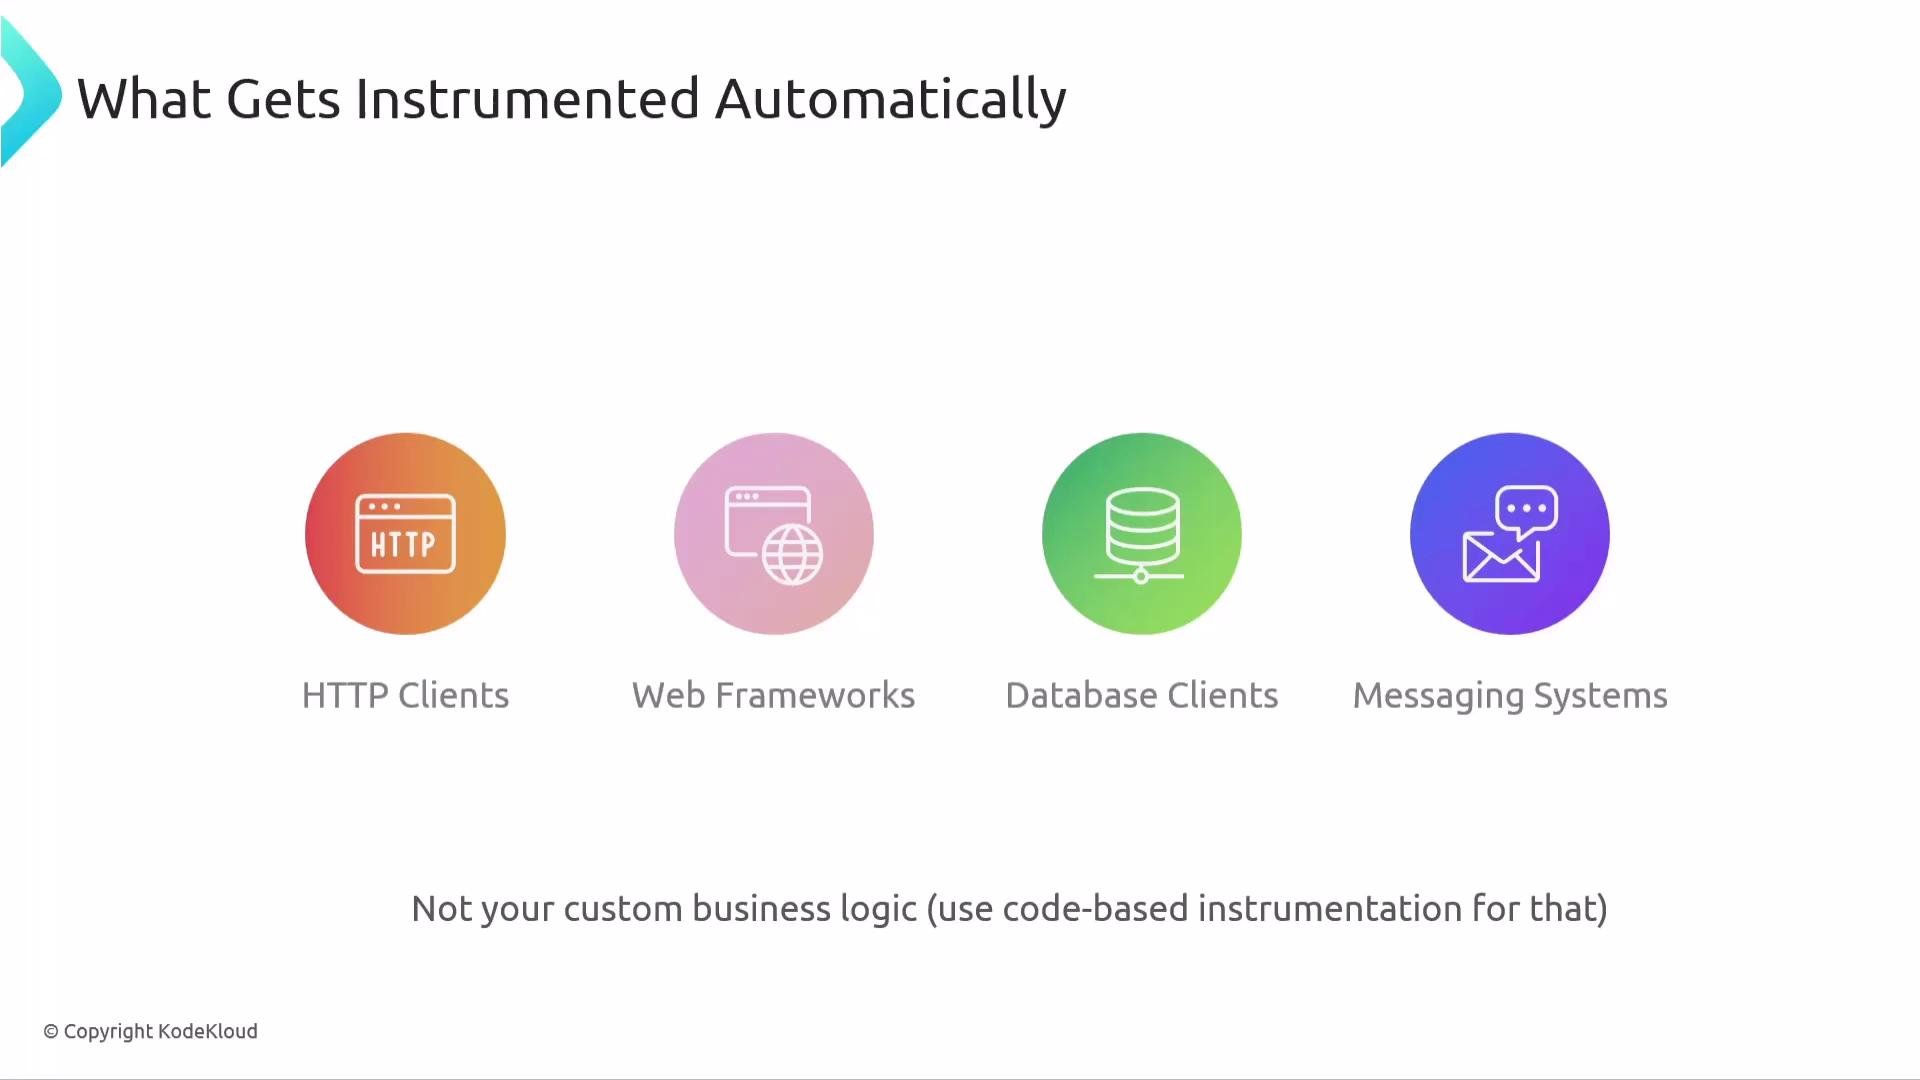
 What parts of an application get instrumented automatically? Typical coverage includes:
| Category | Typical Examples |
| ----------------: | ----------------------------------- |
| HTTP clients | Requests, `http.client`, axios |
| Web frameworks | Flask, Django, Express, Spring Boot |
| Database clients | SQLAlchemy, JDBC drivers |
| Messaging systems | Kafka, RabbitMQ, AMQP libraries |
Automatic instrumentation usually does not capture application-specific business logic—those spans must be added with code-based instrumentation if you need fine-grained, domain-specific traces.
What parts of an application get instrumented automatically? Typical coverage includes:
| Category | Typical Examples |
| ----------------: | ----------------------------------- |
| HTTP clients | Requests, `http.client`, axios |
| Web frameworks | Flask, Django, Express, Spring Boot |
| Database clients | SQLAlchemy, JDBC drivers |
| Messaging systems | Kafka, RabbitMQ, AMQP libraries |
Automatic instrumentation usually does not capture application-specific business logic—those spans must be added with code-based instrumentation if you need fine-grained, domain-specific traces.
 Configuration: even without source access, zero-code instrumentation still offers flexibility. Typical mechanisms include:
* Environment variables (most common)
* System properties (common for Java/.NET)
* Startup arguments (runtime customization)
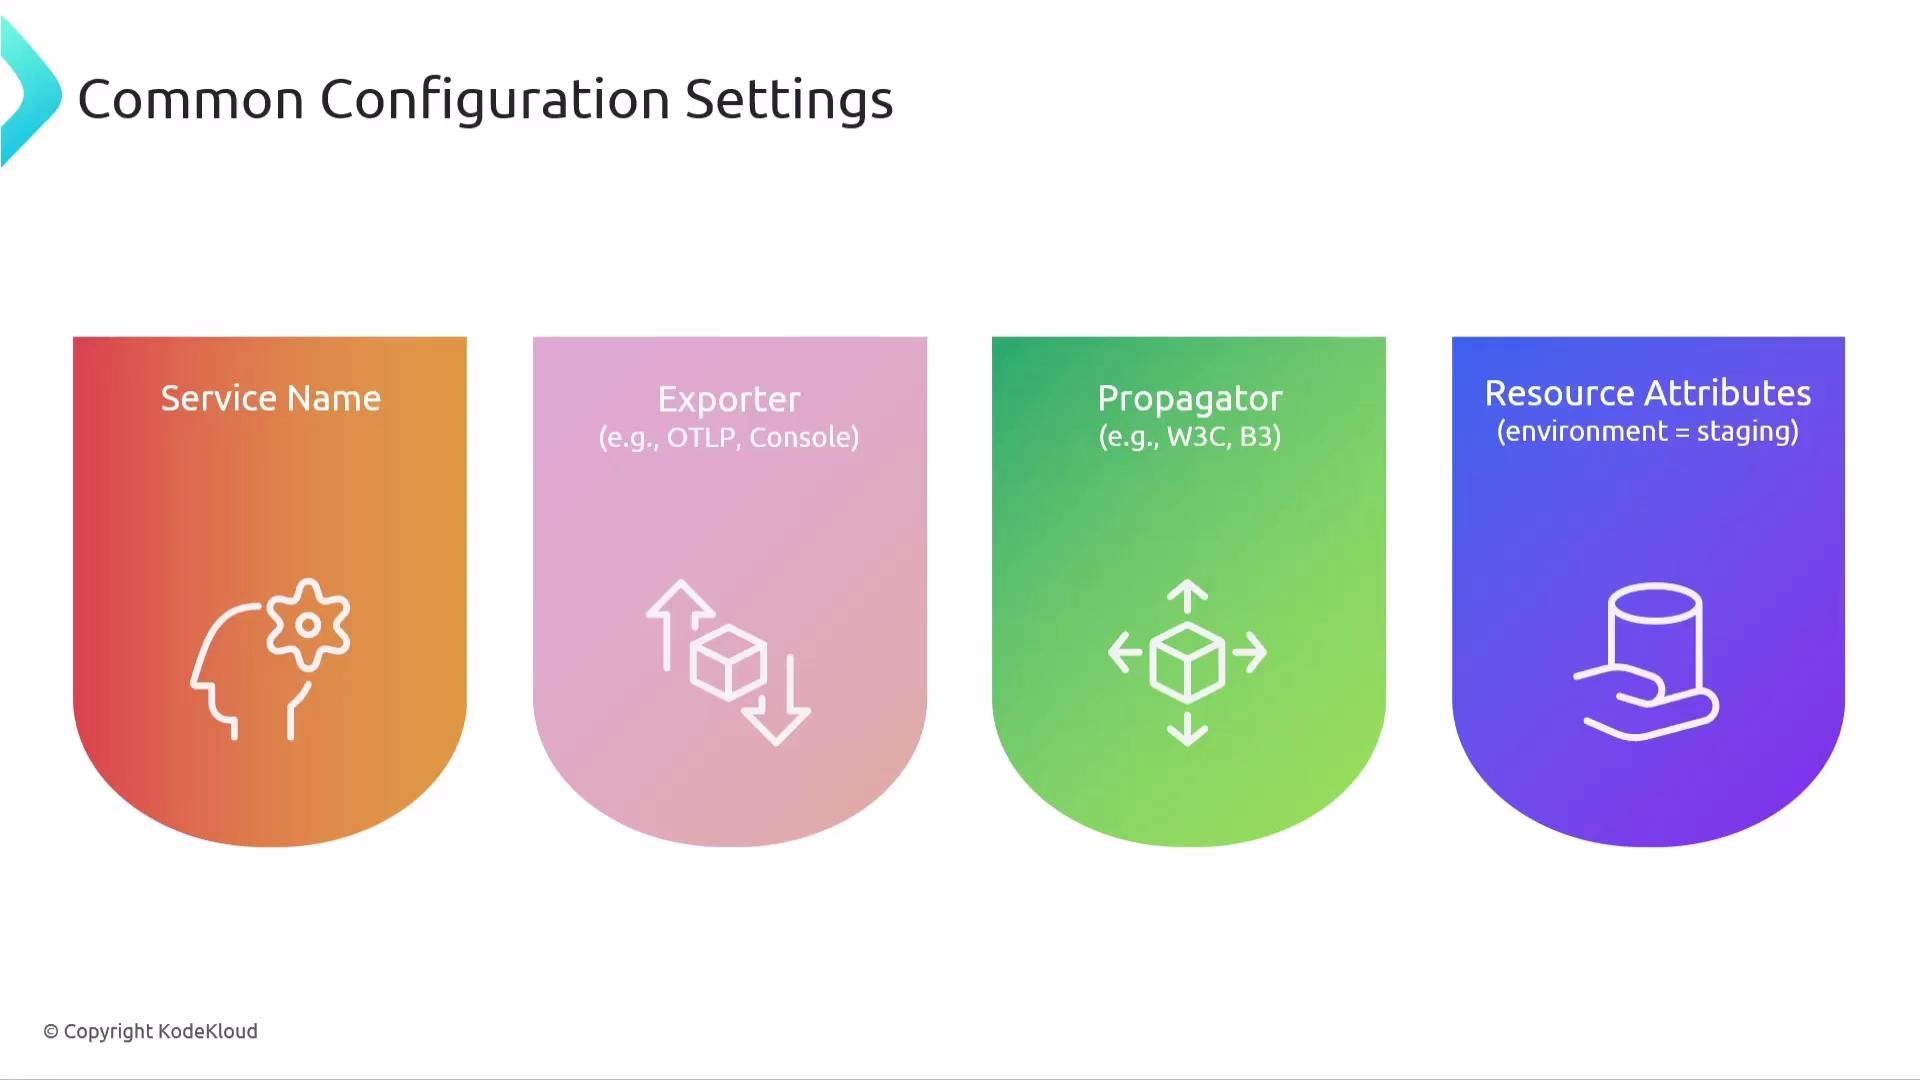
Using these you can set service metadata, exporters, propagators, resource attributes, sampling, and other runtime behaviors. Example configuration options you might set via environment variables:
* Service name (so traces are grouped under a logical service in your observability backend)
* Exporter (OTLP, console, etc.)
* Propagators (W3C trace-context, B3)
* Resource attributes (environment, region, team, etc.)
Example environment variable snippets:
```bash theme={null}
# Example: set service name and OTLP exporter
OTEL_SERVICE_NAME="orders-service"
OTEL_EXPORTER_OTLP_ENDPOINT="https://otel-collector.example.com:4317"
OTEL_TRACES_EXPORTER="otlp"
OTEL_PROPAGATORS="tracecontext,baggage"
```
Configuration: even without source access, zero-code instrumentation still offers flexibility. Typical mechanisms include:
* Environment variables (most common)
* System properties (common for Java/.NET)
* Startup arguments (runtime customization)
Using these you can set service metadata, exporters, propagators, resource attributes, sampling, and other runtime behaviors. Example configuration options you might set via environment variables:
* Service name (so traces are grouped under a logical service in your observability backend)
* Exporter (OTLP, console, etc.)
* Propagators (W3C trace-context, B3)
* Resource attributes (environment, region, team, etc.)
Example environment variable snippets:
```bash theme={null}
# Example: set service name and OTLP exporter
OTEL_SERVICE_NAME="orders-service"
OTEL_EXPORTER_OTLP_ENDPOINT="https://otel-collector.example.com:4317"
OTEL_TRACES_EXPORTER="otlp"
OTEL_PROPAGATORS="tracecontext,baggage"
```
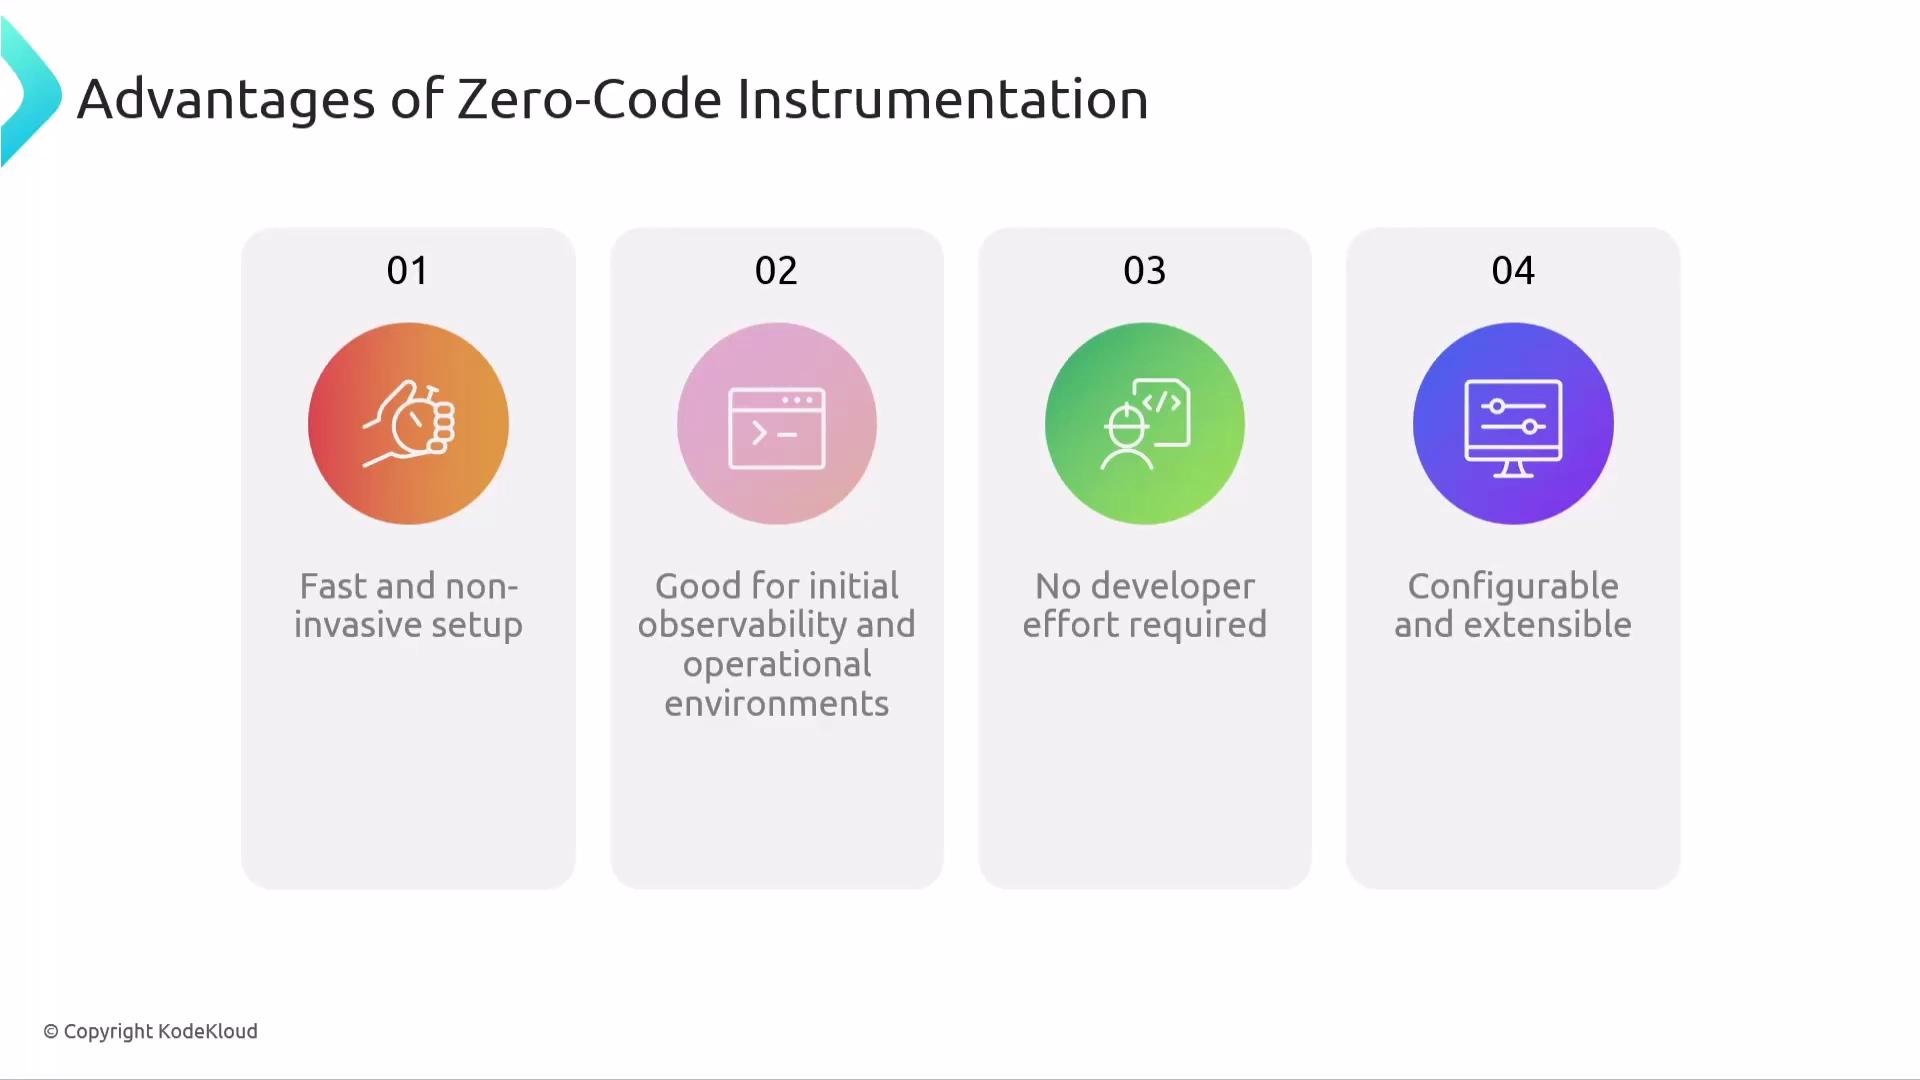
 Why is zero-code instrumentation popular?
* Fast and non-invasive: enables telemetry quickly without code changes.
* Great for initial observability: provides immediate visibility into production systems.
* Low developer effort: only change how the app is started or its runtime environment.
* Configurable and extensible: environment variables and startup options let you tailor behavior.
Why is zero-code instrumentation popular?
* Fast and non-invasive: enables telemetry quickly without code changes.
* Great for initial observability: provides immediate visibility into production systems.
* Low developer effort: only change how the app is started or its runtime environment.
* Configurable and extensible: environment variables and startup options let you tailor behavior.
 Zero-code instrumentation is an excellent first step for gaining observability quickly. Use it to get baseline telemetry, then add code-based instrumentation selectively where you need domain-specific traces or richer context.
That covers the essentials of zero-code automatic instrumentation. Use it to bootstrap observability, and augment with code-based instrumentation when you need custom, business-level spans.
Links and references
* OpenTelemetry: [https://opentelemetry.io/](https://opentelemetry.io/)
* OpenTelemetry eBPF project: [https://github.com/open-telemetry/opentelemetry-ebpf](https://github.com/open-telemetry/opentelemetry-ebpf)
Zero-code instrumentation is an excellent first step for gaining observability quickly. Use it to get baseline telemetry, then add code-based instrumentation selectively where you need domain-specific traces or richer context.
That covers the essentials of zero-code automatic instrumentation. Use it to bootstrap observability, and augment with code-based instrumentation when you need custom, business-level spans.
Links and references
* OpenTelemetry: [https://opentelemetry.io/](https://opentelemetry.io/)
* OpenTelemetry eBPF project: [https://github.com/open-telemetry/opentelemetry-ebpf](https://github.com/open-telemetry/opentelemetry-ebpf)