> ## Documentation Index
> Fetch the complete documentation index at: https://notes.kodekloud.com/llms.txt
> Use this file to discover all available pages before exploring further.
# Open Telemetry Logging Components
> Explains OpenTelemetry logging components, integration with existing logging libraries, LogRecord structure and enrichment, LoggerProvider initialization, exporters and trace correlation, and common deployment patterns with collectors.
This lesson explains the key OpenTelemetry logging components, how they connect to your existing logging libraries, and how logs are structured, enriched, and exported. You’ll learn where to initialize logging, how logs are correlated with traces, and common deployment patterns (for example, sending logs to an OpenTelemetry Collector).
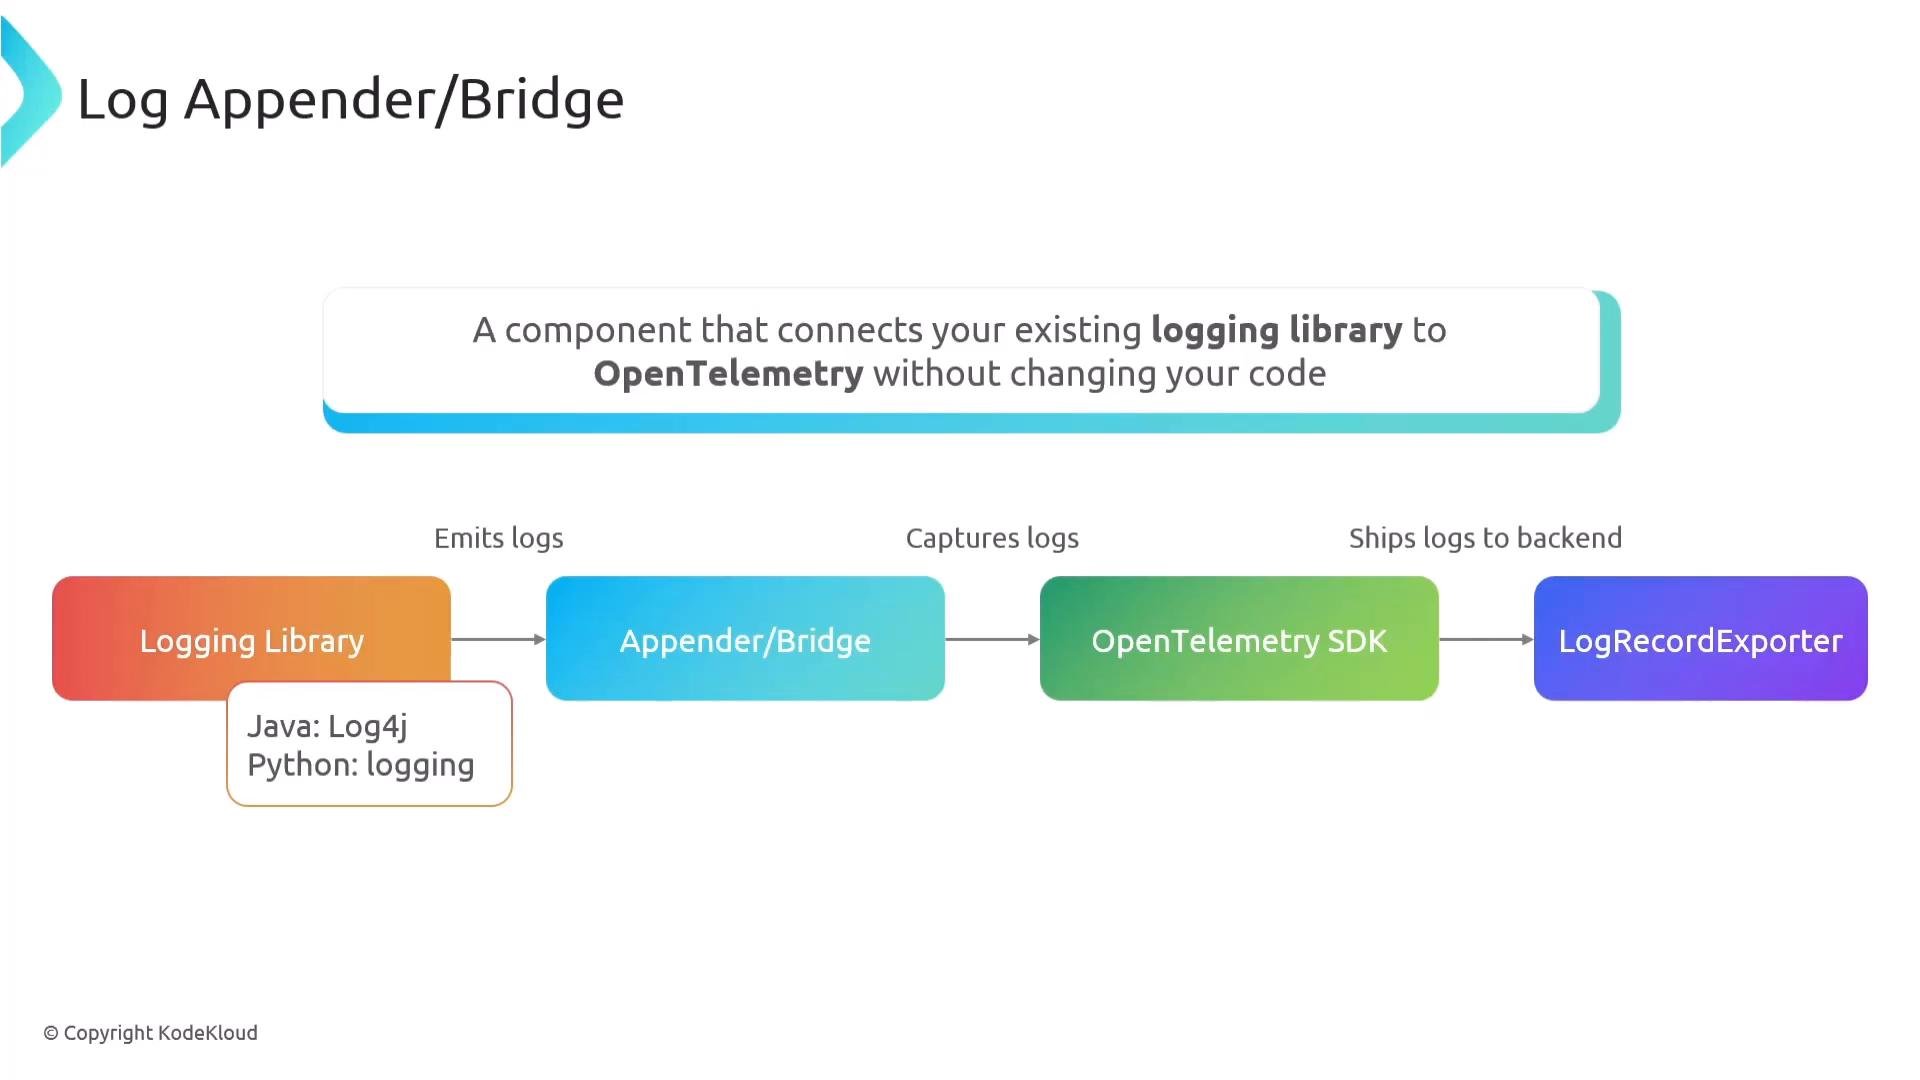
Log data in OpenTelemetry flows from your existing logging library through an appender/bridge into the OpenTelemetry SDK, and then out via one or more exporters.
 Overview table
| Component | Purpose | Example / Notes |
| - | - | - |
| Log appender / bridge | Captures log calls from existing libraries and forwards them to the OpenTelemetry SDK | Works with Java Log4j, Python `logging`, etc. — no code changes required |
| LoggerProvider | Factory and manager for logger instances; holds resource and exporter config | Initialize once per application (singleton) |
| LogRecord exporter | Batches, retries, and delivers logs to destinations | Destinations: stdout, OpenTelemetry Collector, OTLP-compatible backend |
| LogRecord | Fundamental unit of logging data | Contains timestamp, severity, body, trace/span ids, attributes, resource, instrumentation scope |
Log appender / bridge
A log appender (also called a bridge) hooks your existing logging framework into OpenTelemetry. Your application continues to call its usual logging APIs (for example, `log.info()` or `logger.error()`); the appender intercepts those calls and forwards standardized, enriched log records to the OpenTelemetry SDK. This lets you adopt OpenTelemetry logging without changing application code.
The exporter commonly sends logs to an OpenTelemetry Collector or directly to an OTLP-compatible backend such as a hosted observability platform.
LoggerProvider
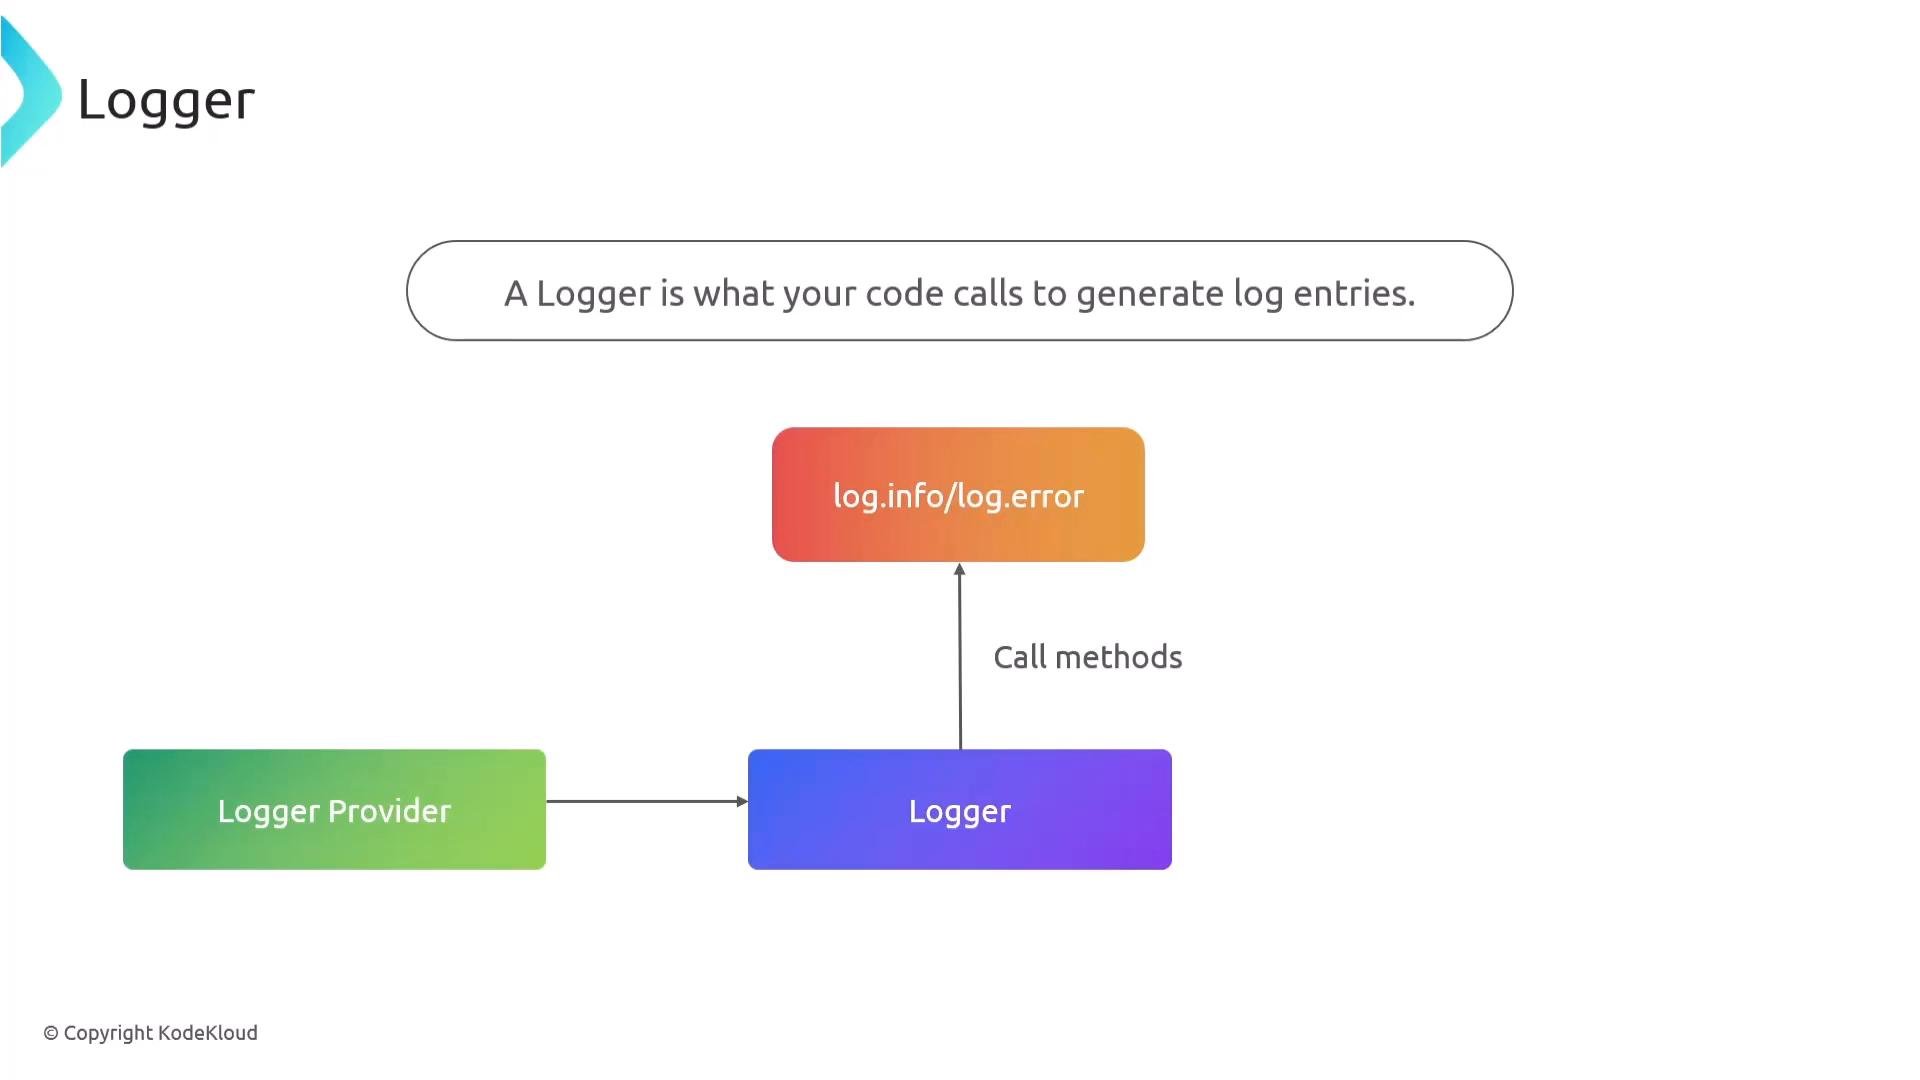
The LoggerProvider is created once per application lifecycle and acts as a centralized factory and manager for all logger instances. Its responsibilities include:
* Creating logger instances used by application code (e.g., `log.info`, `log.error`).
* Configuring resource metadata such as `service.name`, `service.version`, and `deployment.environment`.
* Wiring exporters that will deliver logs to your backend(s).
* Serving as part of the Log Bridge API to help library authors integrate frameworks consistently with OpenTelemetry.
A logger instance is what your code uses to produce log records; the LoggerProvider ensures all loggers share consistent resource and exporter configuration.
Initialize the LoggerProvider once per application. Treat it as an application-wide singleton so all loggers inherit the same resource and exporter configuration.
Overview table
| Component | Purpose | Example / Notes |
| - | - | - |
| Log appender / bridge | Captures log calls from existing libraries and forwards them to the OpenTelemetry SDK | Works with Java Log4j, Python `logging`, etc. — no code changes required |
| LoggerProvider | Factory and manager for logger instances; holds resource and exporter config | Initialize once per application (singleton) |
| LogRecord exporter | Batches, retries, and delivers logs to destinations | Destinations: stdout, OpenTelemetry Collector, OTLP-compatible backend |
| LogRecord | Fundamental unit of logging data | Contains timestamp, severity, body, trace/span ids, attributes, resource, instrumentation scope |
Log appender / bridge
A log appender (also called a bridge) hooks your existing logging framework into OpenTelemetry. Your application continues to call its usual logging APIs (for example, `log.info()` or `logger.error()`); the appender intercepts those calls and forwards standardized, enriched log records to the OpenTelemetry SDK. This lets you adopt OpenTelemetry logging without changing application code.
The exporter commonly sends logs to an OpenTelemetry Collector or directly to an OTLP-compatible backend such as a hosted observability platform.
LoggerProvider
The LoggerProvider is created once per application lifecycle and acts as a centralized factory and manager for all logger instances. Its responsibilities include:
* Creating logger instances used by application code (e.g., `log.info`, `log.error`).
* Configuring resource metadata such as `service.name`, `service.version`, and `deployment.environment`.
* Wiring exporters that will deliver logs to your backend(s).
* Serving as part of the Log Bridge API to help library authors integrate frameworks consistently with OpenTelemetry.
A logger instance is what your code uses to produce log records; the LoggerProvider ensures all loggers share consistent resource and exporter configuration.
Initialize the LoggerProvider once per application. Treat it as an application-wide singleton so all loggers inherit the same resource and exporter configuration.
 LogRecord exporter
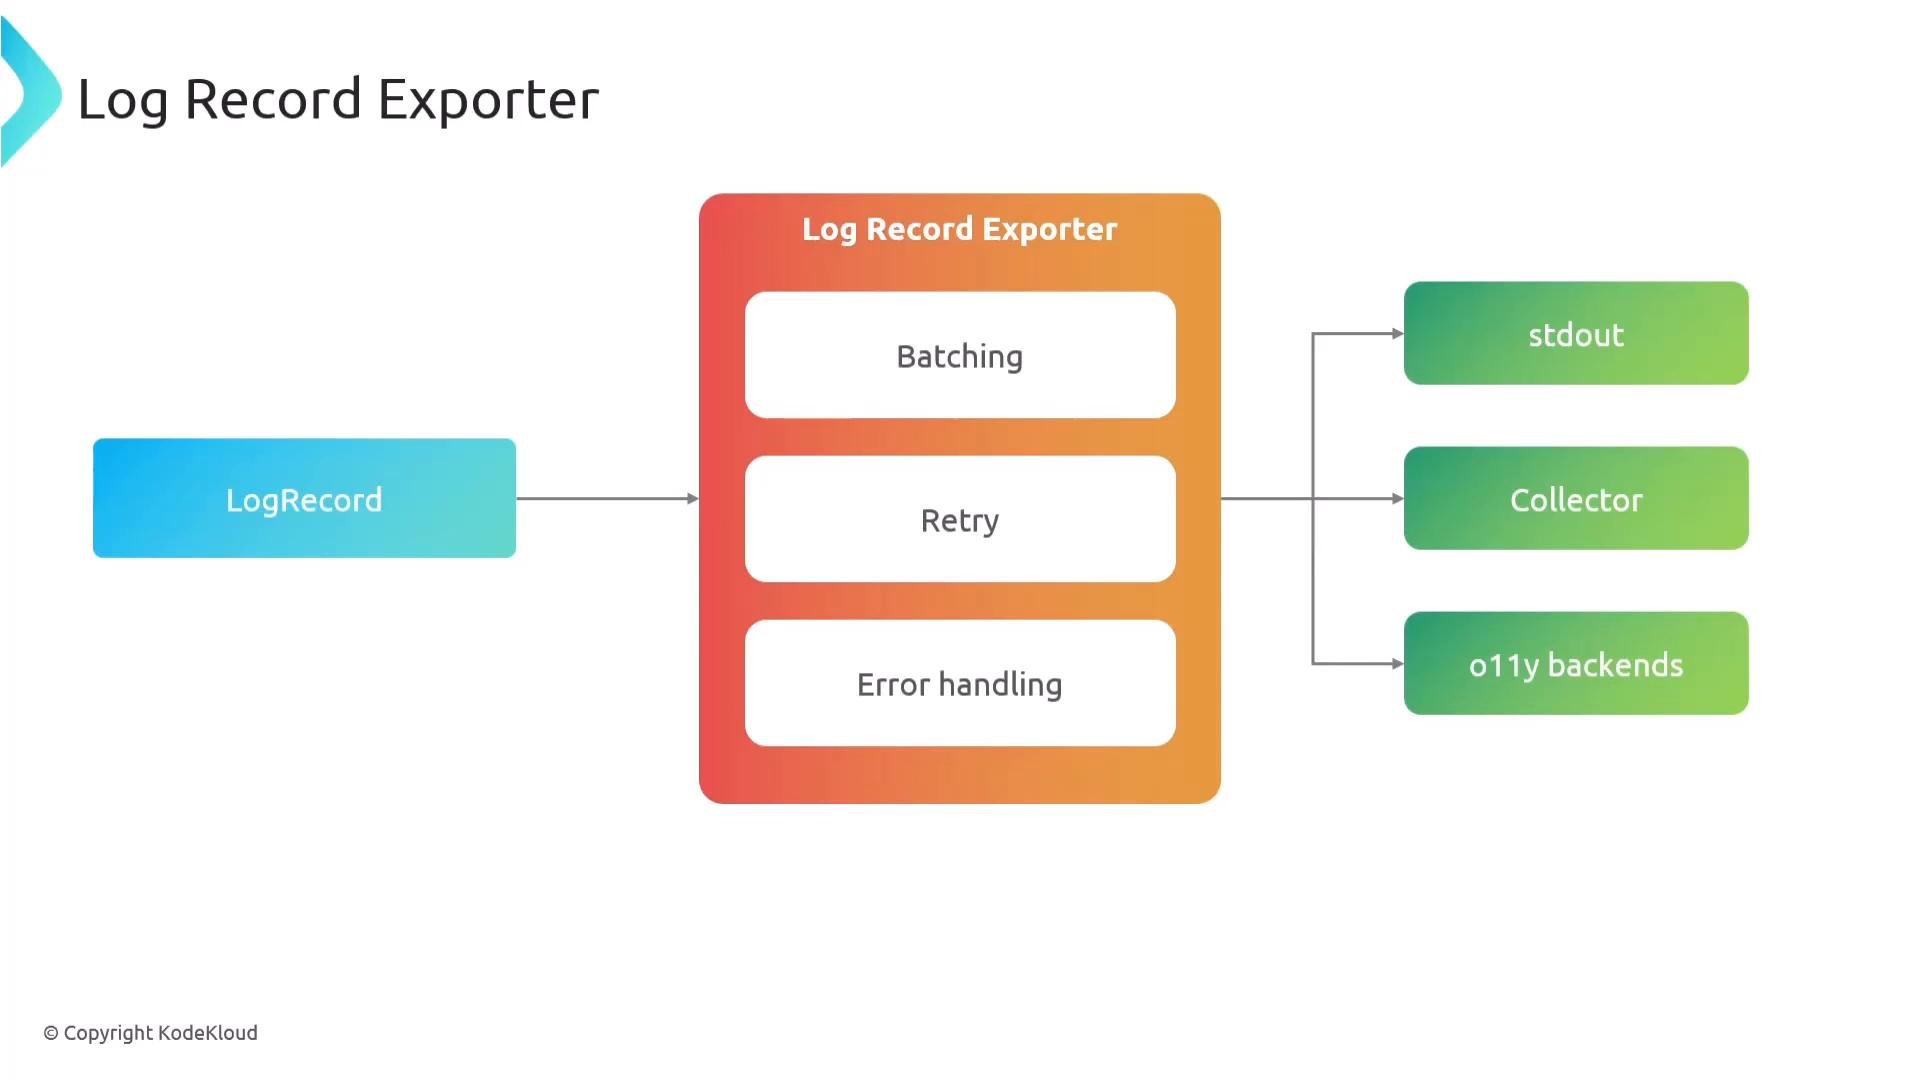
Once a logger produces a LogRecord, the configured exporter(s) take over. Exporters typically implement:
* Batching to reduce overhead and improve throughput.
* Retry logic to handle transient failures.
* Error handling and backpressure strategies.
Exporters can route logs to multiple targets — for local debugging you may write to `stdout`, for aggregation and enrichment you commonly send logs to an OpenTelemetry Collector, and for long-term storage or analysis you send logs to an observability backend.
LogRecord exporter
Once a logger produces a LogRecord, the configured exporter(s) take over. Exporters typically implement:
* Batching to reduce overhead and improve throughput.
* Retry logic to handle transient failures.
* Error handling and backpressure strategies.
Exporters can route logs to multiple targets — for local debugging you may write to `stdout`, for aggregation and enrichment you commonly send logs to an OpenTelemetry Collector, and for long-term storage or analysis you send logs to an observability backend.
 Note: exporters are pluggable so you can change backends without modifying application code. In production, sending logs to the OpenTelemetry Collector is common because the Collector can perform additional processing, routing, and enrichment before forwarding to final backends.
Log record structure
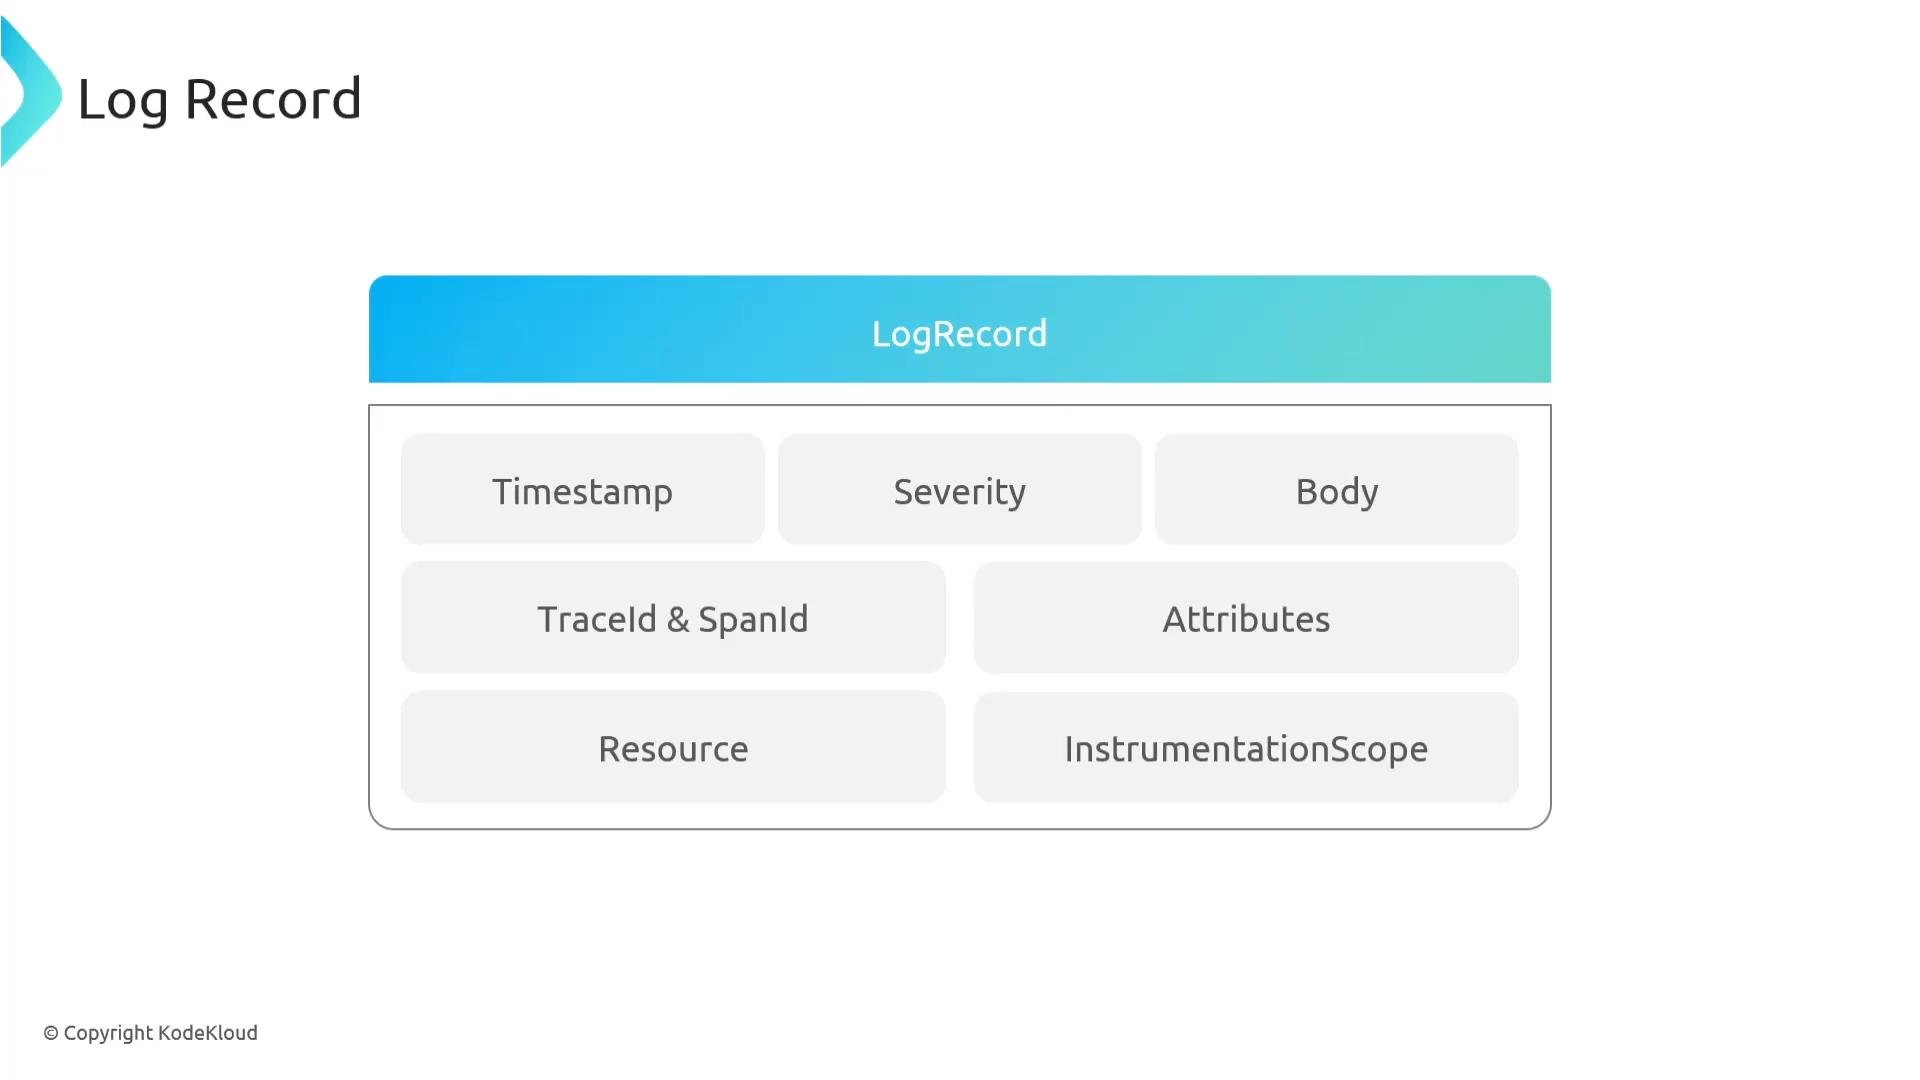
A LogRecord is the core unit of log data in OpenTelemetry. It is analogous to a Span in tracing or a datapoint in metrics. Typical fields include:
* Timestamp: when the event occurred.
* Severity: severity text and numeric level (e.g., INFO, ERROR).
* Body: the main log message.
* Trace and span IDs: present when a log is emitted during an active span to enable correlation.
* Attributes: structured key/value pairs storing business or contextual metadata.
* Resource: information identifying where the log originated (e.g., `service.name`, `host.name`, Kubernetes metadata).
* Instrumentation scope: the library or module that produced the log.
Note: exporters are pluggable so you can change backends without modifying application code. In production, sending logs to the OpenTelemetry Collector is common because the Collector can perform additional processing, routing, and enrichment before forwarding to final backends.
Log record structure
A LogRecord is the core unit of log data in OpenTelemetry. It is analogous to a Span in tracing or a datapoint in metrics. Typical fields include:
* Timestamp: when the event occurred.
* Severity: severity text and numeric level (e.g., INFO, ERROR).
* Body: the main log message.
* Trace and span IDs: present when a log is emitted during an active span to enable correlation.
* Attributes: structured key/value pairs storing business or contextual metadata.
* Resource: information identifying where the log originated (e.g., `service.name`, `host.name`, Kubernetes metadata).
* Instrumentation scope: the library or module that produced the log.
 Example: structured log record (JSON)
Below is a sampled, structured log record showing typical enriched fields, including trace/span linkage and resource metadata:
```json theme={null}
{
"timestamp": "2025-10-30T11:42:33.512Z",
"severity_text": "ERROR",
"severity_number": 17,
"body": "Payment service failed to process transaction.",
"trace_id": "8a4d0c5c2f9e47e7b3cb97c192e8e4c3",
"span_id": "b4f710f90a3d8c7a",
"attributes": {
"customer.id": "CUST-4581",
"transaction.id": "TXN-98345",
"payment.method": "credit_card",
"error.type": "TimeoutError",
"retry.count": 2
},
"resource": {
"service.name": "payment-service",
"service.version": "2.3.1",
"deployment.environment": "production",
"host.name": "payment-node-07"
},
"instrumentation_scope": {
"name": "com.example.payment",
"version": "1.0.0",
"schema_url": "https://opentelemetry.io/schemas/1.9.0"
}
}
```
Trace/span IDs are not typically part of the original plain-text log message. The OpenTelemetry logging integration inspects the current execution context and attaches trace and span identifiers when a log is emitted while an active span exists. This correlation makes it simple to pivot from traces to relevant logs in your observability backend.
Console and indexed logs (example outputs)
Exported logs may appear as plain-text console entries or as structured documents indexed into a search engine (for example, Elasticsearch). The following examples show both a compact console-style log and an indexed `_source` document to illustrate how fields and resource metadata are preserved.
Plain-text log entries (shortened for readability):
```text theme={null}
Oct 30, 2025 @ 14:20:00.056 attributes.data_stream.dataset: default attributes.data_stream.namespace: namespace attributes.data_stream.type: record body: [SnapshotEmitter id=1] Successfully wrote snapshot 0000000000000210483-0000000001 instrumentationScope.name: org.apache.kafka.image.publisher.SnapshotEmitter observedTimestamp: Oct 30, 2025 @ 14:20:00.101 resource.host.name: my-otel-demo-kafka-b568cbd4f-q7l96 resource.k8s.deployment.name: my-otel-demo-kafka resource.k8s.namespace.name: default
```
Indexed document (example `_source` from a search result):
```json theme={null}
{
"_index": "otel",
"_id": "PHohM5oB3sP9bn8XH0tm",
"_version": 1,
"_source": {
"attributes": {
"data_stream": {
"dataset": "default",
"namespace": "namespace",
"type": "record"
}
},
"body": "[SnapshotEmitter id=1] Successfully wrote snapshot 0000000000000210483-0000000001",
"instrumentationScope": {
"name": "org.apache.kafka.image.publisher.SnapshotEmitter"
},
"observedTimestamp": "2025-10-30T03:20:00.101554195Z",
"resource": {
"container.id": "ec9c655842163b7440e3372ff4e24101e4b8e55537ea21744193d9da371ab053",
"host.arch": "aarch64",
"host.name": "my-otel-demo-kafka-b568cbd4f-q7l96",
"k8s.deployment.name": "my-otel-demo-kafka",
"k8s.namespace.name": "default",
"k8s.node.name": "rpi5-debian-k8s",
"k8s.pod.ip": "172.16.98.144",
"k8s.pod.name": "my-otel-demo-kafka-b568cbd4f-q7l96",
"k8s.pod.start_time": "2025-08-26T02:27:34Z",
"os.type": "linux",
"process.command_args": [
"/opt/java/openjdk/bin/java",
"-Xmx400M",
"-Xms400M",
"-XX:SharedArchiveFile:/opt/kafka/kafka.jsa",
"-Xlog:gc*:file:/opt/kafka/bin/../logs/kafkaServer-gc.log:time,tags:filecount=10,filesize=100M",
"-Dcom.sun.management.jmxremote=true",
"-Dcom.sun.management.jmxremote.authenticate=false",
"-Dcom.sun.management.jmxremote.ssl=false",
"-Dkafka.logs.dir=/opt/kafka/bin/../logs",
"-Dlog4j.configuration=file:/opt/kafka/bin/../config/log4j.properties",
"-cp",
"/opt/kafka/bin/../libs/..."
]
},
"severity": {
"text": "INFO",
"number": 9
},
"@timestamp": "2025-10-30T03:20:00.056026166Z"
}
}
```
Observed timestamp vs event timestamp
* Observed timestamp (ingestion timestamp): when the collector or ingest pipeline captured the log.
* Event/timestamp: when the event actually occurred at the source.
Both timestamps are useful: event timestamp is used for accurate timeline analysis, and observed timestamp helps debug ingestion delays or pipeline issues.
Resource attributes and enrichment
The Collector and SDK frequently enrich logs with resource attributes (service, pod, node, host, container, etc.). These attributes make it straightforward to filter and query logs by service, deployment, or infrastructure metadata in your observability backend.
Summary
* The log appender/bridge integrates existing logging libraries with OpenTelemetry without requiring application code changes.
* Initialize the LoggerProvider once per application so all loggers share the same resource and exporter configuration.
* LogRecord exporters handle batching, retries, and delivery to stdout, an OpenTelemetry Collector, or an observability backend.
* Log records are structured and often include timestamps, severity, body, trace/span correlation (when available), attributes, resource metadata, and instrumentation scope.
* Exporters are pluggable—swap backends without changing application code. Sending logs to the OpenTelemetry Collector is a common production pattern.
Links and references
* [OpenTelemetry Collector Documentation](https://opentelemetry.io/docs/collector/)
* [OpenTelemetry Logging Specification](https://opentelemetry.io/docs/)
* [Elasticsearch: Index APIs](https://www.elastic.co/guide/en/elasticsearch/reference/current/index.html)
That’s it for this lesson.
This documentation is built and hosted on [Mintlify](https://mintlify.com), a developer documentation platform.
Example: structured log record (JSON)
Below is a sampled, structured log record showing typical enriched fields, including trace/span linkage and resource metadata:
```json theme={null}
{
"timestamp": "2025-10-30T11:42:33.512Z",
"severity_text": "ERROR",
"severity_number": 17,
"body": "Payment service failed to process transaction.",
"trace_id": "8a4d0c5c2f9e47e7b3cb97c192e8e4c3",
"span_id": "b4f710f90a3d8c7a",
"attributes": {
"customer.id": "CUST-4581",
"transaction.id": "TXN-98345",
"payment.method": "credit_card",
"error.type": "TimeoutError",
"retry.count": 2
},
"resource": {
"service.name": "payment-service",
"service.version": "2.3.1",
"deployment.environment": "production",
"host.name": "payment-node-07"
},
"instrumentation_scope": {
"name": "com.example.payment",
"version": "1.0.0",
"schema_url": "https://opentelemetry.io/schemas/1.9.0"
}
}
```
Trace/span IDs are not typically part of the original plain-text log message. The OpenTelemetry logging integration inspects the current execution context and attaches trace and span identifiers when a log is emitted while an active span exists. This correlation makes it simple to pivot from traces to relevant logs in your observability backend.
Console and indexed logs (example outputs)
Exported logs may appear as plain-text console entries or as structured documents indexed into a search engine (for example, Elasticsearch). The following examples show both a compact console-style log and an indexed `_source` document to illustrate how fields and resource metadata are preserved.
Plain-text log entries (shortened for readability):
```text theme={null}
Oct 30, 2025 @ 14:20:00.056 attributes.data_stream.dataset: default attributes.data_stream.namespace: namespace attributes.data_stream.type: record body: [SnapshotEmitter id=1] Successfully wrote snapshot 0000000000000210483-0000000001 instrumentationScope.name: org.apache.kafka.image.publisher.SnapshotEmitter observedTimestamp: Oct 30, 2025 @ 14:20:00.101 resource.host.name: my-otel-demo-kafka-b568cbd4f-q7l96 resource.k8s.deployment.name: my-otel-demo-kafka resource.k8s.namespace.name: default
```
Indexed document (example `_source` from a search result):
```json theme={null}
{
"_index": "otel",
"_id": "PHohM5oB3sP9bn8XH0tm",
"_version": 1,
"_source": {
"attributes": {
"data_stream": {
"dataset": "default",
"namespace": "namespace",
"type": "record"
}
},
"body": "[SnapshotEmitter id=1] Successfully wrote snapshot 0000000000000210483-0000000001",
"instrumentationScope": {
"name": "org.apache.kafka.image.publisher.SnapshotEmitter"
},
"observedTimestamp": "2025-10-30T03:20:00.101554195Z",
"resource": {
"container.id": "ec9c655842163b7440e3372ff4e24101e4b8e55537ea21744193d9da371ab053",
"host.arch": "aarch64",
"host.name": "my-otel-demo-kafka-b568cbd4f-q7l96",
"k8s.deployment.name": "my-otel-demo-kafka",
"k8s.namespace.name": "default",
"k8s.node.name": "rpi5-debian-k8s",
"k8s.pod.ip": "172.16.98.144",
"k8s.pod.name": "my-otel-demo-kafka-b568cbd4f-q7l96",
"k8s.pod.start_time": "2025-08-26T02:27:34Z",
"os.type": "linux",
"process.command_args": [
"/opt/java/openjdk/bin/java",
"-Xmx400M",
"-Xms400M",
"-XX:SharedArchiveFile:/opt/kafka/kafka.jsa",
"-Xlog:gc*:file:/opt/kafka/bin/../logs/kafkaServer-gc.log:time,tags:filecount=10,filesize=100M",
"-Dcom.sun.management.jmxremote=true",
"-Dcom.sun.management.jmxremote.authenticate=false",
"-Dcom.sun.management.jmxremote.ssl=false",
"-Dkafka.logs.dir=/opt/kafka/bin/../logs",
"-Dlog4j.configuration=file:/opt/kafka/bin/../config/log4j.properties",
"-cp",
"/opt/kafka/bin/../libs/..."
]
},
"severity": {
"text": "INFO",
"number": 9
},
"@timestamp": "2025-10-30T03:20:00.056026166Z"
}
}
```
Observed timestamp vs event timestamp
* Observed timestamp (ingestion timestamp): when the collector or ingest pipeline captured the log.
* Event/timestamp: when the event actually occurred at the source.
Both timestamps are useful: event timestamp is used for accurate timeline analysis, and observed timestamp helps debug ingestion delays or pipeline issues.
Resource attributes and enrichment
The Collector and SDK frequently enrich logs with resource attributes (service, pod, node, host, container, etc.). These attributes make it straightforward to filter and query logs by service, deployment, or infrastructure metadata in your observability backend.
Summary
* The log appender/bridge integrates existing logging libraries with OpenTelemetry without requiring application code changes.
* Initialize the LoggerProvider once per application so all loggers share the same resource and exporter configuration.
* LogRecord exporters handle batching, retries, and delivery to stdout, an OpenTelemetry Collector, or an observability backend.
* Log records are structured and often include timestamps, severity, body, trace/span correlation (when available), attributes, resource metadata, and instrumentation scope.
* Exporters are pluggable—swap backends without changing application code. Sending logs to the OpenTelemetry Collector is a common production pattern.
Links and references
* [OpenTelemetry Collector Documentation](https://opentelemetry.io/docs/collector/)
* [OpenTelemetry Logging Specification](https://opentelemetry.io/docs/)
* [Elasticsearch: Index APIs](https://www.elastic.co/guide/en/elasticsearch/reference/current/index.html)
That’s it for this lesson.
This documentation is built and hosted on [Mintlify](https://mintlify.com), a developer documentation platform.