> ## Documentation Index
> Fetch the complete documentation index at: https://notes.kodekloud.com/llms.txt
> Use this file to discover all available pages before exploring further.
# OpenTelemetry Logging Introduction
> Introduction to OpenTelemetry logging, covering log types, structured formats, library integrations, trace and span correlation, Collector pipelines for ingestion and processing, and logging best practices.
It's time to learn about logging in OpenTelemetry. This lesson explains what logs are, common formats, how OpenTelemetry integrates with your existing logging libraries, and where the Collector fits in a unified telemetry pipeline.
Logs are one of the three primary telemetry signals (alongside metrics and traces). They provide free-form, human-readable context that is invaluable for debugging. That flexibility is powerful but also introduces risks: inconsistent formatting and clutter when teams lack logging discipline. To make logs searchable and actionable, prefer structured logging and consistent schemas.
Structured logs (JSON or schema-backed formats) are strongly recommended: they make logs easier to query, filter, and analyze across your observability stack.
## What is a log?
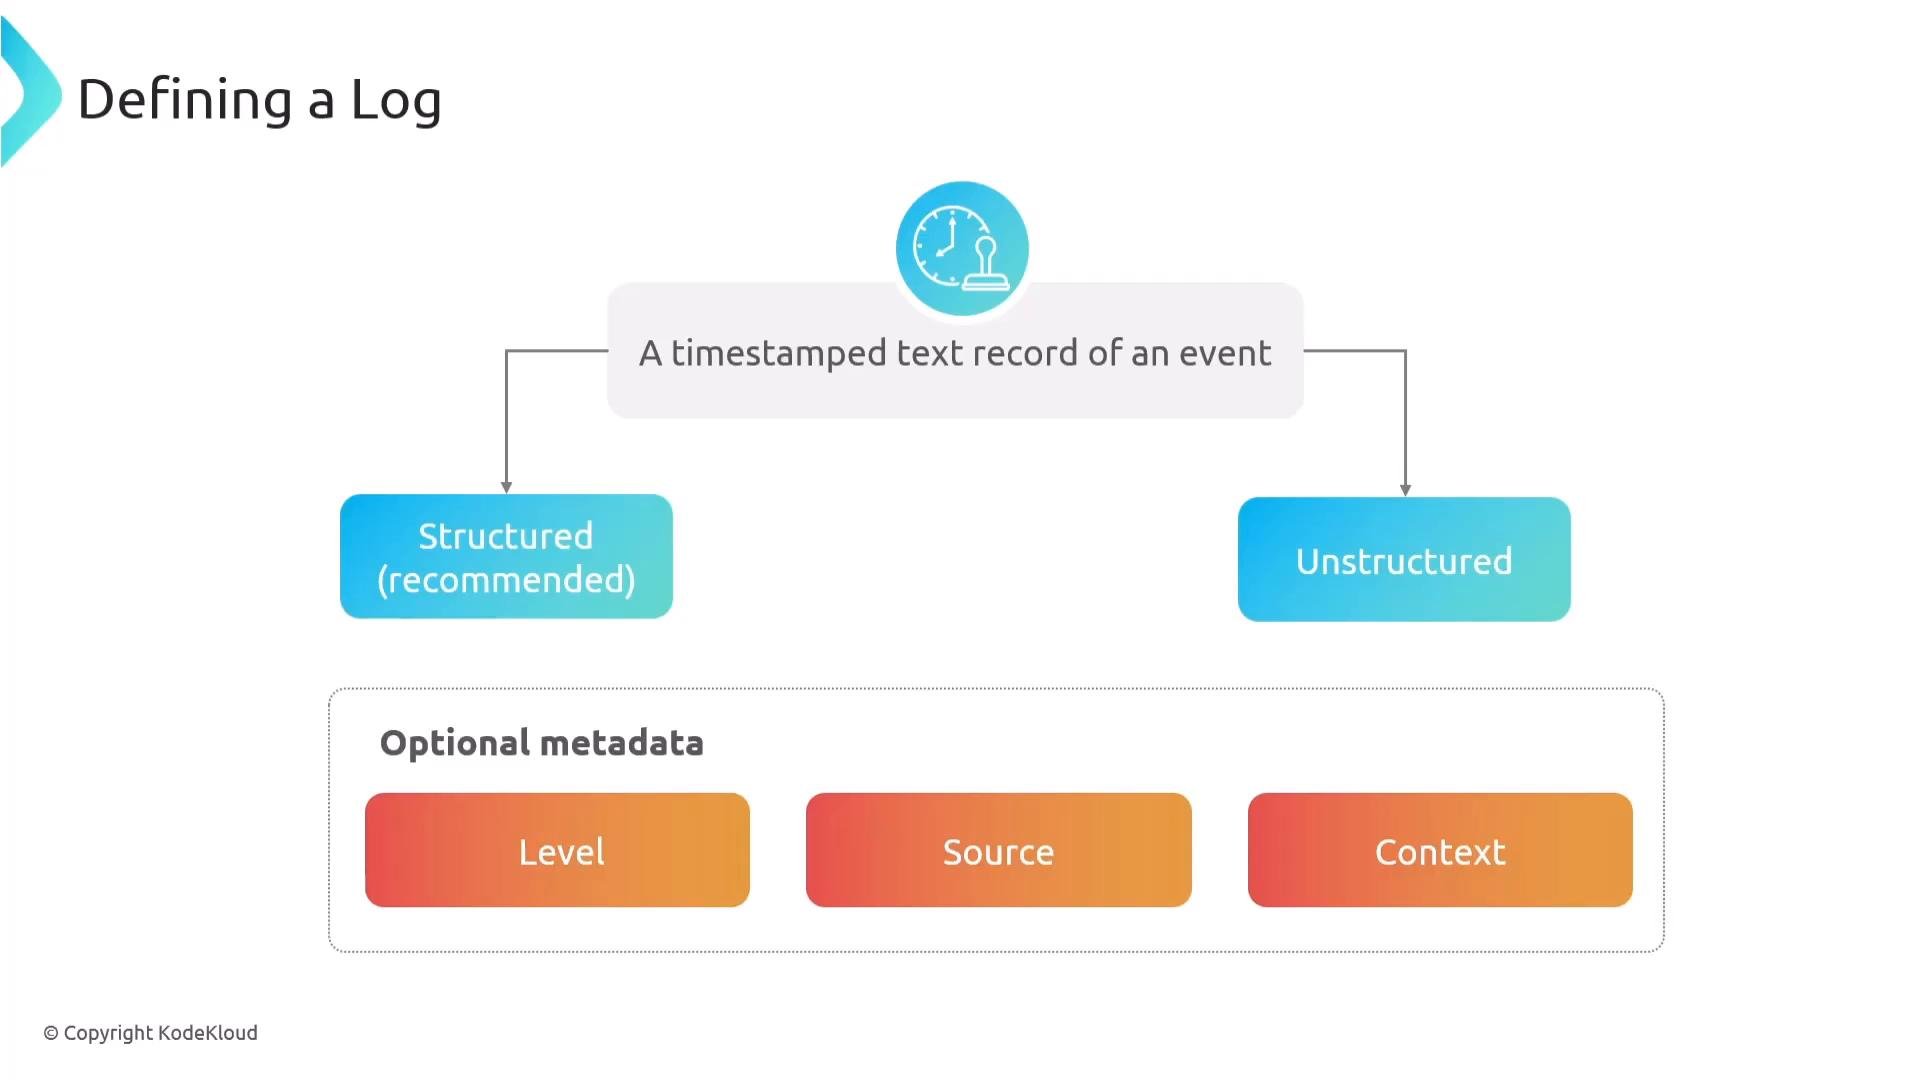
A log is a timestamped text record of an event — something that happened in your system at a specific point in time. Logs may be:
* Structured — follow a consistent schema (JSON is common). Predictable and machine-readable.
* Unstructured — free text and stack traces. Easy for humans, but harder for programmatic analysis.
* Semi-structured — key-value tokens or delimited fields (a compromise between the two).
Logs frequently include optional metadata to aid querying and correlation:
* Level (debug, info, warn, error)
* Source (service or component)
* Context (trace\_id, span\_id, user identifiers, etc.)
These elements make logs more meaningful and easier for machines to join with traces and metrics.
 ## Logging libraries and OpenTelemetry integration
OpenTelemetry does not replace your existing logging libraries or formats; it augments them. Common logging libraries by language include:
| Language | Example Libraries |
| - | - |
| Java | Log4j, Logback, `java.util.logging` |
| Python | `logging`, structlog, loguru |
| .NET | Serilog, NLog, log4net |
| JavaScript/TypeScript | Winston, Bunyan, Pino |
| Go | Zap, Logrus, `log` |
| Ruby | Logger, SemanticLogger |
| PHP | Monolog |
| Elixir/Erlang | Logger |
OpenTelemetry enriches and interoperates with logging frameworks — it does not seek to replace them. Use OTel to add context (trace/span IDs) and to export logs consistently.
A typical integration flow:
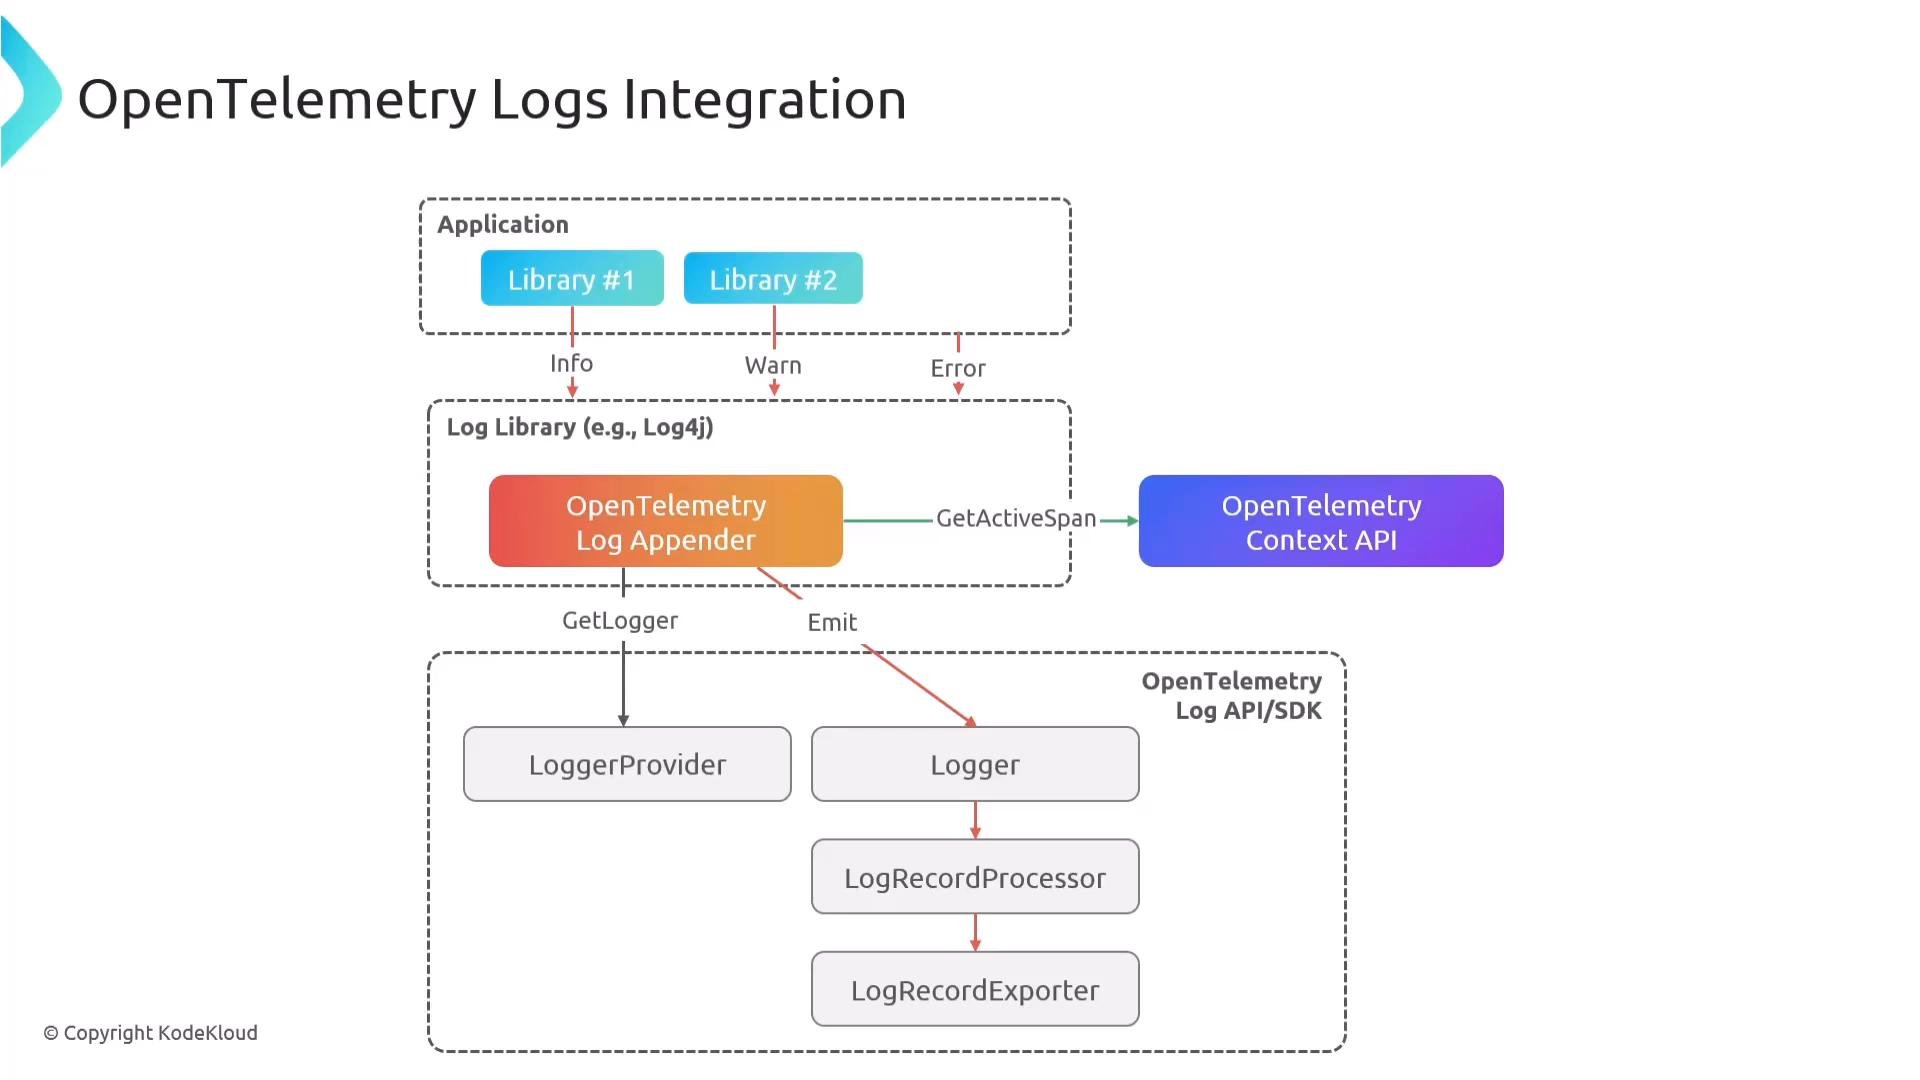
1. Your application and its libraries emit log messages (info/warn/error) to a logging framework (e.g., Log4j).
2. An OpenTelemetry appender/integration captures each log record and queries the OpenTelemetry Context API.
3. If a log is produced while a span is active, the integration attaches trace\_id and span\_id to the log.
4. The enriched record passes to the OpenTelemetry Log API/SDK, which uses a LoggerProvider to create logger instances, a LogRecordProcessor to batch/filter/transform, and a LogRecordExporter to convert/export the record (commonly using OTLP).
## Logging libraries and OpenTelemetry integration
OpenTelemetry does not replace your existing logging libraries or formats; it augments them. Common logging libraries by language include:
| Language | Example Libraries |
| - | - |
| Java | Log4j, Logback, `java.util.logging` |
| Python | `logging`, structlog, loguru |
| .NET | Serilog, NLog, log4net |
| JavaScript/TypeScript | Winston, Bunyan, Pino |
| Go | Zap, Logrus, `log` |
| Ruby | Logger, SemanticLogger |
| PHP | Monolog |
| Elixir/Erlang | Logger |
OpenTelemetry enriches and interoperates with logging frameworks — it does not seek to replace them. Use OTel to add context (trace/span IDs) and to export logs consistently.
A typical integration flow:
1. Your application and its libraries emit log messages (info/warn/error) to a logging framework (e.g., Log4j).
2. An OpenTelemetry appender/integration captures each log record and queries the OpenTelemetry Context API.
3. If a log is produced while a span is active, the integration attaches trace\_id and span\_id to the log.
4. The enriched record passes to the OpenTelemetry Log API/SDK, which uses a LoggerProvider to create logger instances, a LogRecordProcessor to batch/filter/transform, and a LogRecordExporter to convert/export the record (commonly using OTLP).
 ## The OpenTelemetry Collector in the logging pipeline
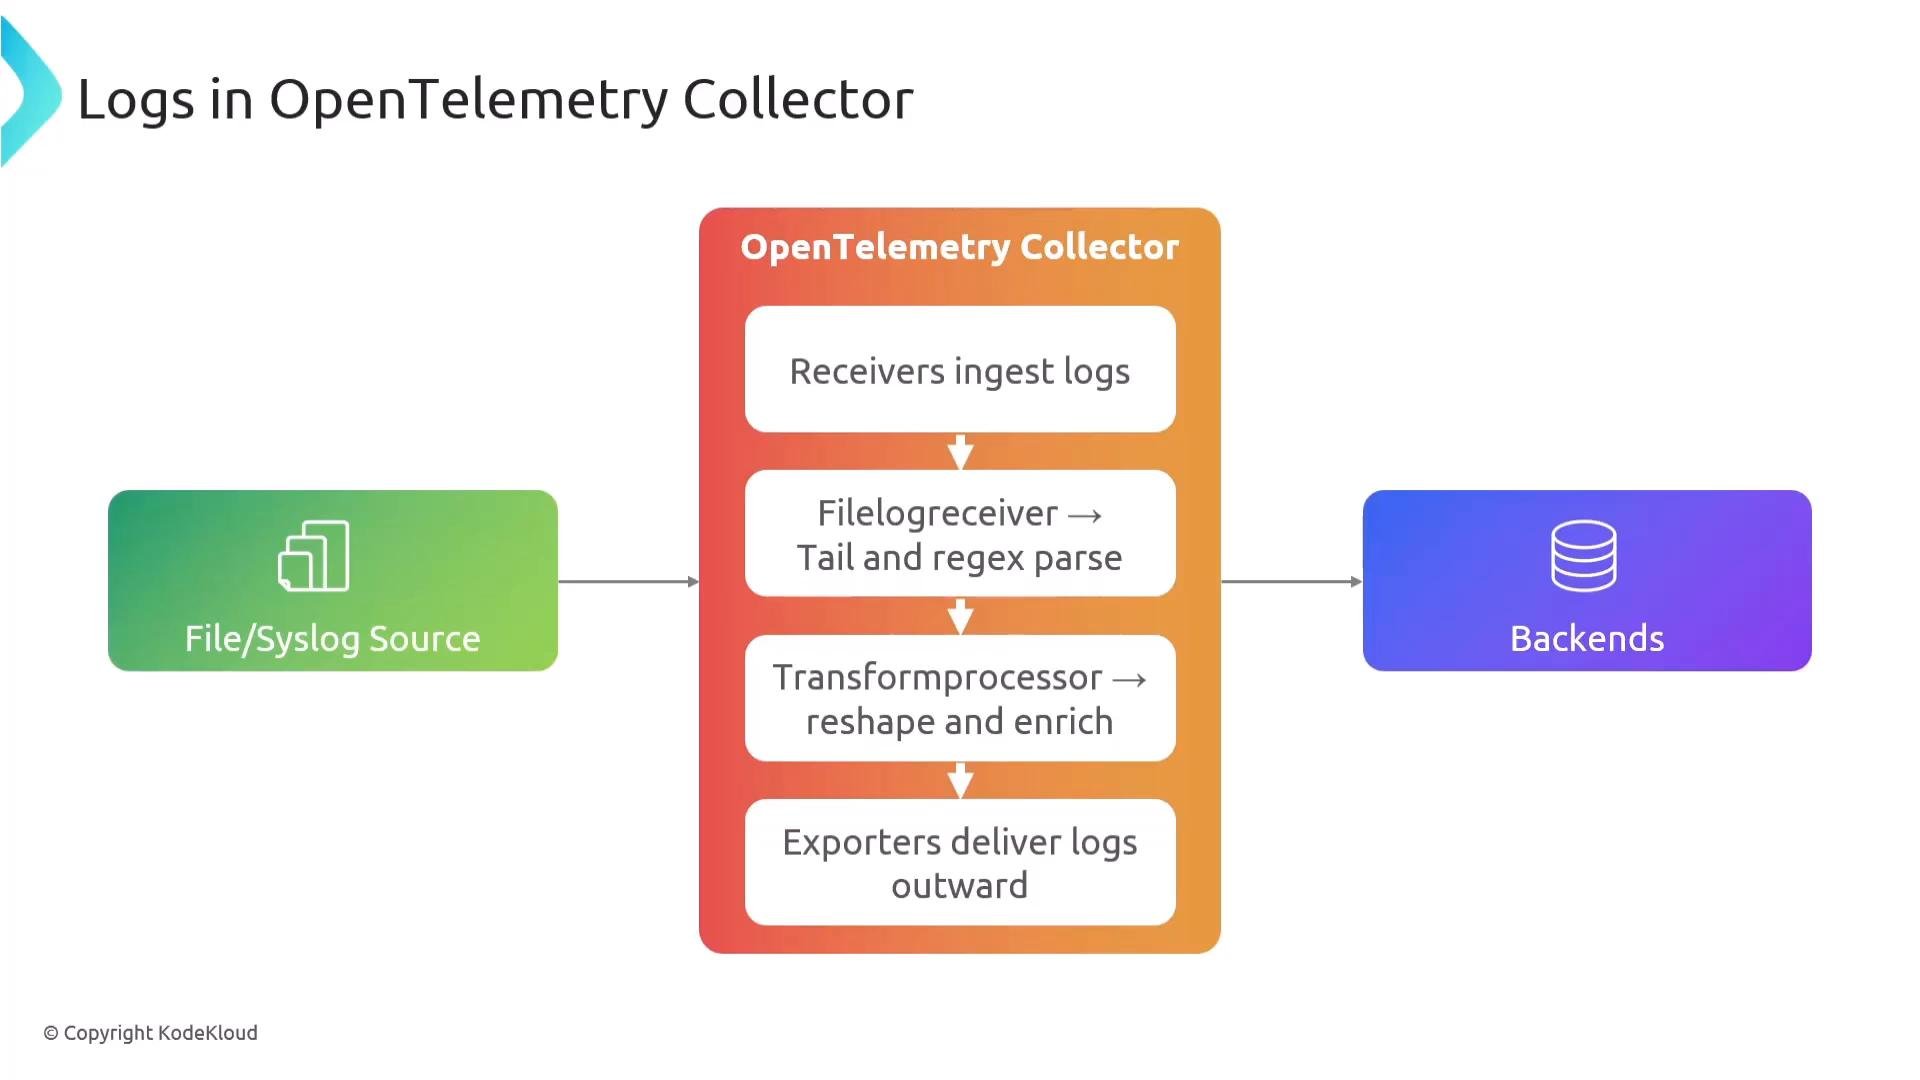
The OpenTelemetry Collector can operate as an agent (sidecar/host) or gateway. It enables you to ingest logs from external sources (file systems, syslog, Fluentd, etc.), apply processing (parsing, transforms, enrichment), and export to your backend(s). Using the Collector lets you centralize processing and reduce per-application complexity.
Common Collector pipeline elements for logs:
| Pipeline Element | Role | Examples |
| - | - | - |
| Receiver | Ingest logs from sources | `filelog`, `syslog`, OTLP |
| Processor | Transform, parse, enrich, or filter | `transform`, `batch` |
| Exporter | Send logs to storage/observability backends | OTLP exporter, vendor-specific exporters |
This separation allows you to send logs to the Collector outside of application SDKs (e.g., tailing files), while still getting unified processing and export.
## The OpenTelemetry Collector in the logging pipeline
The OpenTelemetry Collector can operate as an agent (sidecar/host) or gateway. It enables you to ingest logs from external sources (file systems, syslog, Fluentd, etc.), apply processing (parsing, transforms, enrichment), and export to your backend(s). Using the Collector lets you centralize processing and reduce per-application complexity.
Common Collector pipeline elements for logs:
| Pipeline Element | Role | Examples |
| - | - | - |
| Receiver | Ingest logs from sources | `filelog`, `syslog`, OTLP |
| Processor | Transform, parse, enrich, or filter | `transform`, `batch` |
| Exporter | Send logs to storage/observability backends | OTLP exporter, vendor-specific exporters |
This separation allows you to send logs to the Collector outside of application SDKs (e.g., tailing files), while still getting unified processing and export.
 ## Correlating logs with traces
When your logging library is instrumented with OpenTelemetry (via SDKs or auto-instrumentation), each log entry can include the current `trace_id` and `span_id`. This cross-signal correlation enables richer troubleshooting inside observability platforms.
Example log lines enriched with trace/span identifiers:
```text theme={null}
"User login failed" [trace_id=abc123] [span_id=xyz456]
"Order checkout" [trace_id=def789] [span_id=uvw111]
"Payment success" [trace_id=ghi222] [span_id=rst333]
```
Attaching IDs at write-time (via the active context) is more robust than trying to reconstruct context later.
## Common log formats and examples
Broadly, logs follow three styles: structured (preferred), semi-structured, and unstructured.
Structured logs (JSON) — predictable and machine-readable:
```json theme={null}
{
"timestamp": "2024-08-04T12:34:56.789Z",
"level": "INFO",
"service": "user-authentication",
"message": "User login successful",
"context": { "userId": "12345" }
}
```
Common Log Format (CLF) — text-based, widely used by web servers:
```text theme={null}
127.0.0.1 - johndoe [04/Aug/2024:12:34:56 -0400] "GET /index.html HTTP/1.1" 200 1024
```
Extended / mixed formats — CLF plus a following JSON payload (requires parsing both lines):
```text theme={null}
192.168.1.1 - johndoe [04/Aug/2024:12:34:56 -0400] "POST /api HTTP/1.1" 201 2048
{"transactionId":"abcd-efgh","responseTime":150}
```
Semi-structured examples — tokenized or key-value styles:
```text theme={null}
[ERROR] 2024-08-04 12:45:23 - Failed to connect to database: Timeout expired
```
```text theme={null}
2024-08-04T12:45:23Z level=ERROR userId=12345 message="Failed Login"
```
Unstructured logs are free text and stack traces. They remain useful for quick debugging but are harder to query without parsing and enrichment.
## Best practices and recommendations
* Prefer structured logs (JSON) with a consistent schema for services.
* Always include levels and service/host identifiers.
* Attach trace\_id and span\_id where possible to enable trace-log correlation.
* Use the OpenTelemetry Collector to centralize parsing, enrichment, and export.
* Avoid logging sensitive data (PII, credentials). Filter or redact at source or in Collector processors.
Summary
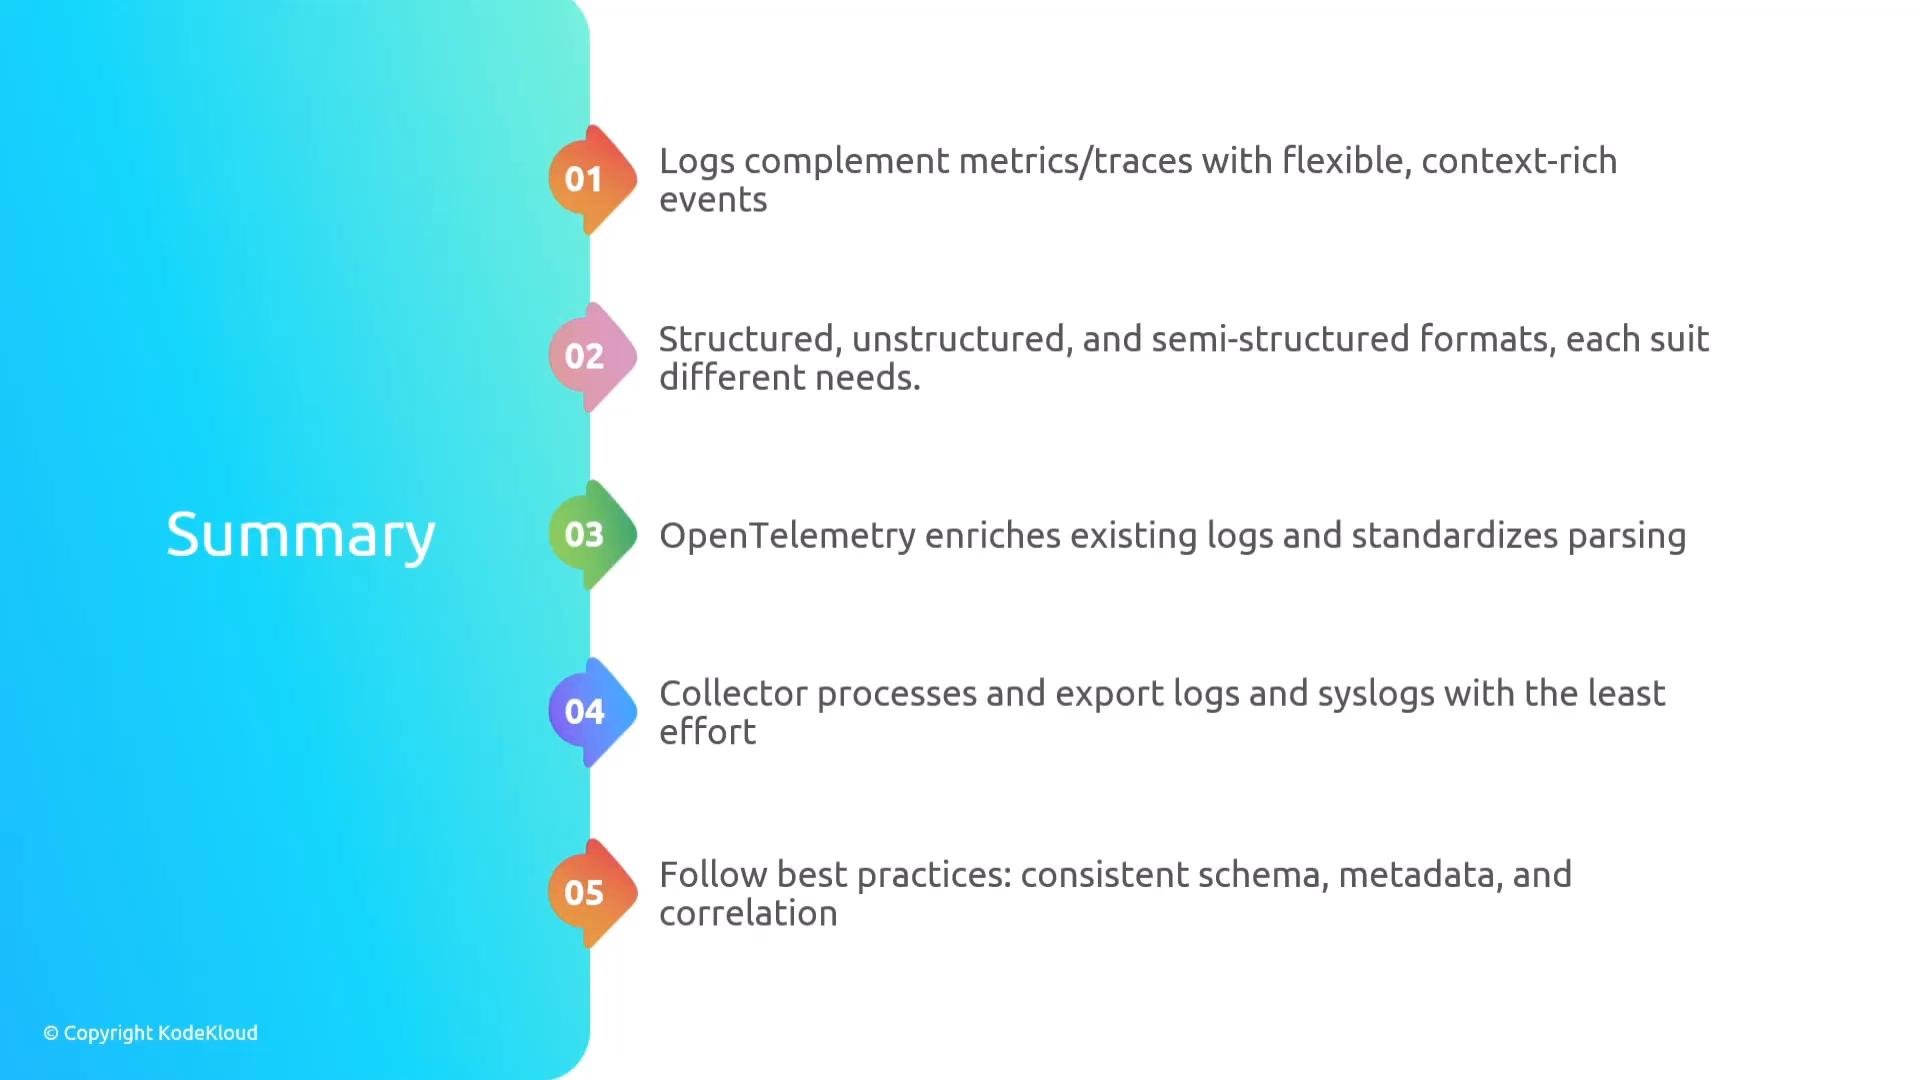
* Logs complement metrics and traces by providing flexible, context-rich events.
* Structured logs improve searchability and analysis; semi-structured logs are a useful compromise.
* OpenTelemetry enriches existing logging frameworks by adding trace/span context and a consistent export pipeline.
* The Collector can ingest logs from files/syslog, transform and enrich them, and export to backends without changing application code.
* Adopt a consistent logging schema and discipline to keep logs actionable and searchable.
## Correlating logs with traces
When your logging library is instrumented with OpenTelemetry (via SDKs or auto-instrumentation), each log entry can include the current `trace_id` and `span_id`. This cross-signal correlation enables richer troubleshooting inside observability platforms.
Example log lines enriched with trace/span identifiers:
```text theme={null}
"User login failed" [trace_id=abc123] [span_id=xyz456]
"Order checkout" [trace_id=def789] [span_id=uvw111]
"Payment success" [trace_id=ghi222] [span_id=rst333]
```
Attaching IDs at write-time (via the active context) is more robust than trying to reconstruct context later.
## Common log formats and examples
Broadly, logs follow three styles: structured (preferred), semi-structured, and unstructured.
Structured logs (JSON) — predictable and machine-readable:
```json theme={null}
{
"timestamp": "2024-08-04T12:34:56.789Z",
"level": "INFO",
"service": "user-authentication",
"message": "User login successful",
"context": { "userId": "12345" }
}
```
Common Log Format (CLF) — text-based, widely used by web servers:
```text theme={null}
127.0.0.1 - johndoe [04/Aug/2024:12:34:56 -0400] "GET /index.html HTTP/1.1" 200 1024
```
Extended / mixed formats — CLF plus a following JSON payload (requires parsing both lines):
```text theme={null}
192.168.1.1 - johndoe [04/Aug/2024:12:34:56 -0400] "POST /api HTTP/1.1" 201 2048
{"transactionId":"abcd-efgh","responseTime":150}
```
Semi-structured examples — tokenized or key-value styles:
```text theme={null}
[ERROR] 2024-08-04 12:45:23 - Failed to connect to database: Timeout expired
```
```text theme={null}
2024-08-04T12:45:23Z level=ERROR userId=12345 message="Failed Login"
```
Unstructured logs are free text and stack traces. They remain useful for quick debugging but are harder to query without parsing and enrichment.
## Best practices and recommendations
* Prefer structured logs (JSON) with a consistent schema for services.
* Always include levels and service/host identifiers.
* Attach trace\_id and span\_id where possible to enable trace-log correlation.
* Use the OpenTelemetry Collector to centralize parsing, enrichment, and export.
* Avoid logging sensitive data (PII, credentials). Filter or redact at source or in Collector processors.
Summary
* Logs complement metrics and traces by providing flexible, context-rich events.
* Structured logs improve searchability and analysis; semi-structured logs are a useful compromise.
* OpenTelemetry enriches existing logging frameworks by adding trace/span context and a consistent export pipeline.
* The Collector can ingest logs from files/syslog, transform and enrich them, and export to backends without changing application code.
* Adopt a consistent logging schema and discipline to keep logs actionable and searchable.
 ## Links and references
* OpenTelemetry Logs specification: [https://opentelemetry.io/docs/](https://opentelemetry.io/docs/) (see Logging / Logs)
* Common Log Format (CLF): [https://en.wikipedia.org/wiki/Common\_Log\_Format](https://en.wikipedia.org/wiki/Common_Log_Format)
* OpenTelemetry Collector: [https://opentelemetry.io/docs/collector/](https://opentelemetry.io/docs/collector/)
* Best practices for structured logging: [https://12factor.net/logs](https://12factor.net/logs)
This documentation is built and hosted on [Mintlify](https://mintlify.com), a developer documentation platform.
## Links and references
* OpenTelemetry Logs specification: [https://opentelemetry.io/docs/](https://opentelemetry.io/docs/) (see Logging / Logs)
* Common Log Format (CLF): [https://en.wikipedia.org/wiki/Common\_Log\_Format](https://en.wikipedia.org/wiki/Common_Log_Format)
* OpenTelemetry Collector: [https://opentelemetry.io/docs/collector/](https://opentelemetry.io/docs/collector/)
* Best practices for structured logging: [https://12factor.net/logs](https://12factor.net/logs)
This documentation is built and hosted on [Mintlify](https://mintlify.com), a developer documentation platform.