> ## Documentation Index
> Fetch the complete documentation index at: https://notes.kodekloud.com/llms.txt
> Use this file to discover all available pages before exploring further.
# Dimensions
> Explains metric dimensions as key value attributes that enable splitting filtering grouping and best practices to avoid high cardinality
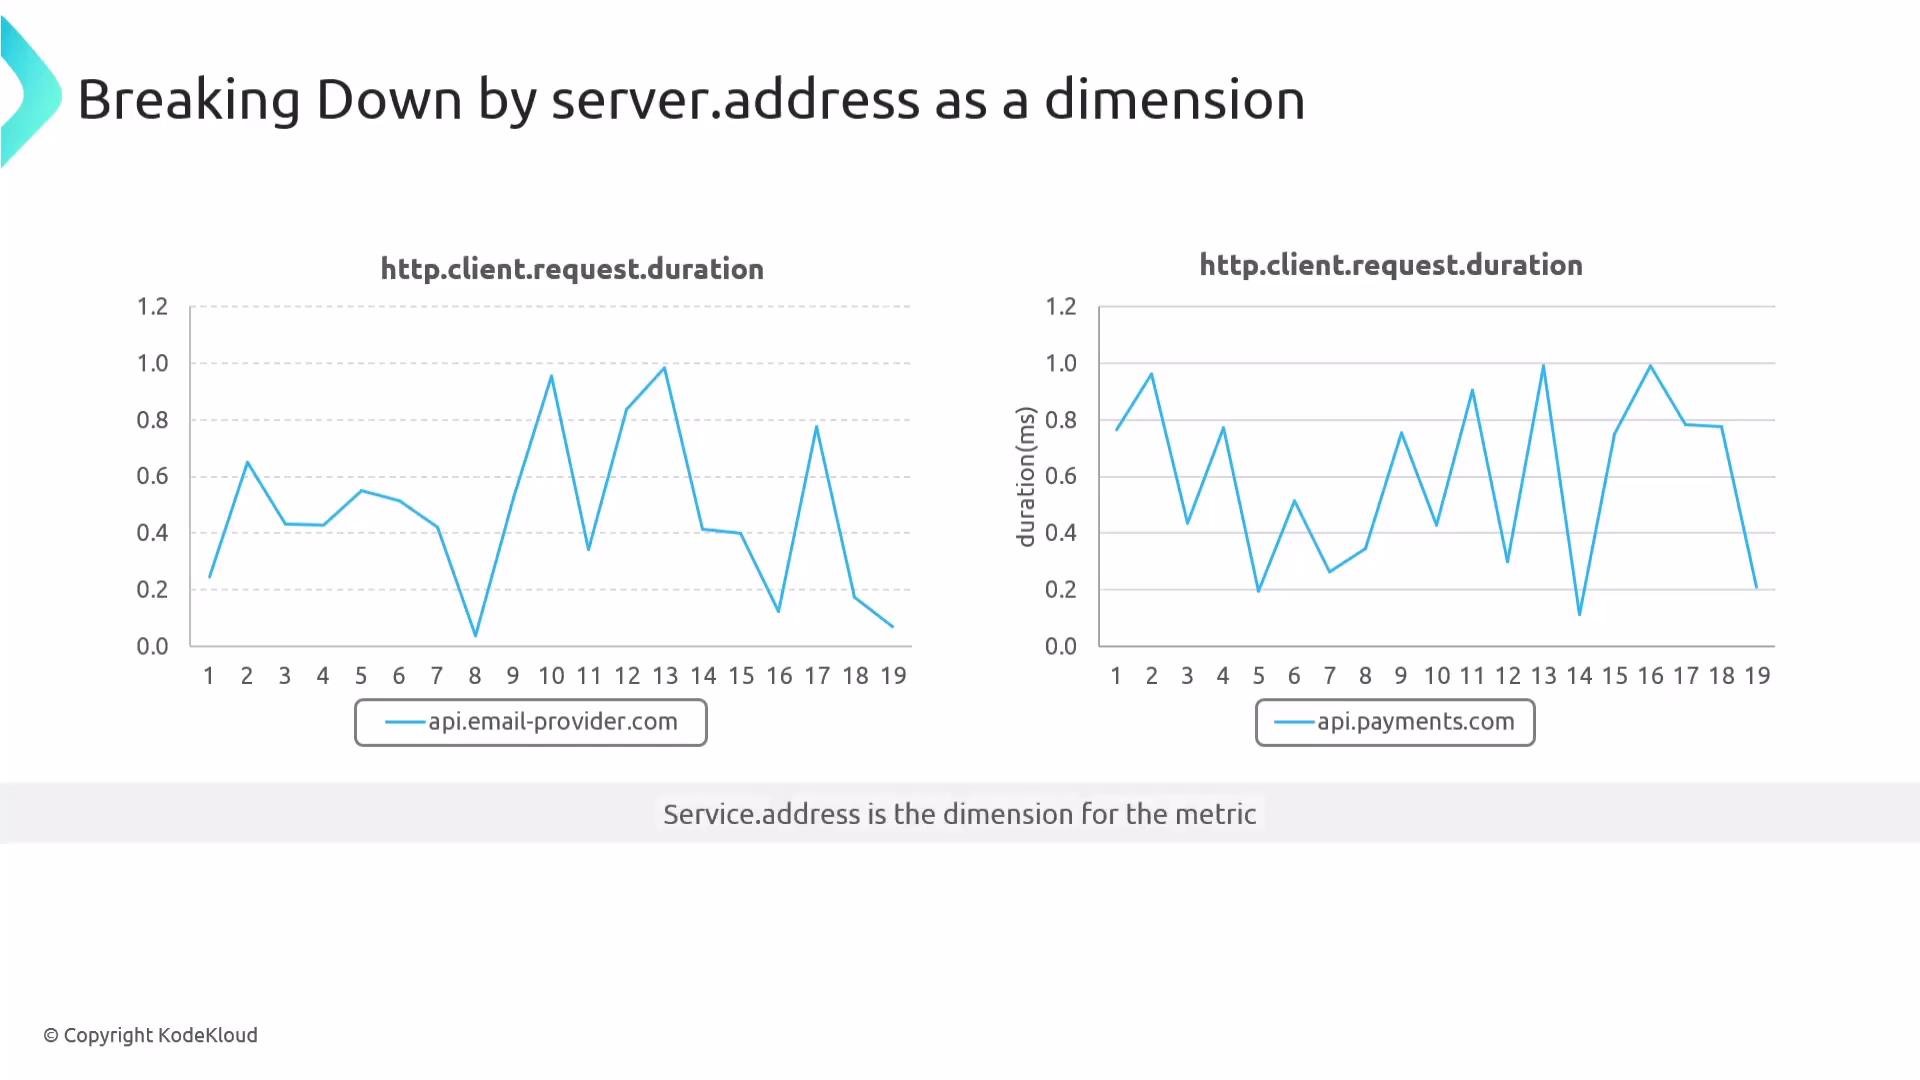
When you view a single line on a metric chart — for example, `http.client.request.duration` — that line often aggregates measurements coming from multiple sources. Dimensions (also called attributes or labels) are key-value pairs attached to each metric data point. They let you split, filter, and group an aggregated metric into meaningful time series so you can investigate and act on what matters.
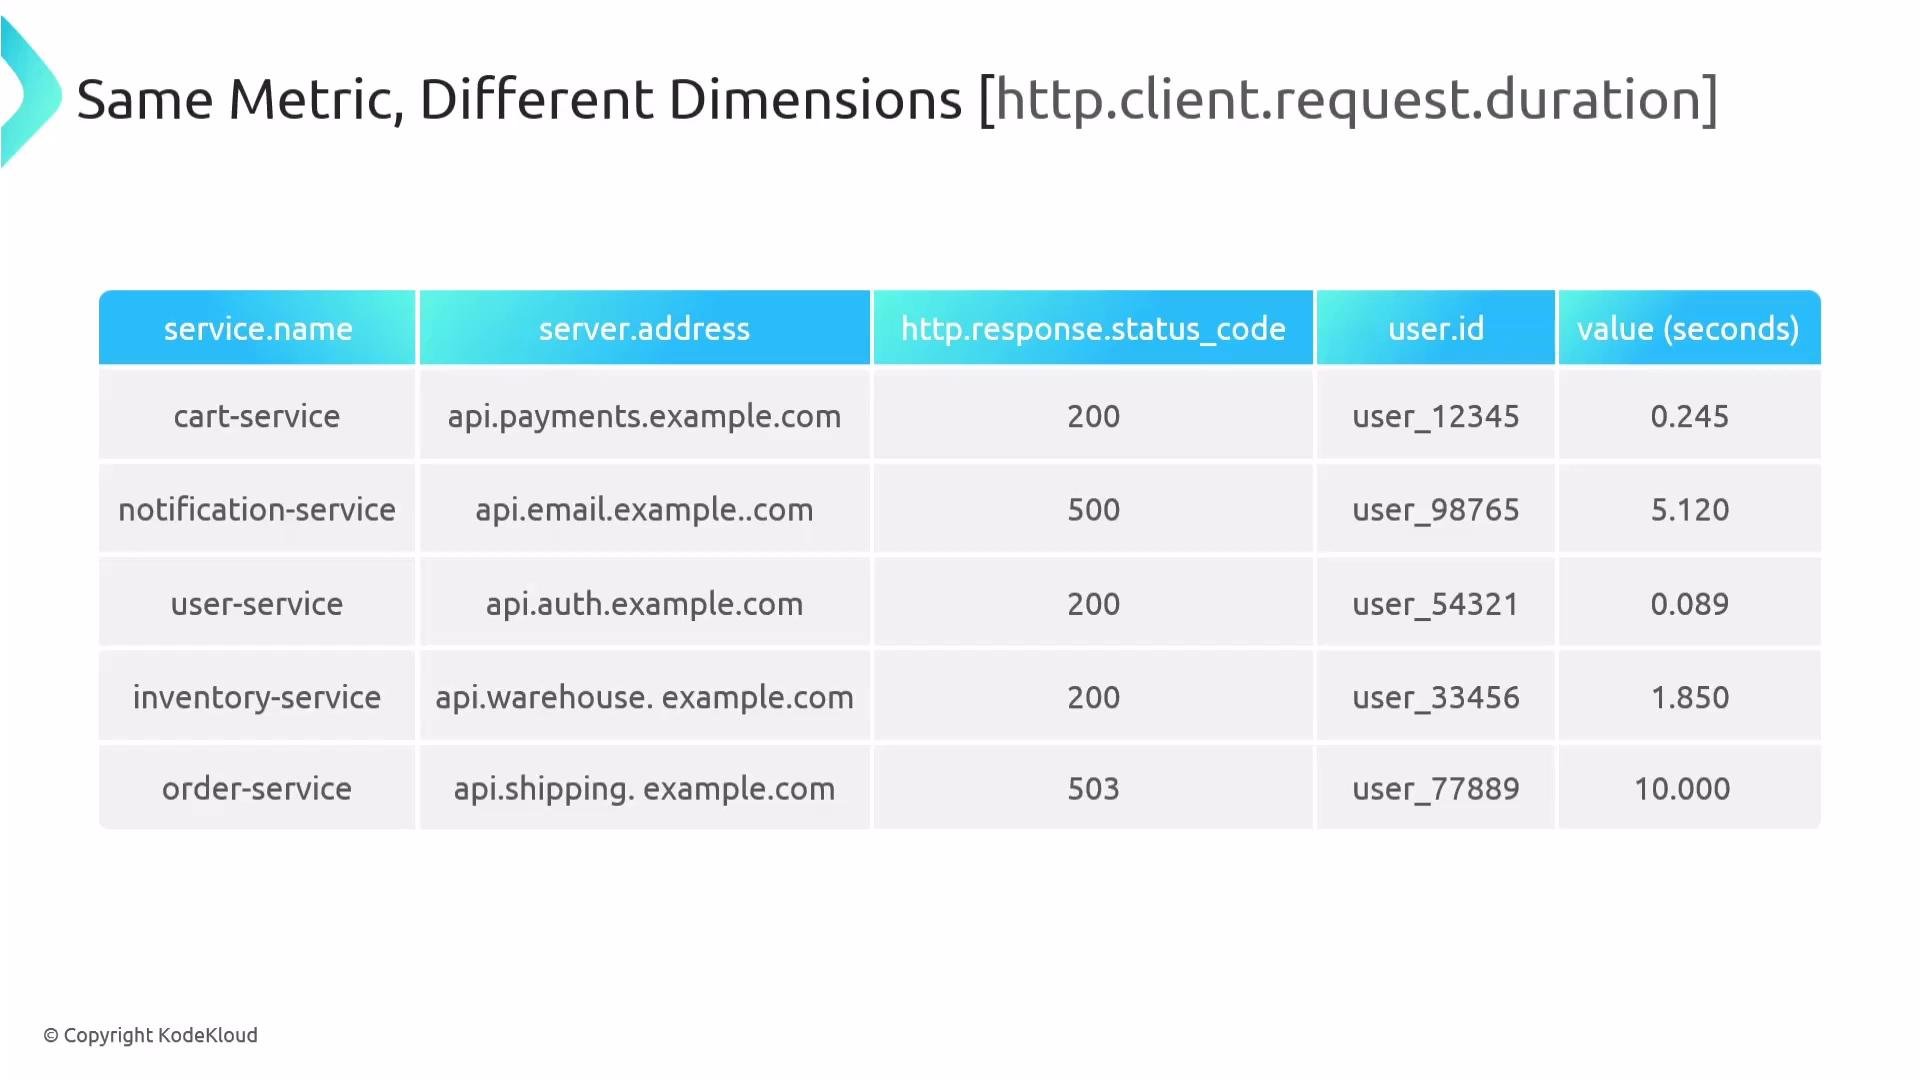
Consider two calls that use the same metric name but originate from different services:
* `cart-service` called `api.payments.com` and returned quickly (245 ms).
* `notification-service` called `api.email.example.com` and was slow (5.12 s).
Each measurement uses the same metric name but includes different attributes (dimensions):
```json theme={null}
{
"service.name": "cart-service",
"server.address": "api.payments.com",
"value": 0.245
}
```
```json theme={null}
{
"service.name": "notification-service",
"server.address": "api.email.example.com",
"value": 5.120
}
```
Split the metric by `service.name` and the single aggregated line becomes two lines — one for `cart-service` and one for `notification-service` — making it obvious which service is experiencing higher latency or variability.
 Below is a realistic representation of what each metric data point might look like in a telemetry export. The two examples share the same metric name, description, and unit, but differ in attributes and value.
Example: cart-service data point
```json theme={null}
{
"name": "http.client.request.duration",
"description": "Client request duration measures the time it takes to receive response headers",
"unit": "s",
"data": {
"data_points": [
{
"attributes": {
"service.name": "cart-service",
"http.response.status_code": "200",
"user.id": "user_12345",
"http.request.method": "GET",
"url.scheme": "https",
"server.address": "api.payments.com"
},
"start_time_unix_nano": 1750856991146576000,
"time_unix_nano": 1750856994117308500,
"value": 0.245,
"exemplars": []
}
]
}
}
```
Example: notification-service data point
```json theme={null}
{
"name": "http.client.request.duration",
"description": "Client request duration measures the time it takes to receive response headers",
"unit": "s",
"data": {
"data_points": [
{
"attributes": {
"service.name": "notification-service",
"http.response.status_code": "500",
"user.id": "user_98765",
"http.request.method": "POST",
"url.scheme": "https",
"server.address": "api.email.example.com"
},
"start_time_unix_nano": 1750856939111465760,
"time_unix_nano": 1750856994117308500,
"value": 5.120,
"exemplars": []
}
]
}
}
```
Note the `user.id` attribute in both examples. While it could be useful for certain analyses, attributes like raw user identifiers are high-cardinality and can drastically increase the number of unique time series, complicating queries and increasing storage and cost.
A dimension (attribute) provides context to a metric data point as a key-value pair. That context enables:
* Filtering the metric data to focus on a subset (for example, one service or one server).
* Grouping to form multiple time series from one metric (for example, one time series per `service.name`).
* Building dashboards that present richer perspectives by combining multiple dimensions.
Below is a realistic representation of what each metric data point might look like in a telemetry export. The two examples share the same metric name, description, and unit, but differ in attributes and value.
Example: cart-service data point
```json theme={null}
{
"name": "http.client.request.duration",
"description": "Client request duration measures the time it takes to receive response headers",
"unit": "s",
"data": {
"data_points": [
{
"attributes": {
"service.name": "cart-service",
"http.response.status_code": "200",
"user.id": "user_12345",
"http.request.method": "GET",
"url.scheme": "https",
"server.address": "api.payments.com"
},
"start_time_unix_nano": 1750856991146576000,
"time_unix_nano": 1750856994117308500,
"value": 0.245,
"exemplars": []
}
]
}
}
```
Example: notification-service data point
```json theme={null}
{
"name": "http.client.request.duration",
"description": "Client request duration measures the time it takes to receive response headers",
"unit": "s",
"data": {
"data_points": [
{
"attributes": {
"service.name": "notification-service",
"http.response.status_code": "500",
"user.id": "user_98765",
"http.request.method": "POST",
"url.scheme": "https",
"server.address": "api.email.example.com"
},
"start_time_unix_nano": 1750856939111465760,
"time_unix_nano": 1750856994117308500,
"value": 5.120,
"exemplars": []
}
]
}
}
```
Note the `user.id` attribute in both examples. While it could be useful for certain analyses, attributes like raw user identifiers are high-cardinality and can drastically increase the number of unique time series, complicating queries and increasing storage and cost.
A dimension (attribute) provides context to a metric data point as a key-value pair. That context enables:
* Filtering the metric data to focus on a subset (for example, one service or one server).
* Grouping to form multiple time series from one metric (for example, one time series per `service.name`).
* Building dashboards that present richer perspectives by combining multiple dimensions.
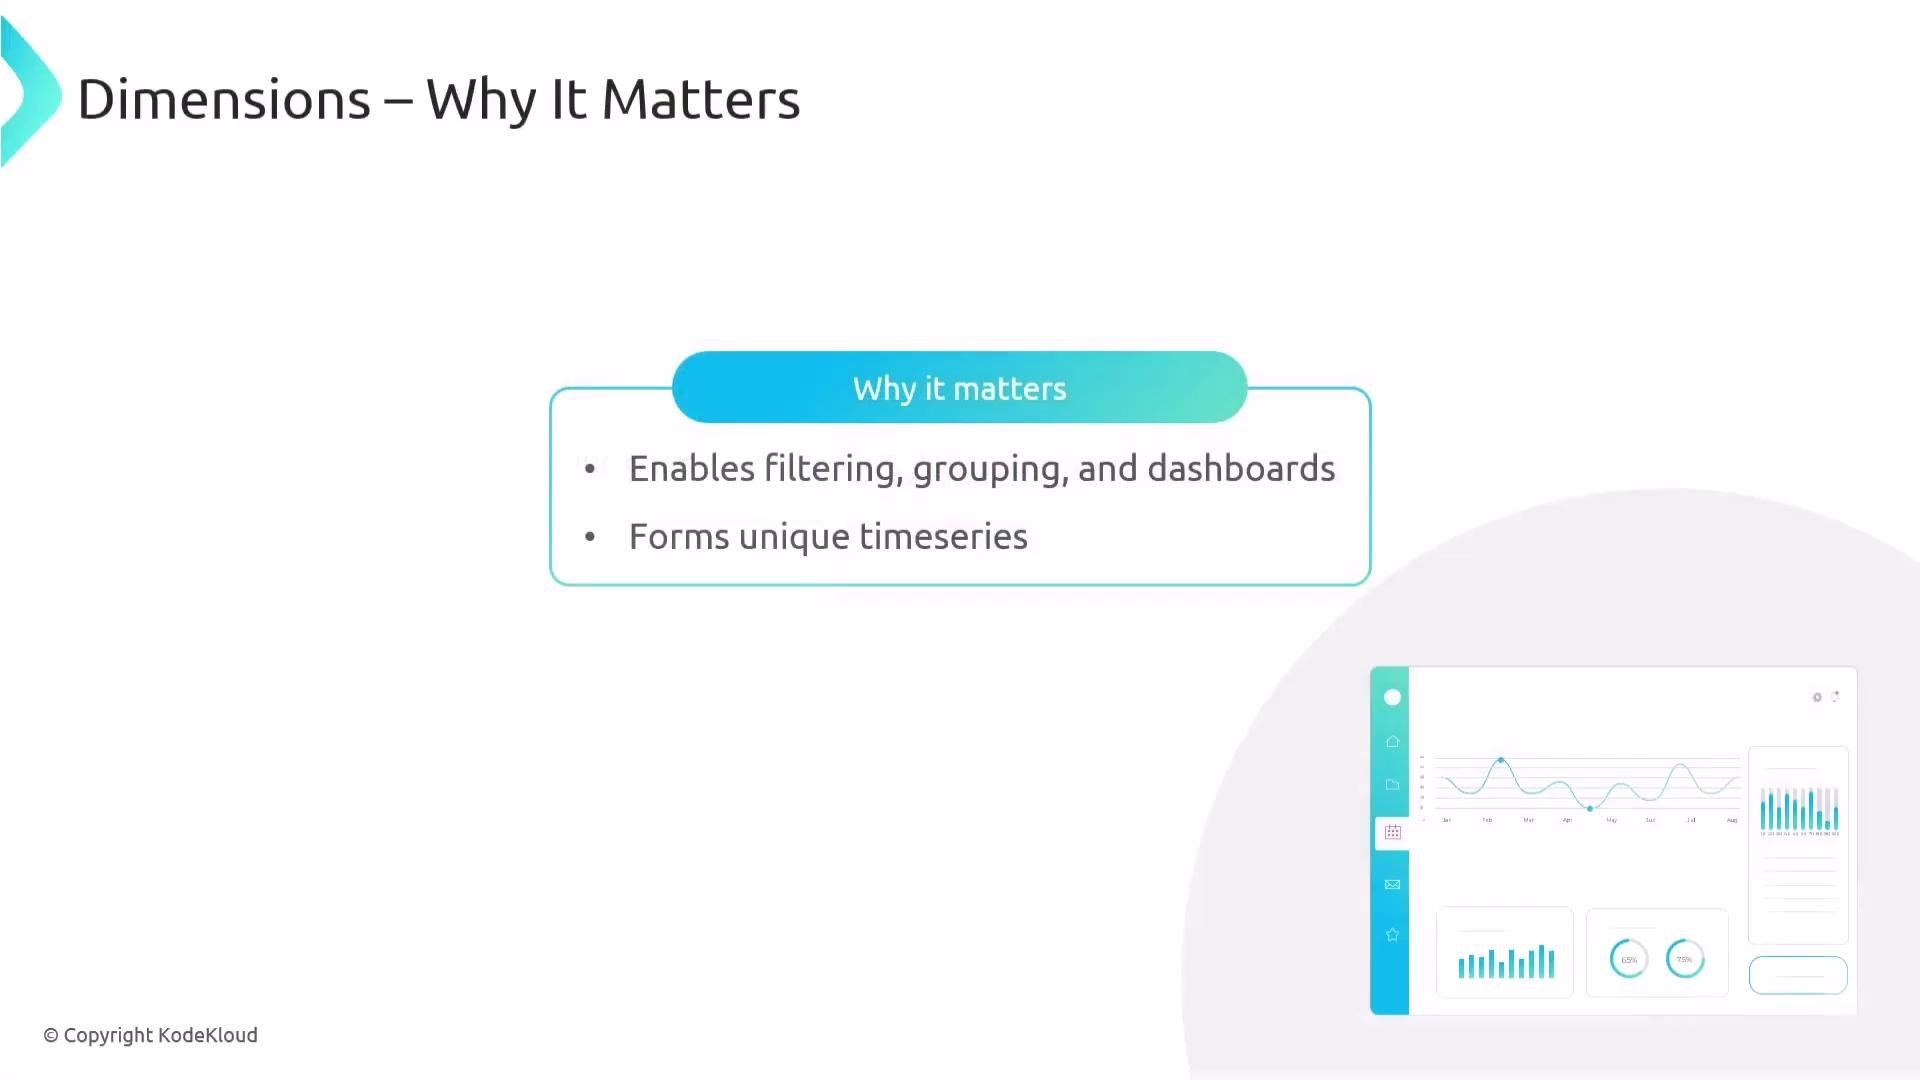 When you break an aggregated metric down by relevant dimensions, you turn one line into multiple meaningful time series. This enables targeted investigation: instead of guessing which component caused a latency spike, you can filter or group by `service.name`, `server.address`, `http.response.status_code`, or other attributes to quickly localize the issue.
 Quick reference — how dimensions are commonly used:
| Operation | Purpose | Example |
| -------------- | ----------------------------------------------------------- | ----------------------------------------------------- |
| Filter | Narrow metric data to a subset for focused inspection | `service.name = "cart-service"` |
| Group / Split | Produce multiple time series from one metric for comparison | `group by service.name` |
| Aggregate | Compute summaries across groups (sum, avg, p99) | `avg(http.client.request.duration) by server.address` |
| Annotate / Tag | Add context for dashboards and alerts | `http.response.status_code = "500"` |
Best practices and considerations:
* Choose stable, meaningful keys (e.g., `service.name`, `region`, `env`).
* Avoid high-cardinality attributes (raw `user.id`, request paths with IDs) on frequently queried metrics.
* Use dimensions to narrow the scope of queries and reduce costs without losing actionable context.
* Follow naming and semantic conventions (e.g., OpenTelemetry attribute names) for consistency across tools.
Use dimensions that assist analysis but avoid introducing unnecessary high-cardinality attributes (like raw user IDs) into frequently queried metrics. High cardinality increases storage, query complexity, and cost.
Dimensions are fundamental to observability: they transform aggregated metrics into actionable time series and provide the context needed to detect, investigate, and resolve issues more efficiently.
Links and references
* [OpenTelemetry Metrics specification](https://opentelemetry.io/docs/reference/specification/metrics/)
* [Observability best practices](https://www.oreilly.com/library/view/observability-engineering/9781492083168/)
* [Prometheus relabeling and labels guide](https://prometheus.io/docs/practices/naming/)
Quick reference — how dimensions are commonly used:
| Operation | Purpose | Example |
| -------------- | ----------------------------------------------------------- | ----------------------------------------------------- |
| Filter | Narrow metric data to a subset for focused inspection | `service.name = "cart-service"` |
| Group / Split | Produce multiple time series from one metric for comparison | `group by service.name` |
| Aggregate | Compute summaries across groups (sum, avg, p99) | `avg(http.client.request.duration) by server.address` |
| Annotate / Tag | Add context for dashboards and alerts | `http.response.status_code = "500"` |
Best practices and considerations:
* Choose stable, meaningful keys (e.g., `service.name`, `region`, `env`).
* Avoid high-cardinality attributes (raw `user.id`, request paths with IDs) on frequently queried metrics.
* Use dimensions to narrow the scope of queries and reduce costs without losing actionable context.
* Follow naming and semantic conventions (e.g., OpenTelemetry attribute names) for consistency across tools.
Use dimensions that assist analysis but avoid introducing unnecessary high-cardinality attributes (like raw user IDs) into frequently queried metrics. High cardinality increases storage, query complexity, and cost.
Dimensions are fundamental to observability: they transform aggregated metrics into actionable time series and provide the context needed to detect, investigate, and resolve issues more efficiently.
Links and references
* [OpenTelemetry Metrics specification](https://opentelemetry.io/docs/reference/specification/metrics/)
* [Observability best practices](https://www.oreilly.com/library/view/observability-engineering/9781492083168/)
* [Prometheus relabeling and labels guide](https://prometheus.io/docs/practices/naming/)