> ## Documentation Index
> Fetch the complete documentation index at: https://notes.kodekloud.com/llms.txt
> Use this file to discover all available pages before exploring further.
# Recap Structural Prop of Metrics
> Overview of metrics' structural properties—monotonicity, temporality, aggregation, and dimensions—with practical guidance for designing cost efficient, accurate, and actionable monitoring and alerting
This lesson revisits the core structural properties of metrics and explains how they influence collection, aggregation, storage, and analysis. Understanding these properties helps you design metrics that are accurate, cost‑efficient, and actionable for monitoring and alerting.
## Monotonicity
* Definition: Whether a metric only increases (monotonic) or can both increase and decrease (non‑monotonic).
* Typical types:
* Monotonic: counters (e.g., `http_requests_total`, `errors_total`) — these only increase until a reset.
* Non‑monotonic: gauges (e.g., CPU usage, temperature, current queue length) — values can rise and fall.
* Why it matters:
* Monotonic counters are ideal for computing rates and totals. You must detect resets (e.g., process restart) when computing deltas.
* For non‑monotonic gauges, use last‑value or instantaneous aggregation semantics.
* Quick rule: apply rate computations only to monotonic counters.
Example (PromQL):
```PromQL theme={null}
rate(http_requests_total[5m])
```
This computes the per‑second request rate from a monotonic counter over a 5‑minute window.
## Temporality
* Definition: How values are reported over time — whether they represent totals, interval deltas, or instantaneous readings.
* Modes and when to use them:
* Cumulative: running total since some epoch (use for overall totals, e.g., lifetime requests).
* Delta: reported change during each collection interval (use for “new” events per interval).
* Gauge (instantaneous): value at the collection time (use for current state like temperature or memory usage).
* Practical guidance:
* Use cumulative when you want to compute rates or long‑term totals.
* Use delta when the instrumentation already emits interval deltas and you want to avoid re‑deriving them.
* Use gauge when the point‑in‑time value is the meaningful metric.
## Aggregation
* Definition: How raw measurements are summarized for storage and visualization.
* Common aggregations:
* `sum` — totals across groups (useful for load).
* `count` — number of samples or occurrences.
* `last-value` — current gauge value.
* histogram / percentiles — latency or size distributions.
* Tradeoffs:
* Histograms capture distribution and percentiles but cost more storage and processing.
* Simple sums/counts are lightweight but lose distributional detail.
* Choose the aggregation that preserves the information you need for SLOs and alerts while controlling storage cost.
## Dimensions (labels / attributes)
* Definition: Key–value attributes attached to each metric sample (for example: `method=GET`, `route=/login`).
* Uses:
* Filtering, grouping, and drilling down to subsets of traffic (e.g., requests for `GET /login`).
* Enabling targeted alerts and dashboards.
* Cardinality considerations:
* Cardinality = number of unique label combinations (time series). Each new high‑cardinality label multiplies series count.
* High‑cardinality labels (e.g., `user_id`, `session_id`) can drastically increase storage and query costs and impair performance.
* Strategies to control cardinality:
* Avoid raw unique identifiers as labels.
* Use sampling, hashing, bucketing, or roll‑ups (e.g., `user_bucket=0..100`) to reduce uniqueness.
* Precompute and emit lower‑cardinality dimensions when possible.
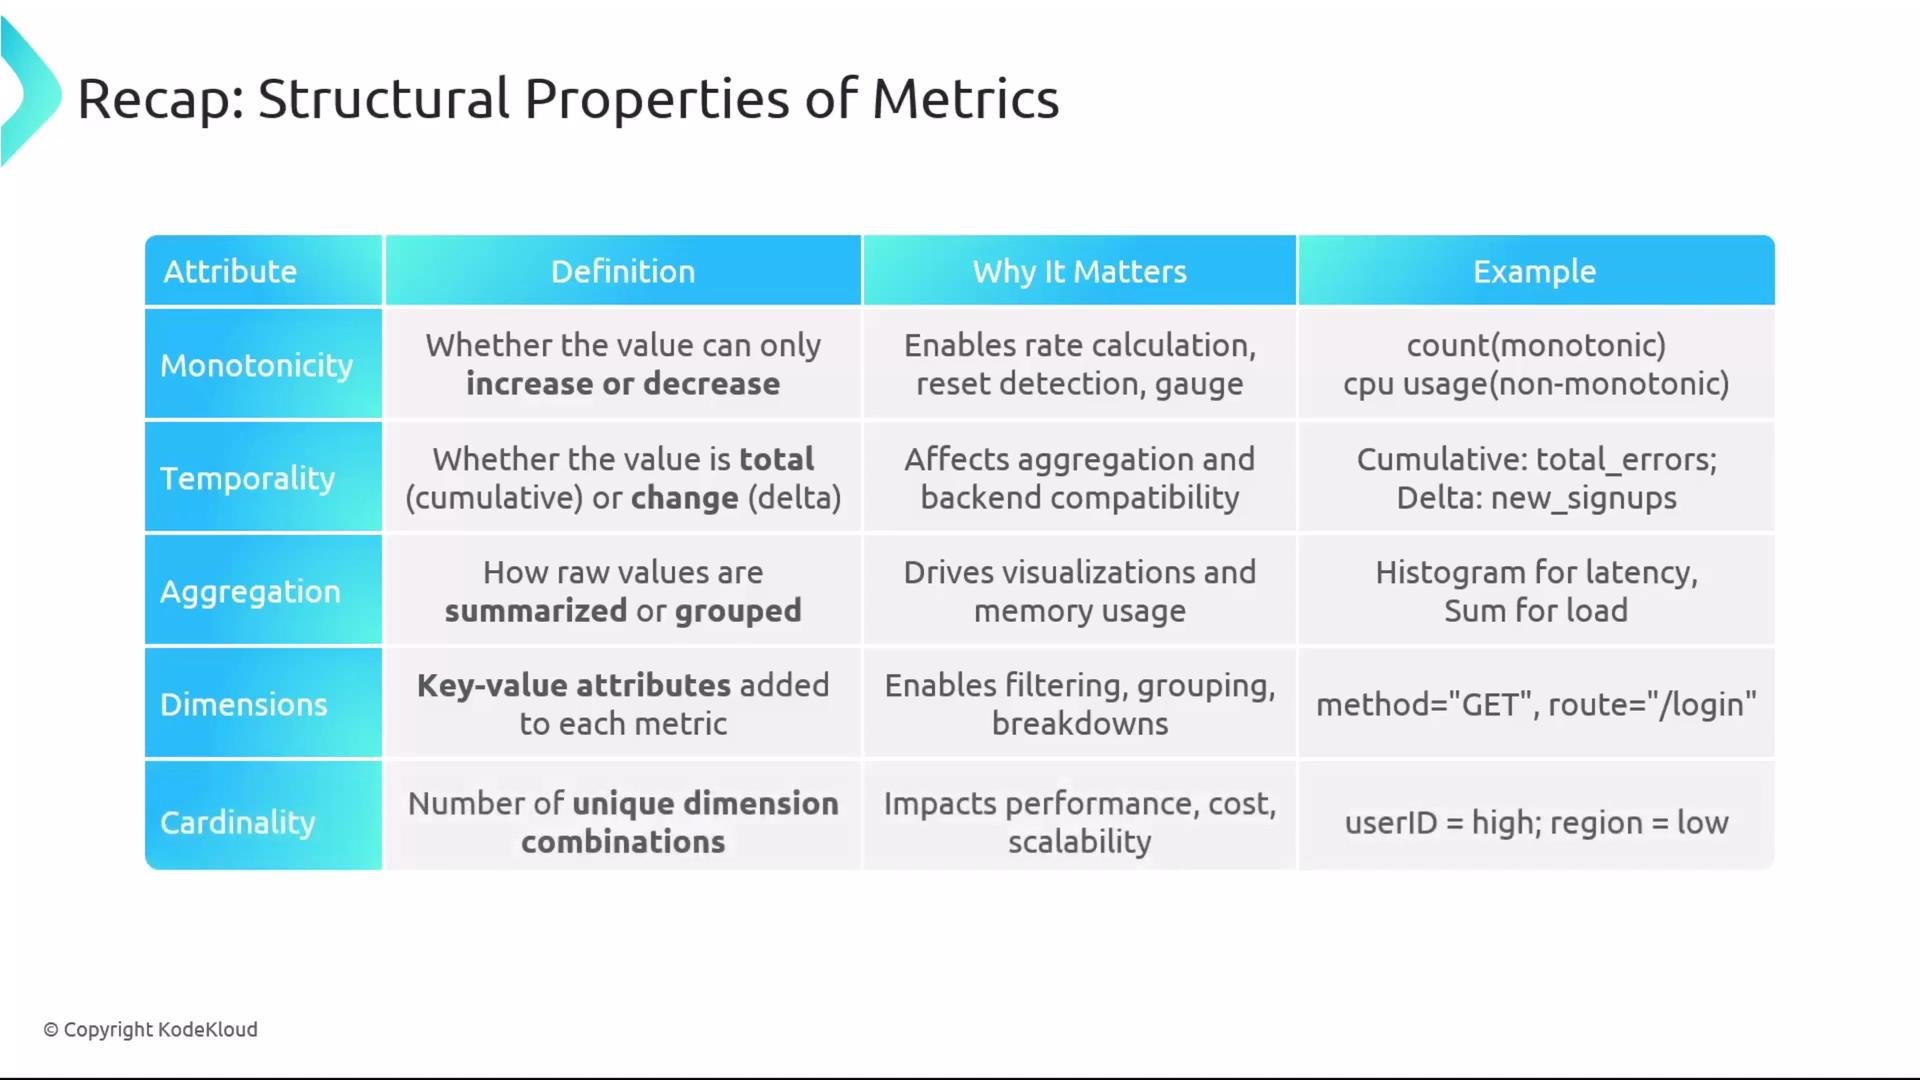 When diagnosing incidents, dimensions let you pinpoint issues to a specific user or session. However, each additional high‑cardinality attribute multiplies the number of unique series and can dramatically raise cost and complexity.
Balance the utility of granular dimensions against the cost of higher cardinality. Consider sampling, rolling up identifiers, or using lower‑cardinality attributes instead of raw IDs when possible.
## Quick reference table
| Property | What it means | Typical types / examples | Best practice |
| ------------ | ----------------------------------------------- | ---------------------------------------------------------------------------------- | --------------------------------------------------------------------------------- |
| Monotonicity | Whether metric only increases or can go up/down | Monotonic: counters (`http_requests_total`). Non‑monotonic: gauges (`cpu_percent`) | Compute rates only on monotonic counters; detect resets |
| Temporality | How values are reported over time | `cumulative`, `delta`, `gauge` | Choose cumulative for totals, delta for interval changes, gauge for point‑in‑time |
| Aggregation | How values are summarized | `sum`, `count`, `last-value`, `histogram/percentiles` | Use histograms for latency; sums for load; balance detail vs. cost |
| Dimensions | Labels attached to samples | `method=GET`, `route=/login` | Limit cardinality; avoid raw identifiers; use bucketing/sampling |
## Practical tips
* When building counters, always handle resets: compute `delta = current - previous` and, if `current < previous`, treat as a reset.
* Use histograms to capture latency distributions without storing every raw measurement.
* Monitor and set alerts for series explosion (sudden cardinality growth) to catch instrumentation issues early.
## Links and further reading
* [OpenTelemetry Metrics](https://opentelemetry.io/docs/specs/metrics/)
* [Prometheus Documentation — Counters and Gauges](https://prometheus.io/docs/concepts/metric_types/)
* [Best Practices for Metric Cardinality](https://www.signalfx.com/blog/metric-cardinality/)
That concludes the recap. Understanding monotonicity, temporality, aggregation, and dimensions ensures your metrics are reliable, efficient, and actionable for both monitoring and alerting.
When diagnosing incidents, dimensions let you pinpoint issues to a specific user or session. However, each additional high‑cardinality attribute multiplies the number of unique series and can dramatically raise cost and complexity.
Balance the utility of granular dimensions against the cost of higher cardinality. Consider sampling, rolling up identifiers, or using lower‑cardinality attributes instead of raw IDs when possible.
## Quick reference table
| Property | What it means | Typical types / examples | Best practice |
| ------------ | ----------------------------------------------- | ---------------------------------------------------------------------------------- | --------------------------------------------------------------------------------- |
| Monotonicity | Whether metric only increases or can go up/down | Monotonic: counters (`http_requests_total`). Non‑monotonic: gauges (`cpu_percent`) | Compute rates only on monotonic counters; detect resets |
| Temporality | How values are reported over time | `cumulative`, `delta`, `gauge` | Choose cumulative for totals, delta for interval changes, gauge for point‑in‑time |
| Aggregation | How values are summarized | `sum`, `count`, `last-value`, `histogram/percentiles` | Use histograms for latency; sums for load; balance detail vs. cost |
| Dimensions | Labels attached to samples | `method=GET`, `route=/login` | Limit cardinality; avoid raw identifiers; use bucketing/sampling |
## Practical tips
* When building counters, always handle resets: compute `delta = current - previous` and, if `current < previous`, treat as a reset.
* Use histograms to capture latency distributions without storing every raw measurement.
* Monitor and set alerts for series explosion (sudden cardinality growth) to catch instrumentation issues early.
## Links and further reading
* [OpenTelemetry Metrics](https://opentelemetry.io/docs/specs/metrics/)
* [Prometheus Documentation — Counters and Gauges](https://prometheus.io/docs/concepts/metric_types/)
* [Best Practices for Metric Cardinality](https://www.signalfx.com/blog/metric-cardinality/)
That concludes the recap. Understanding monotonicity, temporality, aggregation, and dimensions ensures your metrics are reliable, efficient, and actionable for both monitoring and alerting.