> ## Documentation Index
> Fetch the complete documentation index at: https://notes.kodekloud.com/llms.txt
> Use this file to discover all available pages before exploring further.
# The Metrics Data Journey With OpenTelemetry
> Explains how OpenTelemetry metrics flow from in-application events through OTLP transport to time series storage, including transformations, cardinality management, and Collector processing.
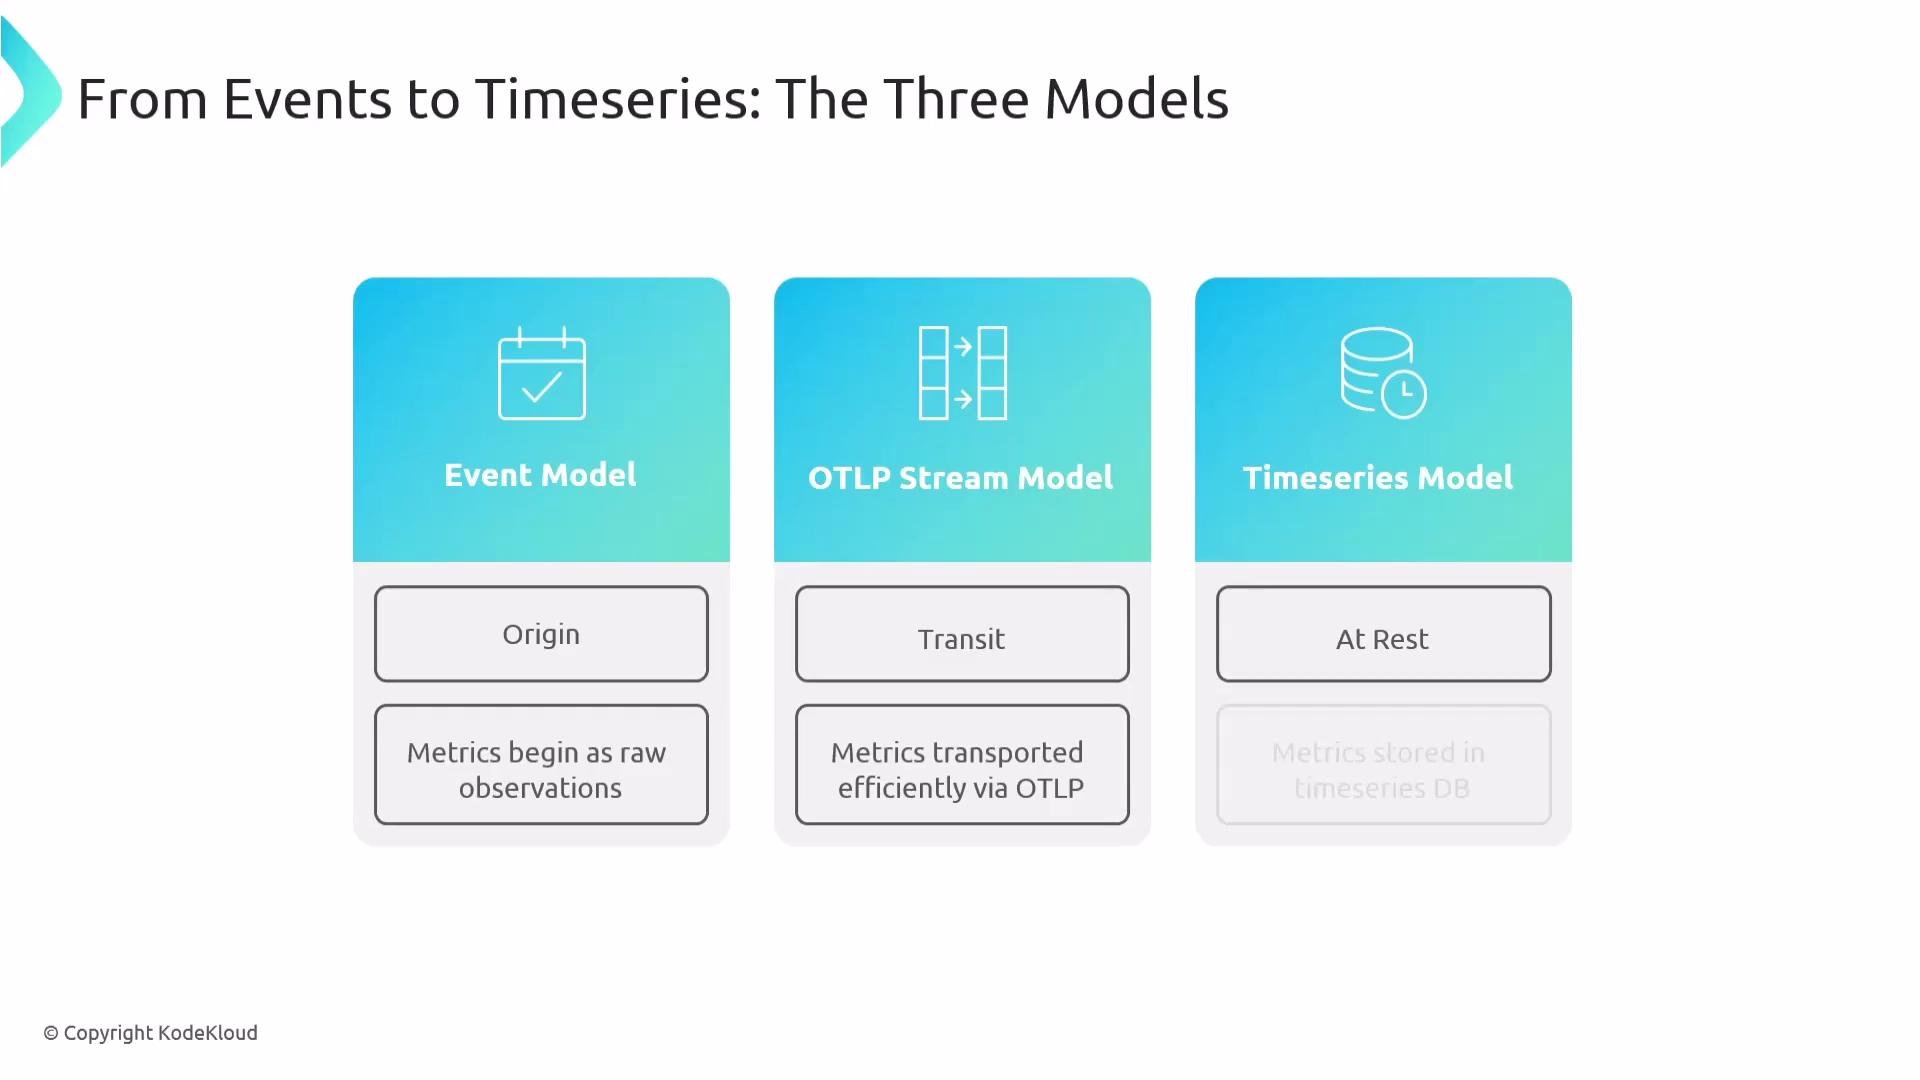
In this lesson we trace how metrics are created, moved, and stored—from raw observations inside applications to time series in backends. The journey has three conceptual stages:
* Event model — where measurements are captured.
* OTLP stream model — the transit/transport format used by SDKs and the Collector.
* Time series model — how metrics are stored and queried at rest.
 Quick comparison
| Stage | Purpose | Key elements |
| ----------------- | ----------------------------------------- | --------------------------------------------------------- |
| Event model | Capture raw observations where they occur | Instrumentation, counters, gauges, histograms, attributes |
| OTLP stream model | Transport and serialize telemetry | OTLP over gRPC/HTTP, Protobuf, SDK/Collector streams |
| Time series model | Store, index, and query metrics over time | Metric name, timestamped points, labels/dimensions |
A closer look at each stage
## Event model (origin)
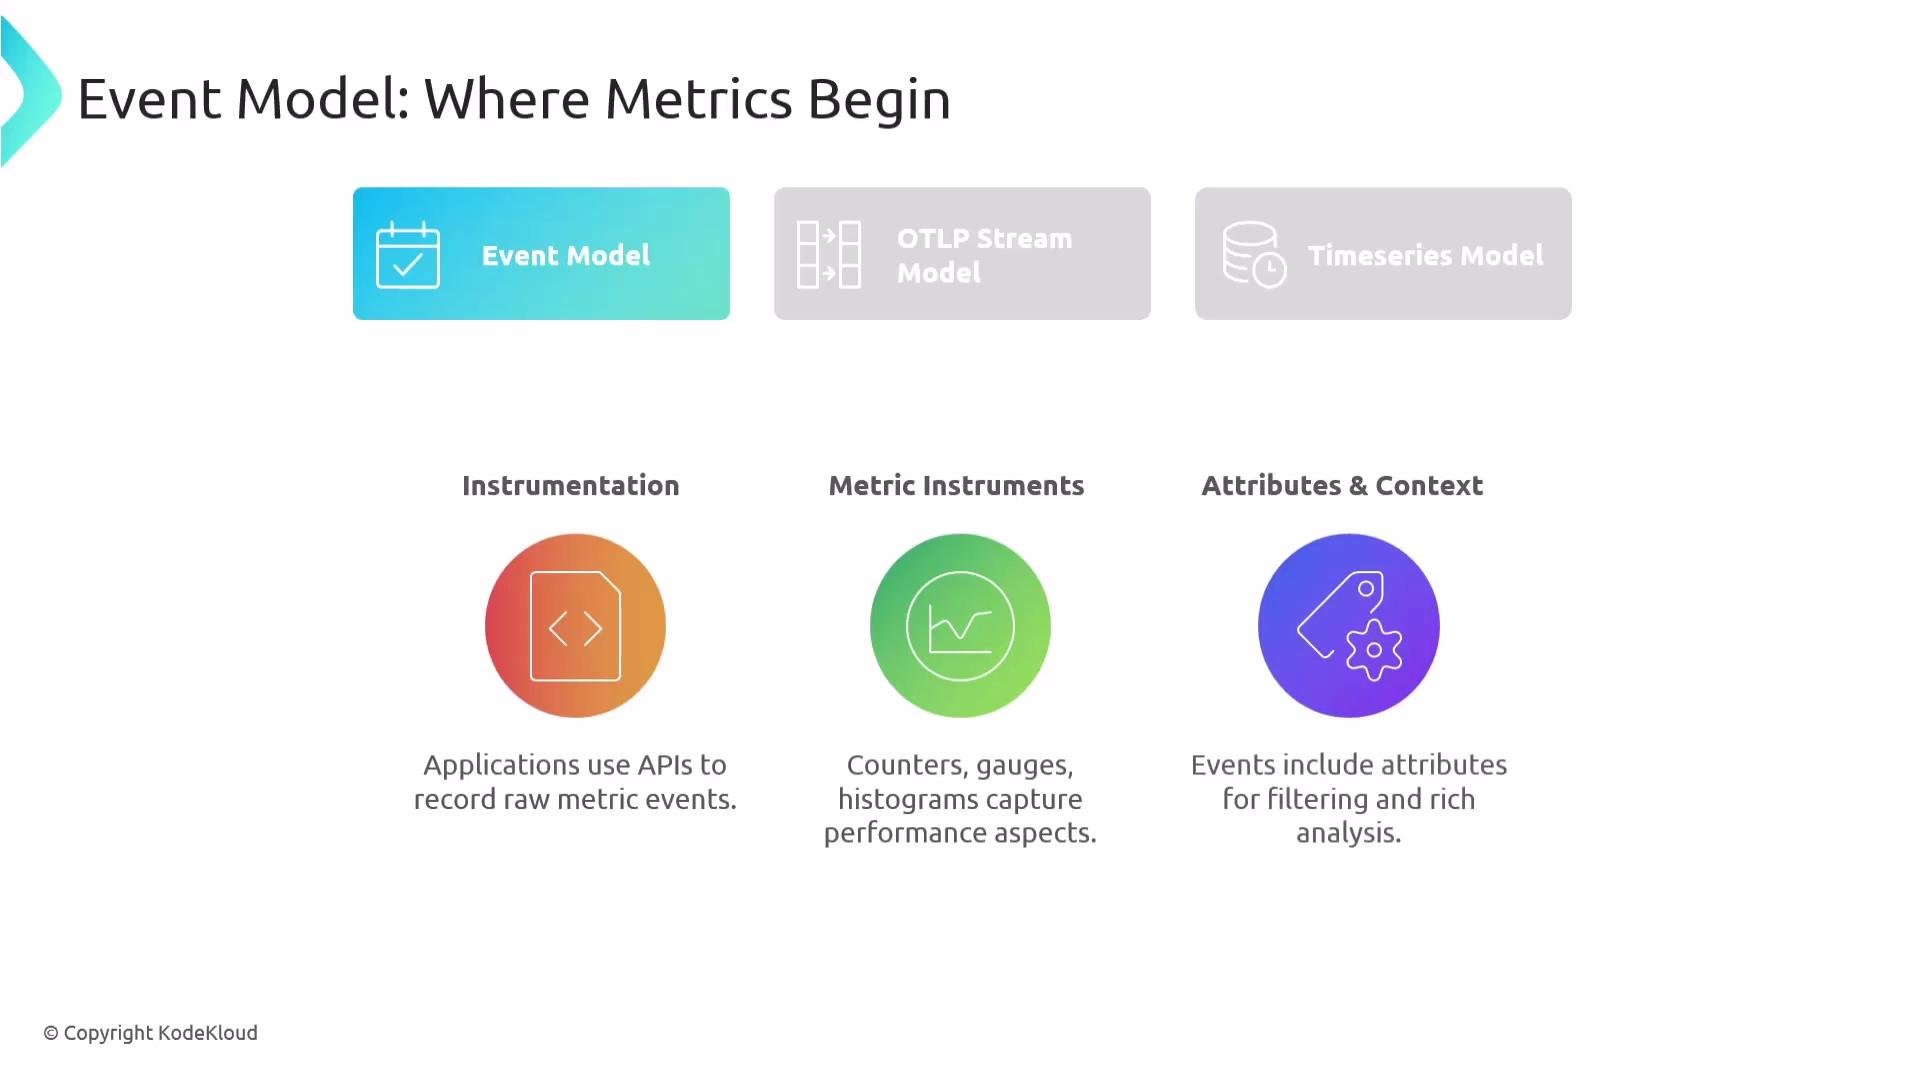
Instrumentation in your applications and libraries records raw observations via APIs exposed by the OpenTelemetry SDKs. Typical metric instruments:
* Counters: monotonic increments (e.g., total requests).
* Up-down counters: increments and decrements (e.g., in-flight requests).
* Gauges: instantaneous values (e.g., CPU usage).
* Histograms: distributions (e.g., request latency buckets).
Each event is enriched with attributes and execution context (for example, `http.method`, `service.name`, `region`). These attributes let you slice, filter, and aggregate metrics downstream.
Quick comparison
| Stage | Purpose | Key elements |
| ----------------- | ----------------------------------------- | --------------------------------------------------------- |
| Event model | Capture raw observations where they occur | Instrumentation, counters, gauges, histograms, attributes |
| OTLP stream model | Transport and serialize telemetry | OTLP over gRPC/HTTP, Protobuf, SDK/Collector streams |
| Time series model | Store, index, and query metrics over time | Metric name, timestamped points, labels/dimensions |
A closer look at each stage
## Event model (origin)
Instrumentation in your applications and libraries records raw observations via APIs exposed by the OpenTelemetry SDKs. Typical metric instruments:
* Counters: monotonic increments (e.g., total requests).
* Up-down counters: increments and decrements (e.g., in-flight requests).
* Gauges: instantaneous values (e.g., CPU usage).
* Histograms: distributions (e.g., request latency buckets).
Each event is enriched with attributes and execution context (for example, `http.method`, `service.name`, `region`). These attributes let you slice, filter, and aggregate metrics downstream.
 ## OTLP stream model (in motion)
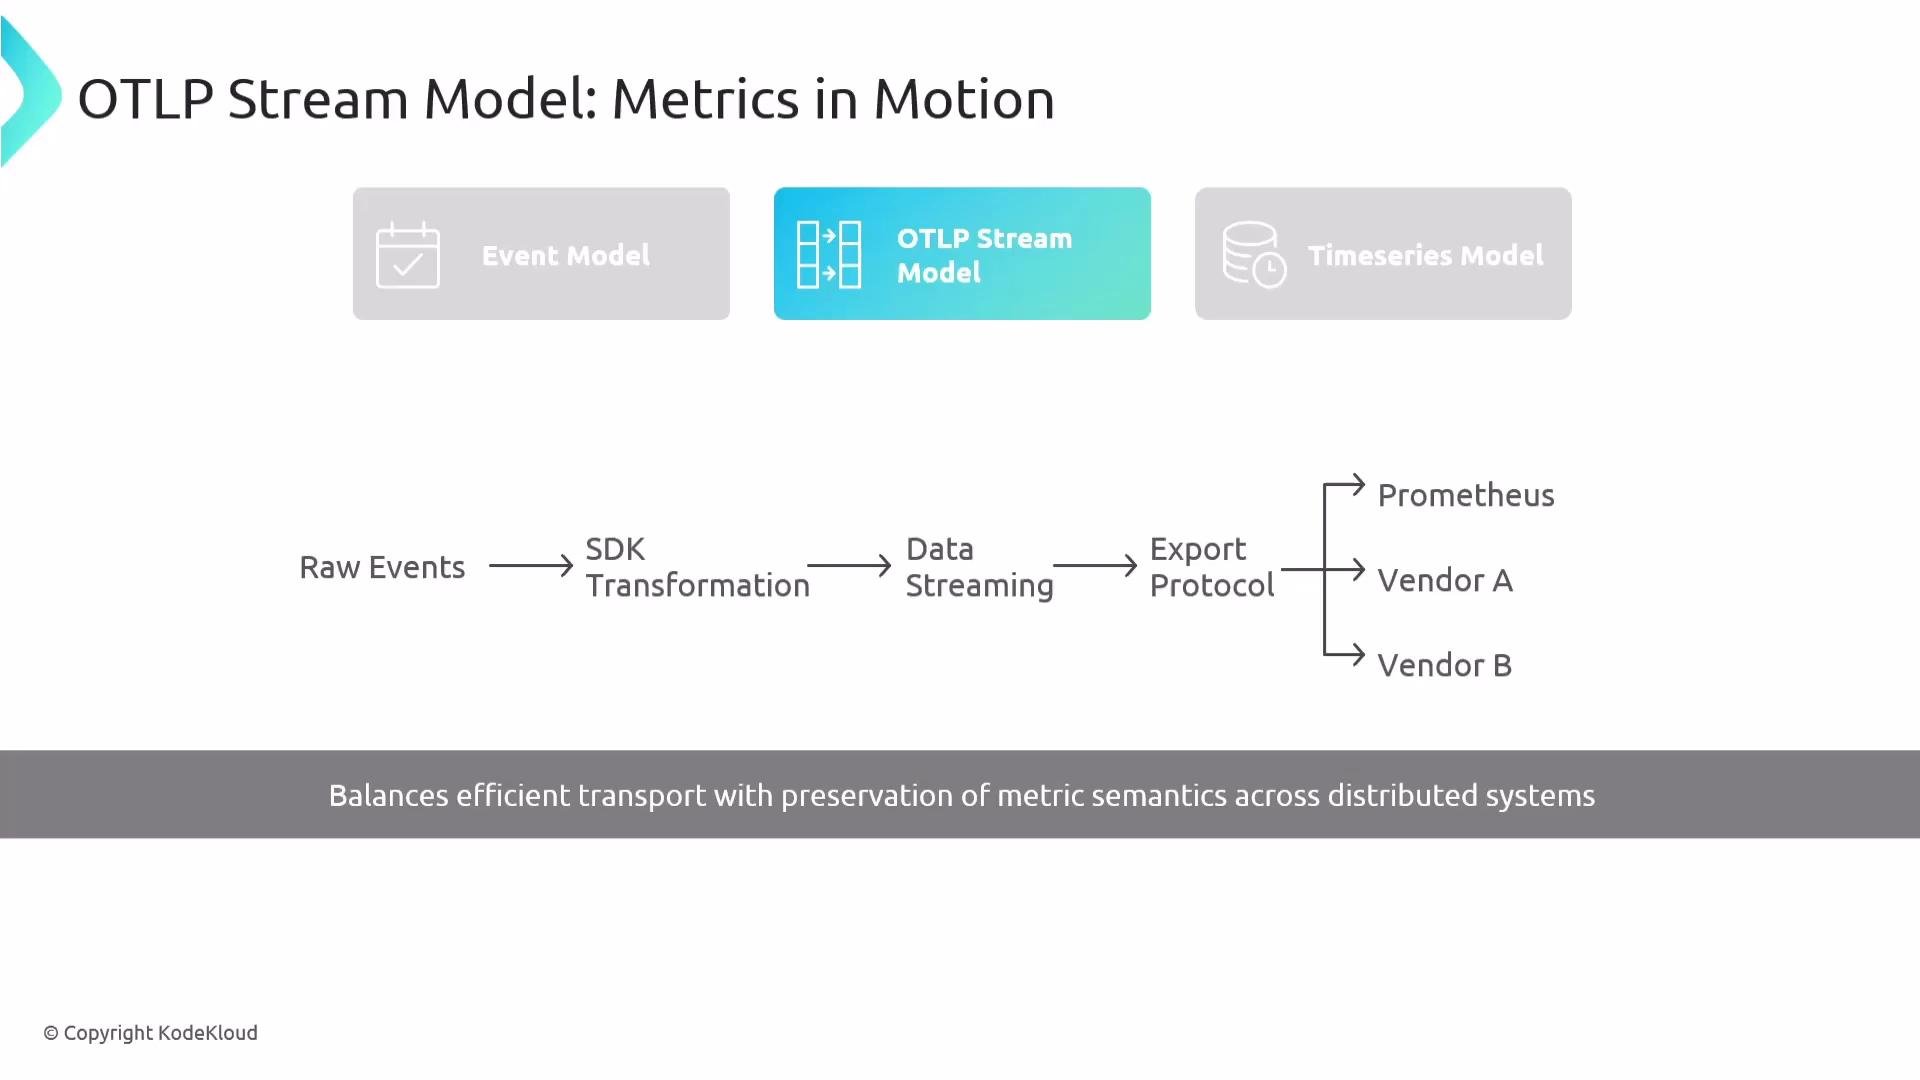
The SDK converts recorded events into a structured OTLP stream. OTLP (OpenTelemetry Protocol) is the canonical serialization/export format and is typically carried over gRPC or HTTP with Protobuf encoding. Important points:
* The OTLP stream preserves metric semantics and all attributes so downstream systems interpret data consistently.
* Streams are commonly sent to the OpenTelemetry Collector or directly to backend ingestion endpoints.
* Adapters/bridges can convert OTLP to other ingestion formats (for example, Prometheus exposition) when necessary.
Useful links:
* OTLP spec: [https://opentelemetry.io/docs/reference/specification/protocol/otlp/](https://opentelemetry.io/docs/reference/specification/protocol/otlp/)
* SDK overview: [https://opentelemetry.io/docs/concepts/sdk/](https://opentelemetry.io/docs/concepts/sdk/)
* gRPC: [https://grpc.io](https://grpc.io)
* Protobuf: [https://developers.google.com/protocol-buffers](https://developers.google.com/protocol-buffers)
## OTLP stream model (in motion)
The SDK converts recorded events into a structured OTLP stream. OTLP (OpenTelemetry Protocol) is the canonical serialization/export format and is typically carried over gRPC or HTTP with Protobuf encoding. Important points:
* The OTLP stream preserves metric semantics and all attributes so downstream systems interpret data consistently.
* Streams are commonly sent to the OpenTelemetry Collector or directly to backend ingestion endpoints.
* Adapters/bridges can convert OTLP to other ingestion formats (for example, Prometheus exposition) when necessary.
Useful links:
* OTLP spec: [https://opentelemetry.io/docs/reference/specification/protocol/otlp/](https://opentelemetry.io/docs/reference/specification/protocol/otlp/)
* SDK overview: [https://opentelemetry.io/docs/concepts/sdk/](https://opentelemetry.io/docs/concepts/sdk/)
* gRPC: [https://grpc.io](https://grpc.io)
* Protobuf: [https://developers.google.com/protocol-buffers](https://developers.google.com/protocol-buffers)
 ## Time series model (at rest)
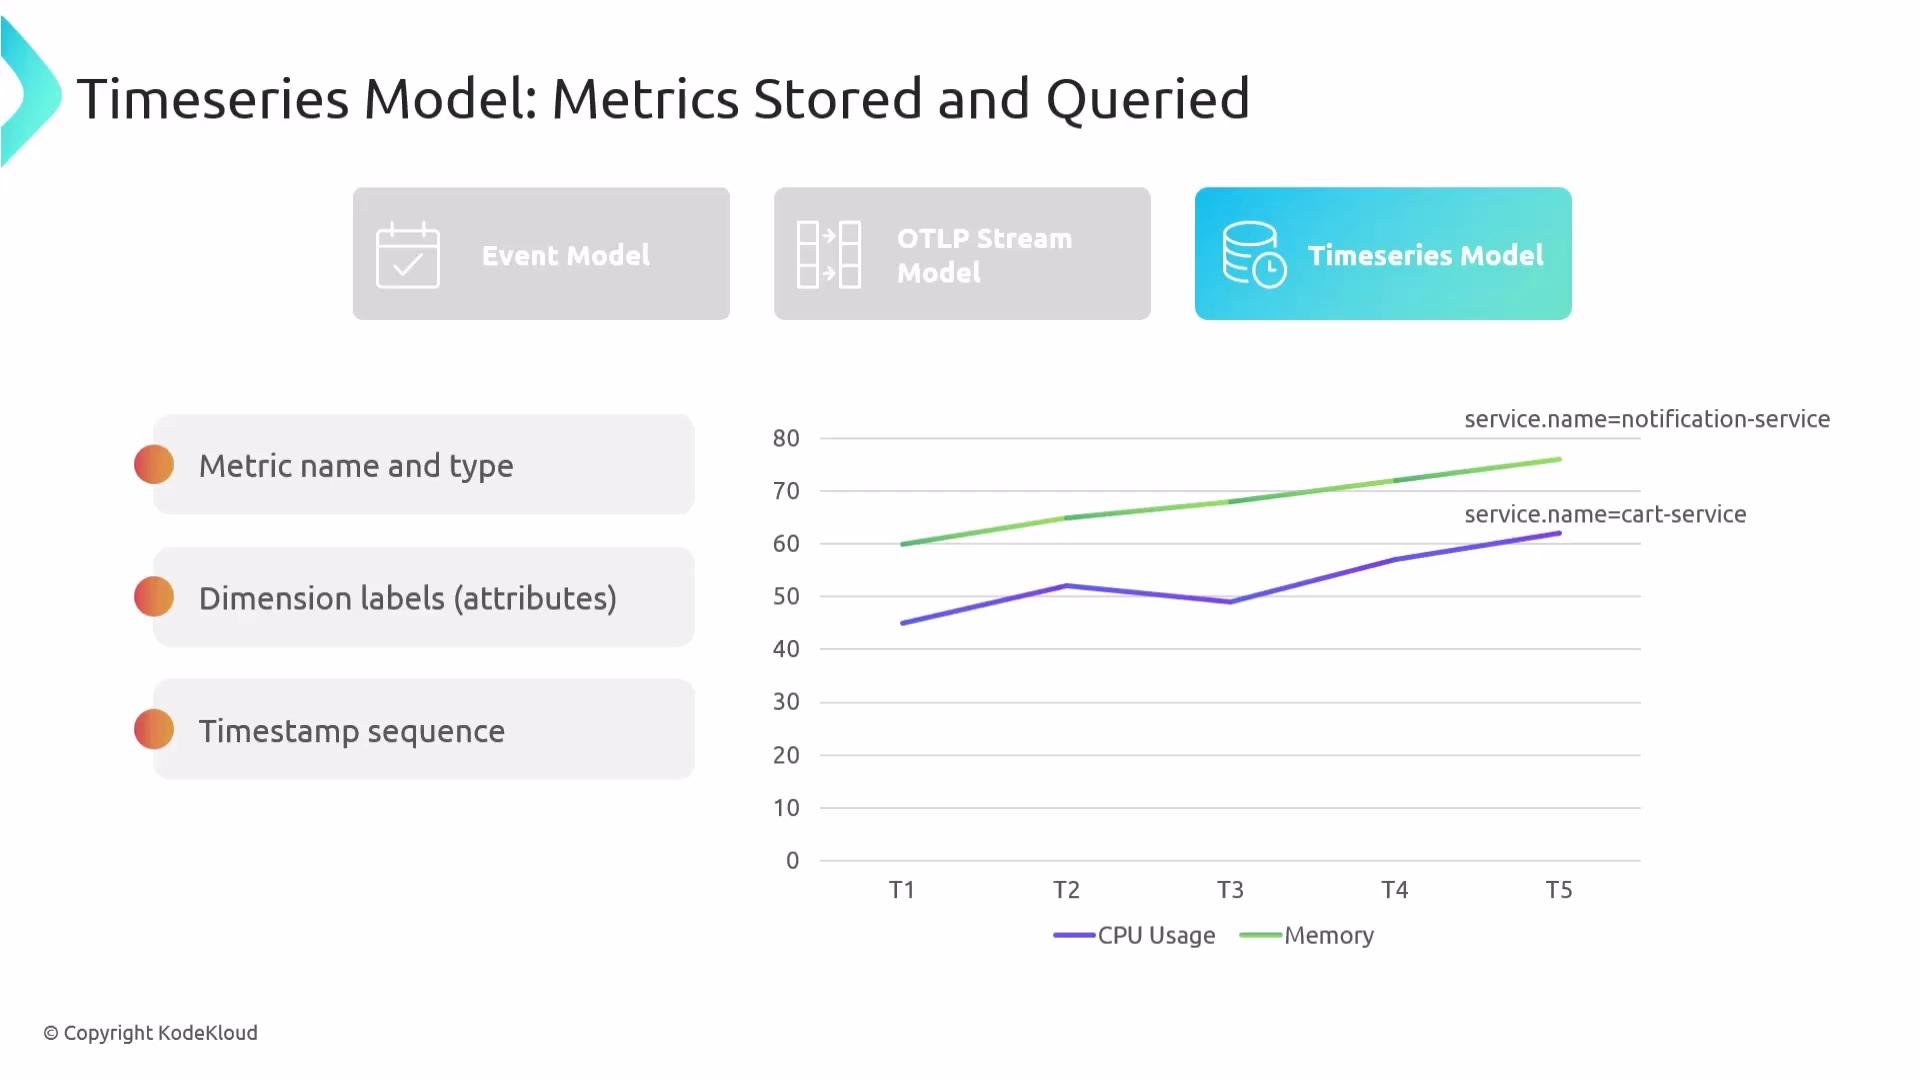
When a backend ingests metrics, it typically stores them as time series: each series has a metric name, an ordered sequence of timestamped points, values, and a set of labels (dimensions). This model supports:
* Grouping and slicing by labels (service, region, instance).
* Time-window aggregations (rate, sum, min, max).
* Long-term trend analysis and alerting.
## Time series model (at rest)
When a backend ingests metrics, it typically stores them as time series: each series has a metric name, an ordered sequence of timestamped points, values, and a set of labels (dimensions). This model supports:
* Grouping and slicing by labels (service, region, instance).
* Time-window aggregations (rate, sum, min, max).
* Long-term trend analysis and alerting.
 Transformations applied before storage
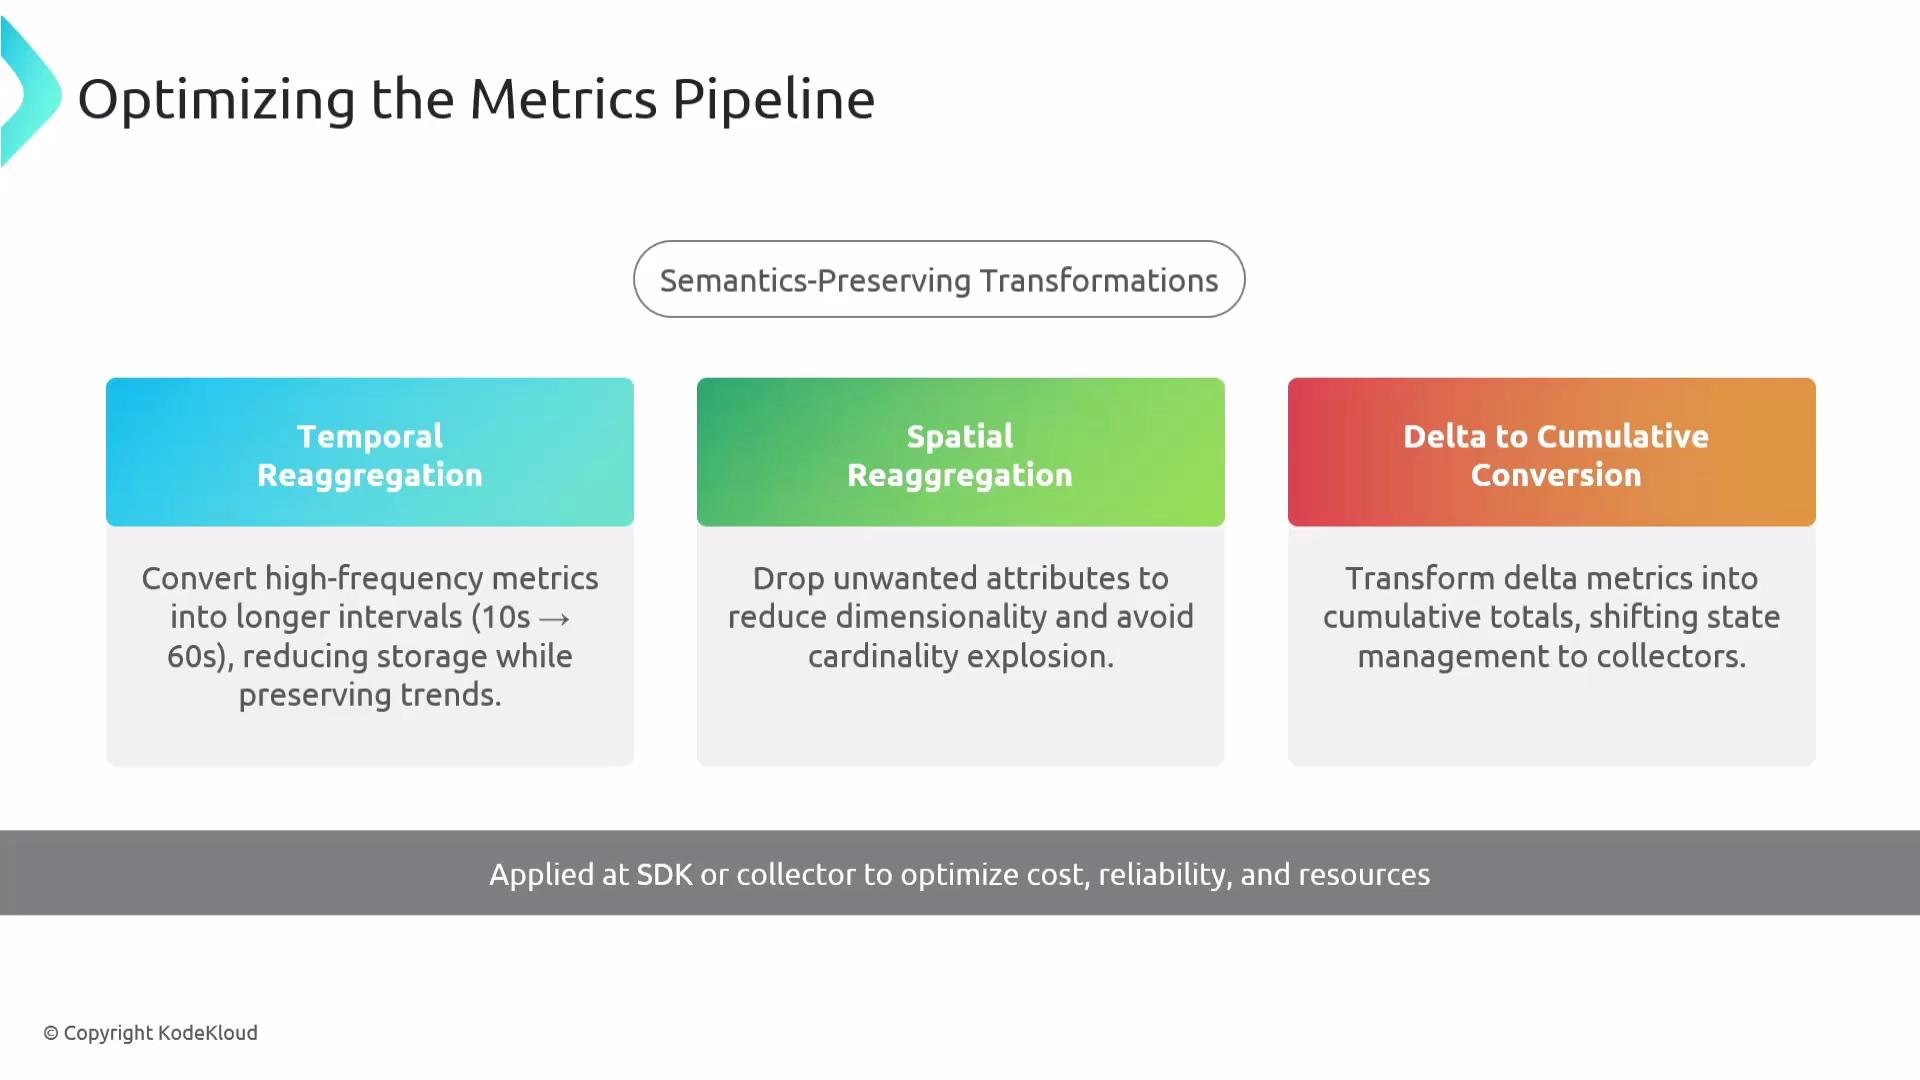
Before metrics reach permanent storage, pipelines often transform them to optimize cost, performance, and usefulness. Common transformations:
* Temporal re-aggregation (downsampling): combine many high-frequency samples into fewer points (for example, average six 10-second samples into one 1-minute point). Typical aggregations: sum, average, min, max.
* Spatial re-aggregation (rollup/dimensionality reduction): drop or aggregate attributes to reduce distinct series and avoid cardinality explosion.
* Delta ↔ cumulative conversion: convert between delta (incremental) and cumulative counters depending on backend expectations.
When implemented correctly these transformations are semantics-preserving but can greatly reduce storage and query cost.
Transformations applied before storage
Before metrics reach permanent storage, pipelines often transform them to optimize cost, performance, and usefulness. Common transformations:
* Temporal re-aggregation (downsampling): combine many high-frequency samples into fewer points (for example, average six 10-second samples into one 1-minute point). Typical aggregations: sum, average, min, max.
* Spatial re-aggregation (rollup/dimensionality reduction): drop or aggregate attributes to reduce distinct series and avoid cardinality explosion.
* Delta ↔ cumulative conversion: convert between delta (incremental) and cumulative counters depending on backend expectations.
When implemented correctly these transformations are semantics-preserving but can greatly reduce storage and query cost.
 Be careful with attribute cardinality. High-cardinality dimensions (e.g., user IDs, request IDs) can produce a massive number of series and dramatically increase storage and query costs. Use spatial re-aggregation, hashing, or attribute filtering to control cardinality.
Collector: where much of the pipeline intelligence lives
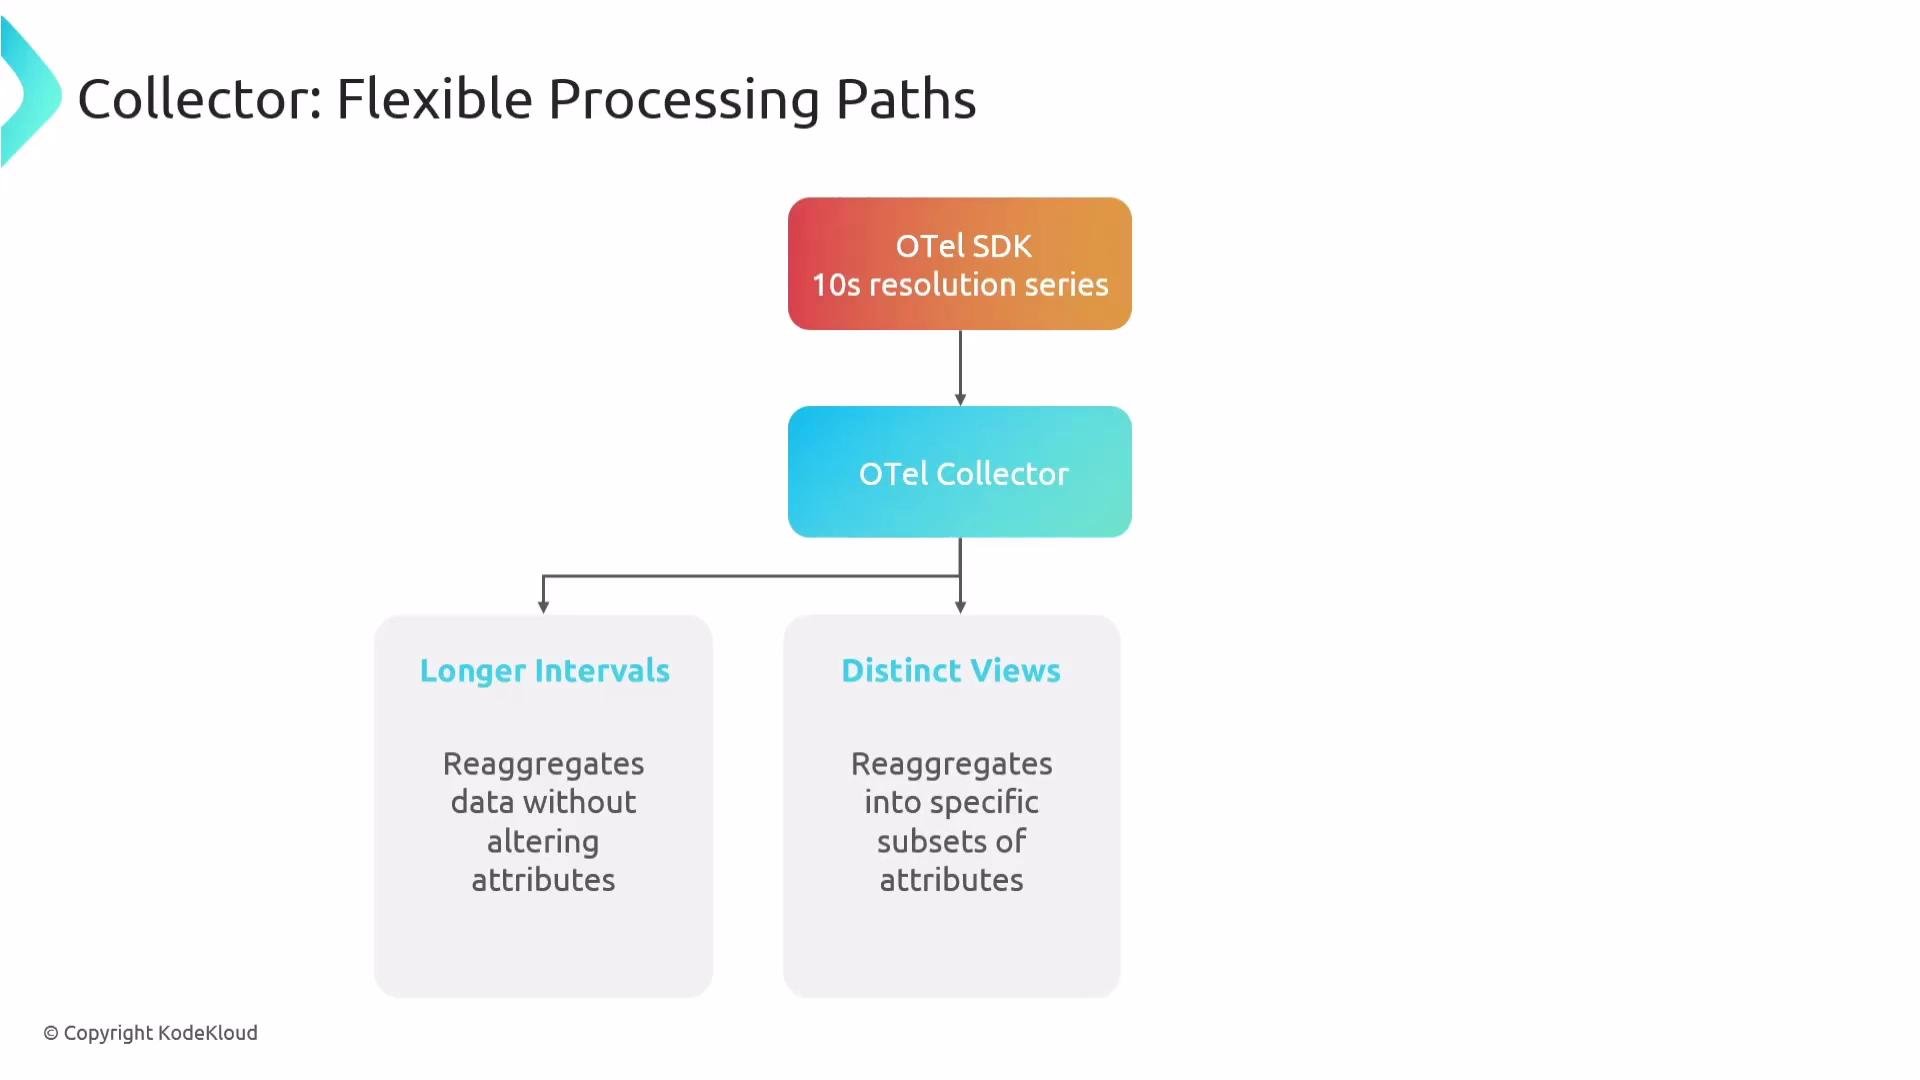
* The OpenTelemetry Collector can receive OTLP streams and apply processing before export.
* Common Collector tasks: temporal re-aggregation, spatial rollups, delta-to-cumulative conversion, filtering, and creating alternate views (for example, CPU by region).
* The Collector can forward raw metrics unchanged or produce multiple transformed pipelines to different backends.
* Because it sits between SDKs and backends, the Collector is the central place to apply consistent transformations and policies.
Be careful with attribute cardinality. High-cardinality dimensions (e.g., user IDs, request IDs) can produce a massive number of series and dramatically increase storage and query costs. Use spatial re-aggregation, hashing, or attribute filtering to control cardinality.
Collector: where much of the pipeline intelligence lives
* The OpenTelemetry Collector can receive OTLP streams and apply processing before export.
* Common Collector tasks: temporal re-aggregation, spatial rollups, delta-to-cumulative conversion, filtering, and creating alternate views (for example, CPU by region).
* The Collector can forward raw metrics unchanged or produce multiple transformed pipelines to different backends.
* Because it sits between SDKs and backends, the Collector is the central place to apply consistent transformations and policies.
 Recap and practical implications
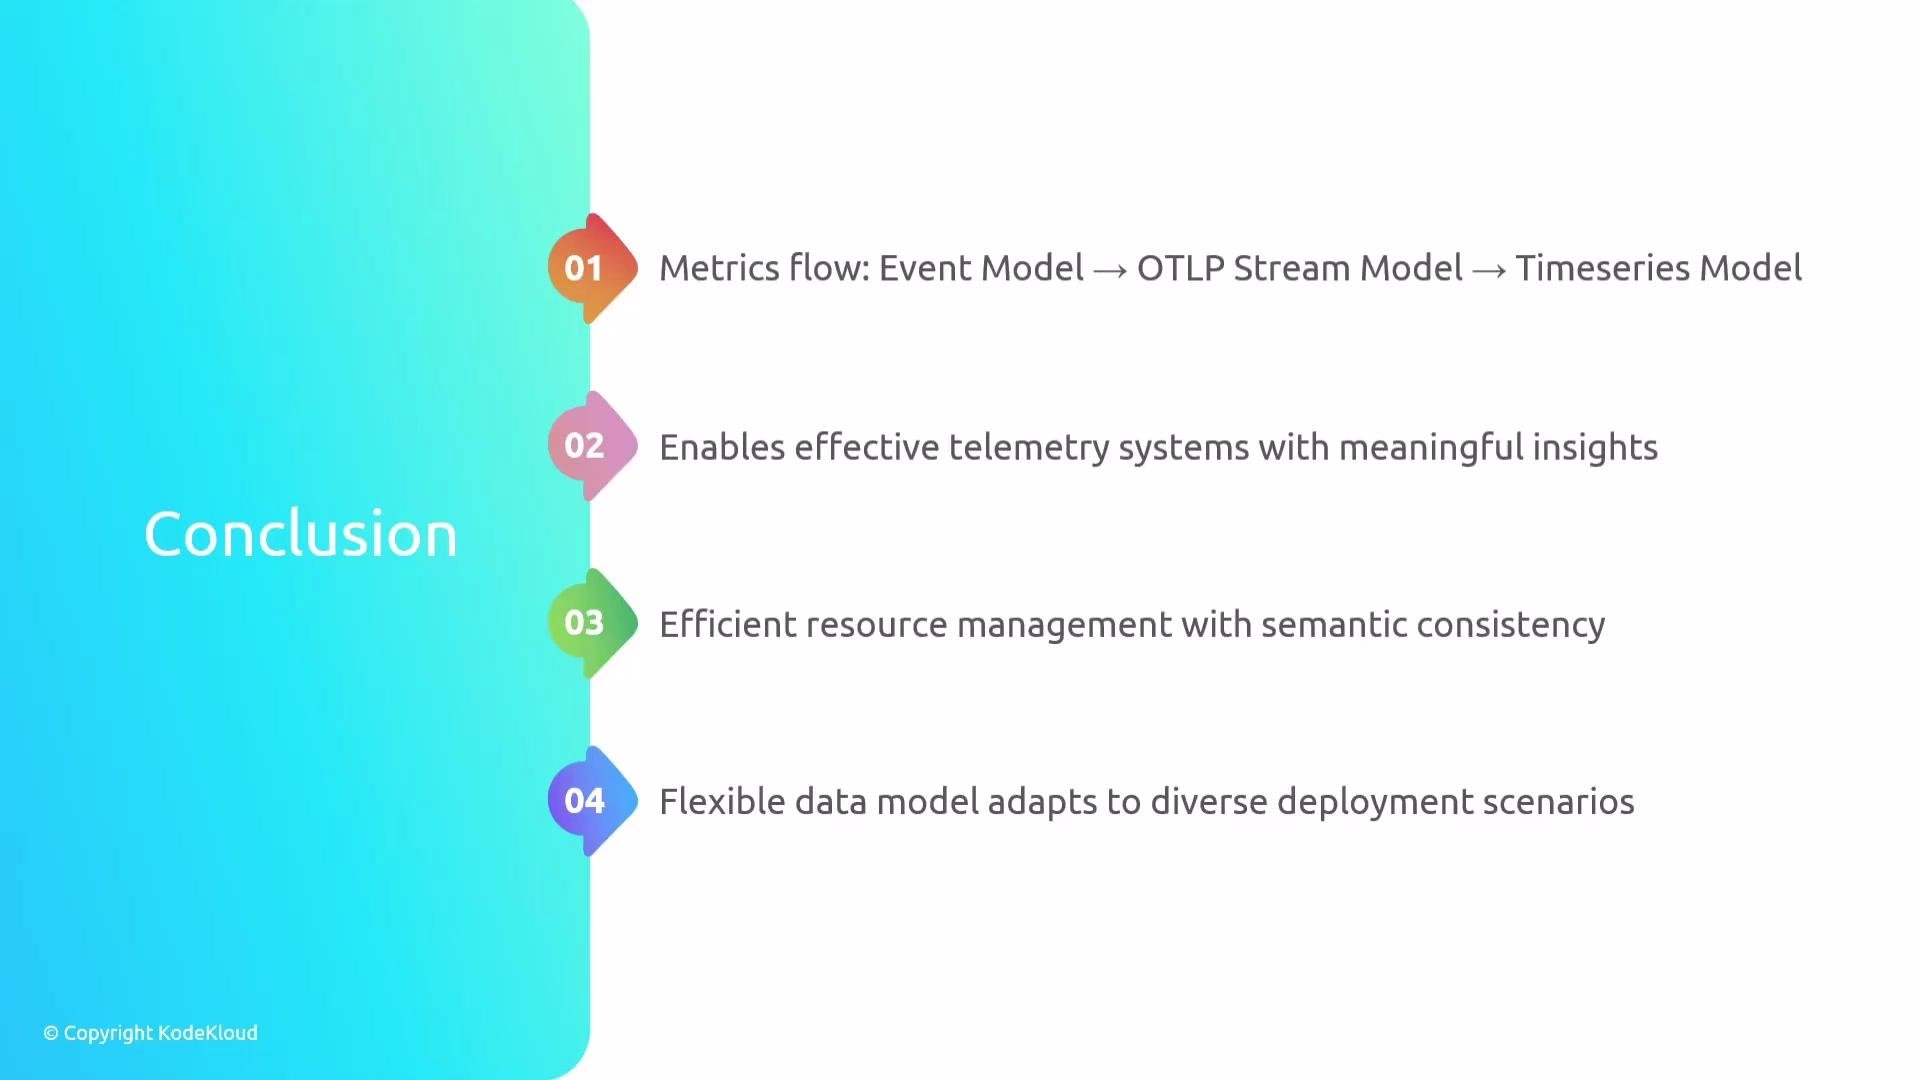
* Three stages: Event model (capture), OTLP stream model (transport/serialization), and Time series model (storage and querying).
* Transformations (temporal/spatial re-aggregation, delta/cumulative conversion) can be applied in SDKs, the Collector, or backends; the Collector is usually the best centralized place for consistent processing.
* Manage cardinality and preserve semantics to ensure metrics remain trustworthy, efficient, and actionable across simple and complex deployments.
Design your pipeline so transformations preserve semantics and keep cardinality under control. That ensures reliable, cost-effective telemetry suitable for alerting, dashboards, and long-term analysis.
Recap and practical implications
* Three stages: Event model (capture), OTLP stream model (transport/serialization), and Time series model (storage and querying).
* Transformations (temporal/spatial re-aggregation, delta/cumulative conversion) can be applied in SDKs, the Collector, or backends; the Collector is usually the best centralized place for consistent processing.
* Manage cardinality and preserve semantics to ensure metrics remain trustworthy, efficient, and actionable across simple and complex deployments.
Design your pipeline so transformations preserve semantics and keep cardinality under control. That ensures reliable, cost-effective telemetry suitable for alerting, dashboards, and long-term analysis.
 Further reading and references
* OpenTelemetry Collector: [https://opentelemetry.io/docs/collector/](https://opentelemetry.io/docs/collector/)
* OTLP protocol: [https://opentelemetry.io/docs/reference/specification/protocol/otlp/](https://opentelemetry.io/docs/reference/specification/protocol/otlp/)
* OpenTelemetry concepts and SDKs: [https://opentelemetry.io/docs/concepts/](https://opentelemetry.io/docs/concepts/)
* Prometheus (for integration considerations): [https://prometheus.io/](https://prometheus.io/)
Further reading and references
* OpenTelemetry Collector: [https://opentelemetry.io/docs/collector/](https://opentelemetry.io/docs/collector/)
* OTLP protocol: [https://opentelemetry.io/docs/reference/specification/protocol/otlp/](https://opentelemetry.io/docs/reference/specification/protocol/otlp/)
* OpenTelemetry concepts and SDKs: [https://opentelemetry.io/docs/concepts/](https://opentelemetry.io/docs/concepts/)
* Prometheus (for integration considerations): [https://prometheus.io/](https://prometheus.io/)